Research Question
To what extent does traffic affect the measuring temperature, carbon dioxide and particulate matter?
Background Information
Traffic is one of the main reasons why air quality is low in most countries globally. This low quality of air is due to the fact that vehicles produce carbon dioxide in the atmosphere, reducing air quality. The level of carbon dioxide and particulate matter are some key measurements that can indicate the quality of air or the environment. Particulate matter are particles made up of solid droplets of air which can cause health complications when inhaled (Kyung et al.5). They can be caused by any activity that generates dust, such as traffic, due to the burning of gases. On the other hand, traffic is associated with increased temperature since it causes air to mix above the surface of the road. The additional mixing of air causes escalated turbulent flow, which causes an increase in daily temperature. Hence traffic alters the measurements of temperature, carbon dioxide and particulate matter. Therefore, this environmental investigation will evaluate to what extent traffic affects the measuring of temperature, carbon dioxide and particulate matter for two weeks.
Hypothesis
In this environmental study, it is hypothesized that an increase in the quantity of traffic will increase the measure of temperature, carbon dioxide and particulate matter. This increase in the measure results from an increase in carbon dioxide emitted from the high number of vehicles. A high concentration of carbon dioxide particles causes an increase in Particulate matter.
Variables
Independent Variable
The independent variable is the level of traffic. The variable will be varied in two weeks, measured in terms of the number of vehicles.
Dependent Variables
The dependent variable is the level of temperature, carbon dioxide and particulate matter. The variables will be varied in the field for two weeks, measured with the aid of respective instruments.
Control Variables
Time Factor: Time is a critical factor in assessing environmental patterns. All measurements of three factors were taken in the afternoon over two weeks.
Location Factor: Location is another factor that plays a crucial role in influencing traffic and measuring the four quantitative variables. Hence in order to ensure the accuracy and consistency of the values measured, it was essential to use the same location.
Method and Procedure
Materials and Equipment Used
- Gloves: They will be worn throughout the experimental study to ensure safety.
- A lab coat: It will be worn throughout the experimental study to ensure safety.
- A notebook: For recording the qualitative measurements and quantitative data.
- Carbon dioxide sensor. For measuring the level of carbon dioxide produced by the vehicles.
- Thermometer. For measuring the level of temperature within the area of study.
- Diffusion Charger. For measuring the particulate matter present.
Procedure
- Assemble all the necessary equipment and materials.
- Identify the area of study.
- Request permission to conduct an environmental investigation from the relevant authorities
- Identify the area of study
- Determine the number of vehicles present
- Determine the level of temperature using the thermometer
- Determine the level of carbon dioxide using a carbon dioxide sensor
- Determine the level of particulate matter using a diffusion charger
Repeat procedures 5 to 8 for two weeks and tabulate all the results obtained.
Risk Assessment and Ethical Considerations
- Hand gloves and the lab coat were always worn when investigating to prevent the skin from being harmed by the emitted particles.
- The equipment was handled with sensitivity to prevent any chances of unprecedented damage.
- The measurements were taken while standing on the pedestrian line to avoid being hit by incoming vehicles.
Sampling Survey
In data collection, observation and calculation of levels using the equipment were conducted. This strategy was suitable for obtaining the impact of traffic on measurements of temperature, carbon dioxide and particulate matter throughout the two weeks. A qualitative survey was conducted to assess the air quality within the surrounding on a score of 1 to 3, from low to good air quality, respectively, as depicted below. This survey sampling strategy was found appropriate to validate the impact of traffic on temperature, carbon dioxide and particulate matter in the surrounding.
Table 1: Quality Assessment Sampling Survey
| Ranking | Description |
| 1 | Low-quality air, level of carbon dioxide above 100 ppm, |
| 2 | Moderate quality air temperature, level of carbon dioxide around 50 ppm. |
| 3 | Good quality air, level of carbon dioxide below 50 ppm. |
Data
Qualitative Data
An increase in traffic was noted to contribute to an increase in the measuring of temperature, carbon dioxide and particulate matter. A huge proportion of vehicles observed were personal vehicles compared to commercial/public vehicles.
Quantitative Data
Table 2: Quantitative Data for the Traffic impacts over 14 days
| Traffic effects on Measuring Temperature, Carbon dioxide and Particulate matter | ||||
| Days | Traffic | Temperature | Carbon dioxide | Particular matter |
| Day 1 | 10 | 24 | 50 | 10 |
| Day 2 | 12 | 25 | 55 | 11 |
| Day 3 | 15 | 30 | 60 | 12 |
| Day 4 | 14 | 27 | 65 | 14 |
| Day 5 | 15 | 30 | 60 | 12 |
| Day 6 | 17 | 38 | 65 | 15 |
| Day 7 | 16 | 36 | 70 | 20 |
| Day 8 | 17 | 38 | 75 | 22 |
| Day 9 | 24 | 39 | 80 | 25 |
| Day 10 | 26 | 40 | 85 | 27 |
| Day 11 | 30 | 42 | 90 | 30 |
| Day 12 | 35 | 43 | 95 | 32 |
| Day 13 | 40 | 45 | 100 | 33 |
| Day 14 | 45 | 50 | 105 | 35 |
Data Processing and Graphs
Overview
The data collected in this investigative study will be used to create different graphical plots to depict the relationship between traffic, temperature, carbon dioxide and particulate matter. The measure for the respective variables was calculated using respective instruments.
Sample Calculations
The main mathematical calculation in this investigation was linear regression constant and was calculated using the following formulae:
Linear Regression Constant, R =√(R²)
The calculation was computed after the data had been plotted.
Graphical Plots
Three different graphical plots were created under this sub-section to illustrate the relationship between the impacts of traffic on temperature, carbon dioxide and particulate matter.
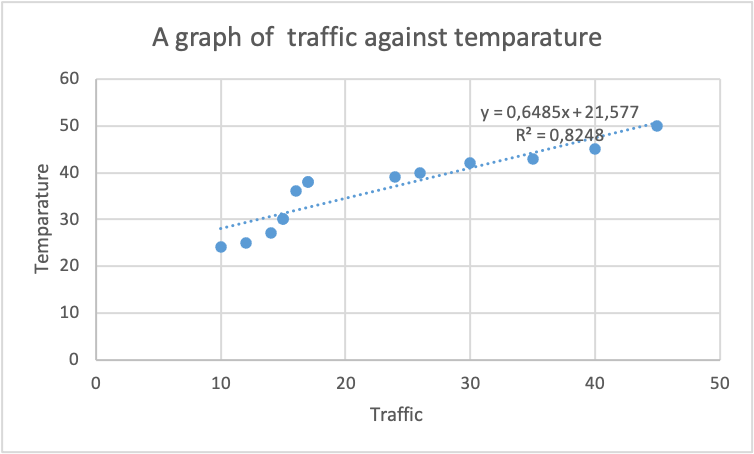
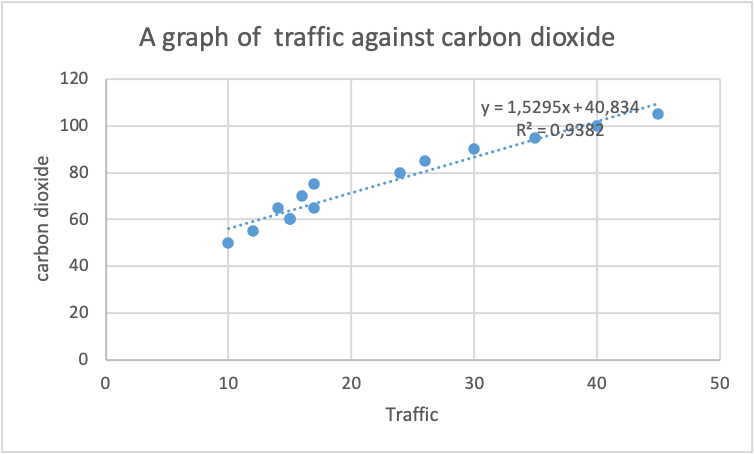
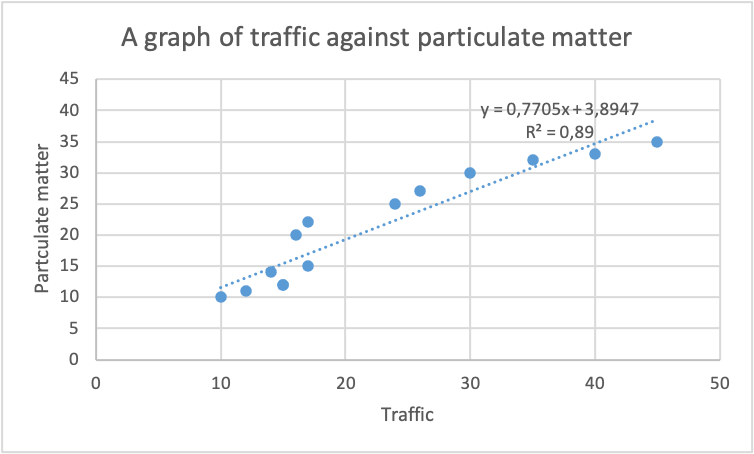
The graphical plots above show that the relationship between traffic and temperature, carbon dioxide and particulate matter is directly proportional. The trend assumed by all the trend lines is indicative that traffic affects the measuring of temperature, carbon dioxide and particulate matter to a greater extent. An increase in traffic results in a proportional increase in measurements of the three factors. Consequently, the regression constants obtained were above 0.5, which supported a strong relationship between traffic and temperature, carbon dioxide and particulate matter.
Conclusion
The intended purpose of this environmental-based investigation was to evaluate the impact of traffic on three environmental factors: temperature, carbon dioxide and particulate matter. It had been hypothesized that an increase in traffic would automatically lead to an increase in three factors. The trends and the conclusions arrived at after collecting and processing the data obtained from the experimental-designed study were as presented in the table below.
Table 3: Conclusions on Impacts of Traffic, on temperature, carbon dioxide and Particulate matter
| Trend Identified | The conclusion in the Trend Leads to | Data Supporting the Conclusion |
| The impact of traffic on temperature was significant and proportional | An increase in traffic increased temperature readings | The regression constant value was. |
| The impact of traffic on carbon dioxide was significant and proportional | An increase in traffic increased carbon dioxide measurements | The constant regression value was. |
| The impact of traffic on particulate matter was significant and proportional. | An increase in traffic increased particulate matter measurements. | The constant regression value was. |
Based on all the trends in data sets and conclusions arrived at, the hypothesis of this study was found to be fully supported. The change in traffic influences the measure of temperature, carbon dioxide and particulate matter, indicative that it is important to control traffic for a safe and clean environment.
Evaluation
Table 4: Strengths and how they contributed to Good Results
| Strengths | How Did it Assist Lab in Getting Good Results |
| Time | The use of afternoon hours and two weeks period in conducting the investigative study ensured a comprehensive assessment of the impact of traffic on the three environmental factors. |
| Qualitative Data | The inclusion of qualitative data increased the level of validity of the impact of traffic on the measured factors. |
Table 5: Weaknesses and how they contributed to Poor Results
| Weakness | How it Affected the Lab to Get Poor Results |
| Atmospheric Nature | Considering that the entire investigative study was done within the same environment, the changes in atmospheric factors, such as humidity, were not controlled. They could have directly impacted measurements of the three environmental factors affecting the accuracy level of the collected data. |
| A limited number of days | Only fourteen days were allocated to the investigation, which might have lowered the investigation’s validity. |
Improvements
Several improvements can be instituted in this investigation. First, the number of days in the impact measurements can be increased to at least 30 days. The inclusion of trials would ensure increased levels of accuracy of data collected. Additionally, it would be possible to examine the level of variability in the data sets through the chi-square, and Pearson approaches.
Application
The environmental concept learnt in this investigation can be used by the government and environmental-based organizations to advise and encourage human beings on the need to control traffic for a quality and conducive environment.
Works Cited
Kyung, Sun Young, and Sung Hwan Jeong. “Particulate-matter related respiratory diseases.” Tuberculosis and respiratory diseases 83.2 (2020): 116.
 write
write