Introduction
A spike in oil and fuel prices is a significant economic event for the Canadian consumer market. This study used a quantitative method to investigate the relationship between fuel and food prices. This report provides the systematic approach and the results we obtained from the Analysis. This research aimed to unveil the multifaceted views about the connection between fuel and food retail prices and offer insight into the broader implications for the Canadian consumer environment. This study utilized Monthly Regular unleaded gasoline prices (2006-2023) to represent fuel prices in the Analysis. Average Monthly Consumer Price Index (CPI) for Retail Food Items in Canada (2006-2023), represented food prices in the Analysis. The combined dataset used for this Analysis has more than 5000 observations distributed across more than three variables. The combined dataset used for this Analysis has more than 5000 observations distributed across more than three variables.
Literature Review
Typically, available reputable sources ascertain that escalating food prices in Canada have become a significant concern. Notably, The Food Price Data Hub released in November 2023 emphasized a drastic rise in grocery prices, surpassing the all-items Consumer Price Index (CPI) since December 2021 (Statistics Canada, 2023). In addition, according to Fradella (2023), energy prices surged in early 2022 due partly to the Russian invasion of Ukraine, among other reasons. Ideally, this turn of events led to lesser oil output from oil-producing nations. While more deficient oil supply affects the input price for food production, contributing to higher food prices, it can also lead to an energy crisis that impacts fertilizer production due to natural gas prices.
Fuel Prices Historical Trends
The research first delved into the historical trend of fuel prices using relevant literature to attempt to understand the phenomenon and how it might affect food prices in Canada. Fuel prices are internationally correlational and do not necessarily get bound by factors of the local economy to a greater extent than external international factors. For instance, the global financial crisis of 2008 triggered a sharp decline in oil prices due to reduced demand. According to Smith and Swain (2010), this crisis was pivotal in reshaping the energy landscape. Volatile geopolitical tensions in the Middle East, notably documented by Xie et al. (2023), had pronounced impacts on oil prices, introducing volatility in subsequent years.
Another important factor that affected historical fuel prices in North America was the advent of shale oil production, explored by Geng et al. (2016). Such a development emerged as a transformative factor, contributing to increased domestic oil supply and influencing global prices. The COVID-19 pandemic, as analyzed by Wang et al. (2022), led to an unprecedented drop in oil demand, causing a sharp decline in prices. As early as 2009, scholars like Smith et al. (2009) emphasized the significant relationship between economic downturns and energy markets.
Undisputedly, Canada is a net oil exporter, and changes in global demand and supply dynamics directly impact fuel prices locally. Exchange rates are crucial factors that affect the price of Fuel locally. A weaker Canadian dollar increases the cost of imported oil, leading to higher fuel prices domestically. As can be safely deduced, domestic production costs influence fuel prices, including extraction, refining, and transportation expenses. Recent developments, such as carbon pricing mechanisms, increase fuel producers’ costs.
Relationship between Food Prices and Fuel Prices in Canada
A report compiled by researchers from Dalhousie University, the University of Guelph, the University of Saskatchewan, and the University of British Columbia predicted that an average family of four would have a 12-month food bill of up to $14,767 going to 2023, an increase of up to $966 from 2021. The research established that transportation costs and reduced maritime transport capacity were high contributors to this trend, a reason that can be tied to fuel prices worldwide – and not only in Canada (Longwell, 2021). Though fuel prices are not the only cause of high food prices, most other reasons can be indirectly tied to high fuel prices. For example, causes such as increased retail operating costs, increased input prices, and retail operating costs can all point to fuel prices varying degrees as their cause (Casaletto, 2023).
Therefore, it is imperative to note that the available literature on the relationship between reasonable prices and the cost of Fuel shows that increased fuel prices elevate transportation costs, affecting the entire supply chain. This fact explains why different retail prices depend within Canada and on geography; withers and food processors face increased operational expenses as transportation costs rise. High food production costs translate to higher food prices for consumers.
Methodology
The data was sourced from the Statistics Canada Website to represent our variables in this study. Monthly Regular unleaded gasoline prices (2006-2023) collected from the pump are used as a proxy representing the Fuel variable in our Analysis. The average Monthly Consumer Price Index (CPI) for Retail Food Items in Canada (2006-2023) was used to proxy our food price trend variable. The combined dataset used for this Analysis has more than 5000 observations distributed across more than three variables. The Analysis heavily used Tableau to visualize the relationship between fuel prices and average food prices. This tool comes in handy as it allows interactive and dynamic representation, thus enabling a comprehensive understanding of geographical and temporal variations.
Analysis Results
T-Tests
An initial T-test was conducted to ascertain the significance or lack thereof in the relationship between our two variables. The first t-test – which assumes equal variances, reveals a significant association when comparing Fuel Price and Food CPI. The mean fuel price was 118.45. The mean food Consumer Price Index (CPI) stood at 138.20. The variance in fuel prices was 480.27, and food CPI was 367.64, suggesting notable variability in both variables. A t Statistic of -10.42 indicates a substantial difference between the means, with a P-value of 8.19E-23, well below the significance threshold. The Statistics fall beyond the critical values for both one-tail and two-tail tests.
Table 2: Results of t-test that assumes equal Variances between Variables
| t-Test: Two-Sample Assuming Equal Variances | ||
| Fuel Price | Food CPI | |
| Mean | 118.4542056 | 138.203271 |
| Variance | 480.2703813 | 367.6360925 |
| Observations | 214 | 214 |
| Pooled Variance | 423.9532369 | |
| Hypothesized Mean Difference | 1 | |
| d-f | 426 | |
| t Stat | -10.42392916 | |
| P(T<=t) one-tail | 4.09313E-23 | |
| t Critical one-tail | 1.648438388 | |
| P(T<=t) two-tail | 8.18626E-23 | |
| t Critical two-tail | 1.965548282 | |
The T-test results above support the rejection of the null hypothesis, affirming that there is a statistically significant difference between fuel prices and food CPI. With 214 observations for both fuel prices and food CPI, the Analysis benefits from a substantial sample size, contributing to the validity of the results. The takeaway from this result is that fluctuations in fuel prices have a noteworthy impact on the average food prices represented by the Consumer Price Index.
Testing the above stance further, a second T-Test was conducted with two samples for mean. As before, the mean fuel price is calculated at 118.45, with a variance of 480.27, based on 214 observations. The mean average food price stands at 138.20, with a slightly lower conflict of 367.64 across the same number of observations.
Table 2: Paired T-tests for Two Samples
| t-Test: Paired Two Sample for Means | ||
| Fuel Price | Food CPI | |
| Mean | 118.4542056 | 138.203271 |
| Variance | 480.2703813 | 367.6360925 |
| Observations | 214 | 214 |
| Pearson Correlation | 0.646771884 | |
| Hypothesized Mean Difference | 0 | |
| d-f | 213 | |
| t Stat | -16.55985193 | |
| P(T<=t) one-tail | 1.94242E-40 | |
| t Critical one-tail | 1.652038878 | |
| P(T<=t) two-tail | 3.88484E-40 | |
| t Critical two-tail | 1.971163885 | |
A Pearson correlation coefficient 0.65 signifies a moderately strong positive correlation between fuel and food prices. T-test statistics reveal a highly significant relationship between the variables. The null hypothesis of no difference in means was rejected, with a t-statistic of -16.56 and a p-value of 1.94E-40. These two results contribute to our earlier observation that as fuel prices increase, there is a corresponding increase in average food prices in Canada. Moreover, calculated p-values (one-tail and two-tail) are exceptionally low (1.94E-40 and 3.88E-40, respectively), indicating a solid rejection of the null hypothesis of the lack of a significant relationship between the two variables.
Further Analysis to buttress the decisive rejection of the null hypothesis led the study to deploy another T-test, this time assuming unequal variances. In this test edition, the T-statistic indicates a significant difference between the means of fuel and food prices. The t-statistic was calculated at -9.92. Associated p-values for one-tail (2.79E-21) and two-tail (5.59E-21) tests are well below conventional significance levels, reinforcing the rejection of the null hypothesis. It is essential to note the degrees of freedom (d-f) for this Analysis are 419, further ensuring the statistical validity of our results.
Table 3: Results of t-test that Assumes Unequal Variances between Variables
| t-Test: Two-Sample Assuming Unequal Variances | ||
| Fuel Price | Food CPI | |
| Mean | 118.4542056 | 138.203271 |
| Variance | 480.2703813 | 367.6360925 |
| Observations | 214 | 214 |
| Hypothesized Mean Difference | 0 | |
| d-f | 419 | |
| t Stat | -9.921548497 | |
| P(T<=t) one-tail | 2.79435E-21 | |
| t Critical one-tail | 1.64849841 | |
| P(T<=t) two-tail | 5.58871E-21 | |
| t Critical two-tail | 1.965641842 | |
The T-test results above point out a substantial and statistically significant difference between fuel and food prices in Canada. As is expected, on average, fuel prices are significantly lower than average CPI food prices. However, all the T-tests further imply a firm rejection of the null hypothesis that there is no significant relationship between the two variables under investigation. Practically, t-test results indicate that fluctuations in fuel prices have a notable impact on average food prices represented by the Consumer Price Index. Critical to our Analysis, rejection of the null hypothesis across all tests signifies a consistent and significant relationship between fuel and food prices in Canada.
OLS Regression
The statistical significance of the regression is evident, as indicated by a Multiple R of 0.65 and an R Square of 0.42. Effectively, 41.83% of the variation in food prices can be explained by changes in fuel prices, as suggested by our model results. An R Square of 0.42 reinforced the model’s reliability after accounting for the number of predictors.
Table 4: OLS Regression Results
| Regression Statistics | |
| Multiple R | 0.646772 |
| R Square | 0.418314 |
| Adjusted R Square | 0.41557 |
| Standard Error | 14.65802 |
| Observations | 214 |
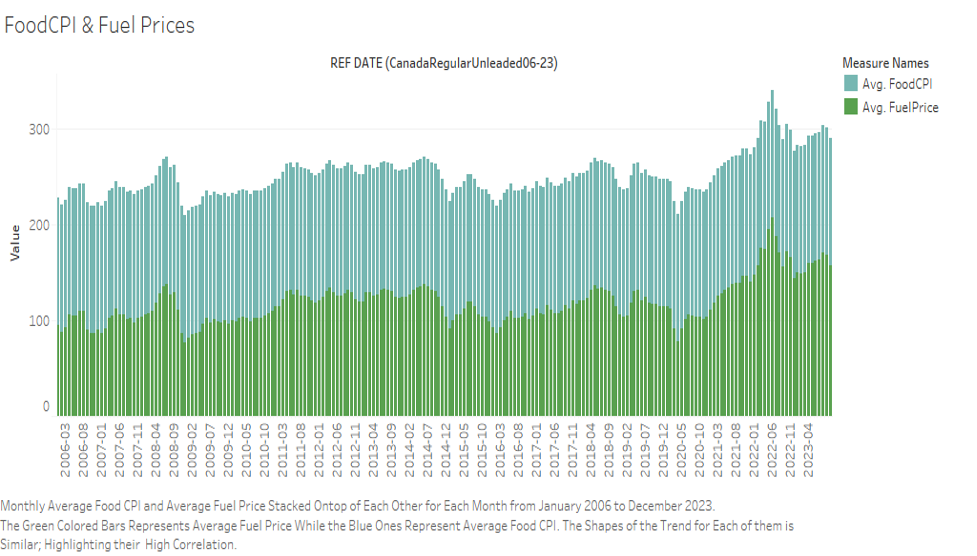
Figure 1: Average Food CPI and Average Fuel Price Visualized Monthly (2006 – 2023)
More so, the ANOVA table illustrates a solid relationship between fuel prices and food prices (F=152.46, p<0.001). According to our model, a unit increase in fuel prices is associated with a 0.57 unit increase in average food prices. The statistical significance of the results (p<0.001) indicates a robust relationship between fuel and food prices.
Figure 2: Regression Line Fit Plot
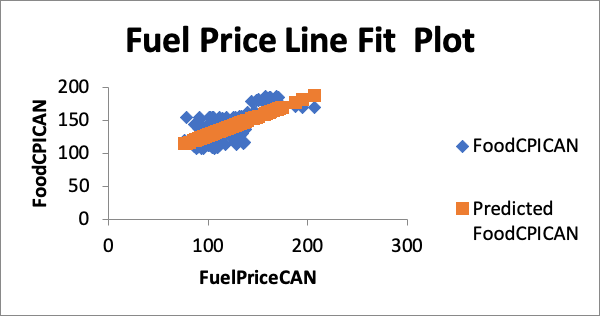
This result addresses the research objective of investigating the effect of fuel prices on average food prices. A positive coefficient for Fuel Price implies that higher fuel prices are associated with elevated average food prices, reflecting the interconnectedness of these variables. Earlier identified correlations should prompt proactive measures to address potential economic challenges arising from fuel price fluctuations, which directly impact food affordability for Canadian consumers.
Table 5: Regression ANOVA Results
| Coefficients | Standard Error | t Stat | P-value | Lower 95% | Upper 95% | Lower 95.0% | Upper 95.0% | |
| Intercept | 71.17349 | 5.520364 | 12.8929 | 1.84E-28 | 60.29166 | 82.05533 | 60.29166 | 82.05533 |
| Fuel Price | 0.565871 | 0.045829 | 12.34738 | 9.59E-27 | 0.475531 | 0.65621 | 0.475531 | 0.65621 |
Conclusion
The Food Price Data Hub released in November 2023 emphasized a drastic rise in grocery prices, surpassing the all-items Consumer Price Index (CPI) since December 2021 (Statistics Canada, 2023). An average family of four would have a 12-month food bill of up to $14,767 in 2023, an increase of up to $966 from 2021 (Longwell, 2021). The variance in fuel prices was 480.27, and food CPI was 367.64, suggesting notable variability in both variables. The available literature on the relationship between reasonable prices and the cost of Fuel shows that increased fuel prices elevate transportation costs, affecting the entire supply chain. This analysis’ T-Test results underscore a substantial and statistically significant difference between fuel and food prices in Canada. The regression model Revealed that changes in fuel prices can explain 41.83% of the variation in food prices. In a Nutshell, a robust statistical analysis reveals a significant positive correlation, with fuel prices demonstrating 41.83% of the variation in average food prices. Such a finding carries substantial implications for the Canadian consumer environment, emphasizing the sensitivity of food prices to fluctuations in fuel costs. With predictions of rising fuel prices in 2024, we anticipate a continued upward trend in average food prices, regardless of the inflation outlook.
References
Casalleto, L. (2023, December). ‘Not as dire’: Canada’s 2024 food price report released. Here’s what experts are forecasting.
Canada’s 2024 food price report is here. What experts are saying (citynews.ca)
Fradella, A. (2022, November 16). Behind the Numbers: What’s Causing Growth in Food Prices. Statistics Canada.
https://www150.statcan.gc.ca/n1/pub/62f0014m/62f0014m2022014-eng.htm
Geng, J. B., Ji, Q., & Fan, Y. (2016). How regional natural gas markets have reacted to oil price shocks before and since the shale gas revolution: A multi-scale perspective. Journal of Natural Gas Science and Engineering, 36, 734-746.
Smith, A., & Swain, A. (2010). The global economic crisis, Eastern Europe, and the former Soviet Union: development models and the contradictions of internationalization. Eurasian Geography and Economics, 51(1), 1-34.
Statistics Canada. (2023, November 7). Food Price Data Hub. https://www150.statcan.gc.ca/n1/daily-quotidien/231107/dq231107e-eng.htm
Longwell, K. (2021, December 31). Food prices are going up in Canada, and here’s what experts predict for 2022. BlogTO. https://www.blogto.com/eat_drink/2021/12/food-prices-going-up-canada-2022/
Smith, J. L. (2009). World oil: market or mayhem? Journal of Economic Perspectives, 23(3), 145-164.
Wang, Q., Li, S., Zhang, M., & Li, R. (2022). Impact of COVID-19 pandemic on oil consumption in the United States: a new estimation approach. Energy, 239, 122280.
Xie, H., Khurshid, A., Rauf, A., Khan, K., & Calin, A. C. (2023). Is geopolitical turmoil driving petroleum prices and financial liquidity relationship? Wavelet-based evidence from the Middle East. Defence and Peace Economics, 34(6), 810-826.
 write
write