Executive Summary
This paper investigates and predicts the New York City (NYC) deaths due to heart diseases and cancer. Evaluation of the leading causes of death in NYC is vital towards the development and implementation of policies that increase the life expectancy of the NYC people or reduce cause-specific deaths. The study applies a quantitative research method to identify factors that influence the number of deaths in NYC. Three statistical techniques were utilized; descriptive statistics, One-Way Analysis of Variance (ANOVA), and regression analysis.
Findings exhibited that heart diseases led to a significantly higher number of deaths as compared to cancer and all other causes. Findings also revealed a significant variation in the number of deaths based on individuals’ race/ethnicity. On average, Non-Hispanic Whites had the highest number of deaths, followed by Non-Hispanic Blacks. Findings also indicated no significant influence of gender on the number of deaths.
One of the implications of the findings is that it lays a foundation for subsequent research. The findings also add to the existing literature on health matters. On a practical spectrum, the findings offer insight in light of resource allocation, more resources should be dedicated towards the control and prevention of heart diseases. Further, the resources should be allocated in respect of the disparities in races/ethnicities, some races/ethnicities should be allocated more resources as they are more affected.
Introduction
This paper investigates and predicts the New York City (NYC) deaths due to heart diseases and cancer. Cause-specific evaluation of mortality rates is essential towards the identification and formulation of policies for the improvement of the health and life expectancies of a people. For instance, study findings may offer new insights regarding the classification of diseases and codification of mortality for institutions such as the International Classification of Functioning, Disability, and Health (ICF). According to a Centers for Disease Control and Prevention (CDC) report, heart disease was the leading cause of death in NYC in 2017, followed by Cancer (CDC, 2017). Globally, non-communicable diseases accounted for seven of the top ten causes of death in 2019, according to the World Health Organization (WHO, 2019). Non-communicable diseases include asthma, stroke, heart disease, cancer, and diabetes among others. In 2020, the annual number of deaths in the U.S due to heart diseases was 690,882 while deaths due to cancer were 598,932 (Ahmad & Anderson, 2020). The annual number of deaths due to kidney disease in 2020 was 52,260 while deaths due to unintentional injuries were 192,176. Deaths due to heart diseases depict an increasing trend in the period 2015 – 2020, with the largest increase since 2012 being 4.8% for the period 2019 – 2020 (Ahmad & Anderson, 2020). The key objective of the current study is to identify and quantify key factors that contribute to death in NYC, the U.S.
The study seeks to answer three research questions;
- Is there a significant variation in the average number of deaths across different leading causes?
- Is there a significant variation in the average number of deaths between genders (male, female)?
- Is there a significant variation in the average number of deaths across different races/ethnicities?
- What is the extent of the relationship between the number of deaths, sex, leading causes, and race/ethnicity?
To answer the research questions, and as such meet the research objective, the study will utilize available data (Data.cityofnewyork.us, 2022). The data is quantitative hence the study will apply quantitative research methods. Effectively, the study will deploy three statistical techniques; descriptive statistics, One-Way Analysis of Variance (ANOVA), and regression analysis. The present study findings could help identify the major causes of deaths in NYC, and also indicate which gender and races/ethnicities experience the highest number of deaths. The findings could be useful as they can be applied for effective healthcare resource allocation.
Data Description
The present study will use data acquired from the NYC data portal (Data.cityofnewyork.us, 2022). The data entails leading causes of deaths of NYC citizens and spans the period 2007 – 2019. The raw data comprises 1,272 observations (rows) on 7 variables (columns). The variables include; year, leading cause, sex, race/ethnicity, deaths, death rate, and age-adjusted death rate. Leading cause, sex, and race/ethnicity are categorical variables while death rate and age-adjusted death rate are continuous variables. ‘Deaths’ is a discrete variable. The NYC death certificate, which is provided for every death in New York, is used to determine the cause of death. The current study utilizes a sample of 330 observations.
Data Analysis and Results
Descriptive Statistics
As shown in Table 1, the mean (M) number of deaths is 1,133 and has a standard deviation (SD) of 1,320. The minimum number of deaths is 8 and the maximum is 7,050. The average number of deaths due to cancer is 1,080 (SD = 1,124) while the average number of deaths due to heart diseases is 1,503 (SD = 1,769). The average number of deaths for females is 1,166 (SD = 1,411) while the average number of deaths for males is 1,100 (SD = 1,225). The average number of deaths for females is slightly higher than that for males. Non-Hispanic Whites have the highest average number of deaths (M = 3,446, SD = 1,322), followed by Non-Hispanic Blacks (M = 1,751, SD = 407). The average number of deaths for Hispanics (M = 1,180, SD = 164) is higher than that of ‘Asian and Pacific Islander’ (M = 437, SD = 129). Other races/ethnicities have the lowest average number of deaths (M = 34, SD = 16).
Table 1: Summary Statistics
| N | M | SD | Minimum | Maximum | |
| Deaths | 330 | 1,133 | 1,320 | 8 | 7,050 |
| Deaths by leading cause | |||||
| All other causes | 110 | 815 | 789 | 8 | 2,595 |
| Cancer | 110 | 1,080 | 1,124 | 11 | 3,518 |
| Heart disease | 110 | 1,503 | 1,769 | 19 | 7,050 |
| Deaths by sex | |||||
| Female | 165 | 1,166 | 1,411 | 11 | 7,050 |
| Male | 165 | 1,100 | 1,225 | 8 | 5,632 |
| Deaths by Race/Ethnicity | |||||
| Asian and Pacific Islander | 54 | 437 | 129 | 182 | 731 |
| Hispanic | 54 | 1,180 | 164 | 775 | 1,603 |
| Non-Hispanic Black | 54 | 1,751 | 407 | 1,163 | 2,725 |
| Non-Hispanic White | 54 | 3,446 | 1,322 | 1,680 | 7,050 |
| Not Stated/Unknown | 54 | 69 | 37 | 11 | 193 |
| Other Race/ Ethnicity | 60 | 34 | 16 | 8 | 74 |
Plots
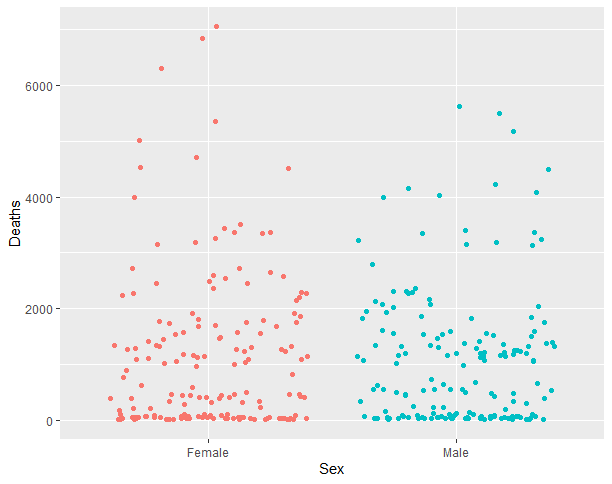
Figure 1 illustrates the spread of deaths by the leading causes. It depicts that, considerably, more deaths are due to heart diseases. Figure 2 demonstrates the spread of deaths by gender. It portrays that the spread of deaths is nearly equal across the two genders.
Figure 1: Distribution of Deaths by Leading Causes
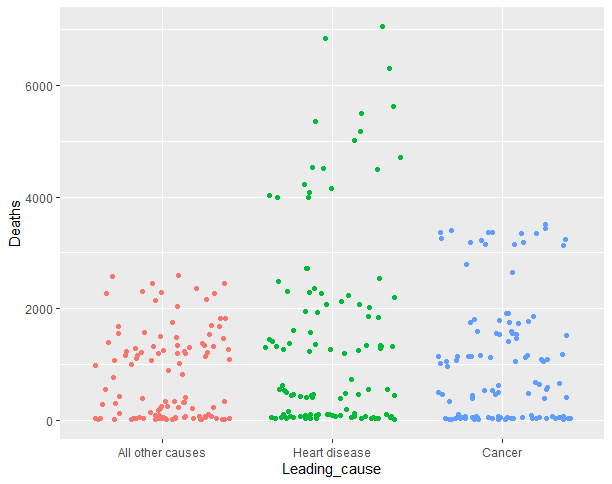
Figure 2: Distribution of Deaths by Sex
Variation in Average Deaths by Leading Causes
Table 2 results show that there exists a statistically significant difference between the ‘leading causes’ groups as determined by One-Way ANOVA, F (2, 327) = 7.94, p < 0.001. This means that the average number of deaths is significantly different for at least one of the ‘leading causes’ groups. Post-hoc tests will be utilized to inform which means are significantly different from one another.
Table 2: One-Way ANOVA Results
| Sum of Squares | df | Mean Square | F | p | |
| Leading cause | 26547202.59 | 2 | 13273601.29 | 7.94 | 0.000 |
| Error | 546616488.64 | 327 | 1671610.06 |
Post-hoc Results
Table 3 results show that there is a statistically significant difference in the average number of deaths between the ‘heart disease’ and the ‘all other causes’ groups (p < 0.001), as well as between the ‘cancer’ and ‘heart disease’ groups (p < 0.05). The results indicate that heart diseases have a significantly higher number of deaths as compared to cancer (higher by 423) and all other causes (higher by 689). However, there are no significant differences between the ‘cancer’ and the ‘all other causes’ groups (p > 0.05).
Table 3: Tukey Post-hoc Results
| Difference | Lower | Upper | P-value | |
| Heart disease vs All other causes | 689 | 278.3 | 1,099.2 | 0.000 |
| Cancer vs All other causes | 266 | -145.0 | 676.0 | 0.281 |
| Cancer vs Heart disease | -423 | -833.7 | -12.8 | 0.042 |
Variation in Average Deaths by Sex
Table 4 results exhibit that there exists no statistically significant difference between the gender groups as established by One-Way ANOVA, F (1, 328) = 0.21, p = 0.650. This means that the average number of deaths for males is not significantly different from the average number of deaths for females; the number of deaths is similar for the two groups.
Table 4: One-Way ANOVA Results
| Sum of Squares | df | Mean Square | F | p | |
| Sex | 360030.30 | 1 | 360030.30 | 0.21 | 0.650 |
| Error | 572803660.92 | 328 | 1746352.62 |
Variation in Average Deaths by Race/Ethnicity
Table 5 results reveal that there exists a statistically significant difference between the race/ethnicity groups as established by One-Way ANOVA, F (5, 324) = 293.03, p < 0.001. This means that the average number of deaths is significantly different for at least one of the race/ethnicity groups. Post-hoc tests will be utilized to inform which means are significantly different from one another.
Table 5: One-Way ANOVA Results
| Sum of Squares | df | Mean Square | F | p | |
| Race ethnicity | 469369319.74 | 5 | 93873863.95 | 293.03 | 0.000 |
| Error | 103794371.49 | 324 | 320353.00 |
Post-hoc Results
Table 6 results exhibit that there exists a statistically significant difference in the average number of deaths between Non-Hispanic Blacks and ‘Asian and Pacific Islanders’ (p < 0.001). The Non-Hispanic Blacks experience a significantly higher (by 1,315) number of deaths as compared to Asian and Pacific Islanders. There exists a statistically significant difference in the average number of deaths between Hispanics and ‘Asian and Pacific Islanders’ (p < 0.001). The Hispanics experience a significantly higher (by 743) number of deaths as compared to Asian and Pacific Islanders. Table 6 results also reveal that there exists a statistically significant difference in the average number of deaths between all the other pairs of race/ethnicity groups (p < 0.05), except between the ‘Other Race/ Ethnicity and Not Stated/Unknown’ pair (p > 0.05).
Table 6: Tukey Post-hoc Results
| Difference | Lower | Upper | P-value | |
| Non-Hispanic Black vs Asian and Pacific Islander | 1315 | 1,002.2 | 1,626.7 | 0.000 |
| Hispanic vs Asian and Pacific Islander | 744 | 431.3 | 1,055.9 | 0.000 |
| Non-Hispanic White vs Asian and Pacific Islander | 3009 | 2,696.9 | 3,321.5 | 0.000 |
| Not Stated/Unknown vs Asian and Pacific Islander | -368 | -679.9 | -55.3 | 0.012 |
| Other Race/ Ethnicity vs Asian and Pacific Islander | -403 | -706.9 | -98.1 | 0.002 |
| Hispanic vs Non-Hispanic Black | -571 | -883.1 | -258.6 | 0.000 |
| Non-Hispanic White vs Non-Hispanic Black | 1695 | 1,382.5 | 2,007.0 | 0.000 |
| Not Stated/Unknown vs Non-Hispanic Black | -1682 | -1,994.3 | -1,369.8 | 0.000 |
| Other Race/ Ethnicity vs Non-Hispanic Black | -1717 | -2,021.3 | -1,412.6 | 0.000 |
| Non-Hispanic White vs Hispanic | 2266 | 1,953.3 | 2,577.9 | 0.000 |
| Not Stated/Unknown vs Hispanic | -1111 | -1,423.5 | -798.9 | 0.000 |
| Other Race/ Ethnicity vs Hispanic | -1146 | -1,450.5 | -841.7 | 0.000 |
| Not Stated/Unknown vs Non-Hispanic White | -3377 | -3,689.1 | -3,064.5 | 0.000 |
| Other Race/ Ethnicity vs Non-Hispanic White | -3412 | -3,716.1 | -3,107.3 | 0.000 |
| Other Race/ Ethnicity vs Not Stated/Unknown | -35 | -339.3 | 269.5 | 0.999 |
Regression Analysis
Model 1: Regression without Controls
Linear regression was run to predict the number of deaths from leading causes. Table 7 results show that ‘leading causes’ statistically predicts the number of deaths, F (2, 327) = 7.941, p < 0.001. Results exhibit that the mean number of deaths due to heart disease is significantly higher than that due to ‘all other causes’ (β = 814.6, p < 0.001). Results also show that the mean number of deaths due to cancer is not significantly higher than that due to ‘all other causes’ (p > 0.05). The R-squared (R2) = 0.046; indicating that 4.6% of the total variance in the number of deaths is explained by the model (model 1).
Table 7: Model 1 Regression Analysis Results
| Estimate | Std. Error | t-value | P-value | |
| (Intercept) | 814.6 | 123.3 | 6.608 | 0.000 |
| Leading cause: Heart disease | 688.8 | 174.3 | 3.951 | 0.000 |
| Leading cause: Cancer | 265.5 | 174.3 | 1.523 | 0.129 |
| Note. Reference group is ‘all other causes’. F (2, 327) = 7.941, p = 0.0004, R2 = 0.046 | ||||
Model 2: Regression with Controls
Multiple regression was run to predict the number of deaths from leading causes, sex, and race/ethnicity. Table 8 results exhibit that at least one of the independent variables statistically predicts the number of deaths, F (8, 321) = 259, p < 0.001. Results reveal that the mean number of deaths due to heart disease is significantly higher than that due to ‘all other causes’ (β = 688.8, p < 0.001). Results show that the mean number of deaths due to cancer is significantly higher than that due to ‘all other causes’ (β = 265.5, p > 0.05). Table 8 results show that gender (sex) does not significantly influence the number of deaths (p > 0.05). Results exhibit that the mean number of deaths for Non-Hispanic Blacks is significantly higher than that for ‘Asian and Pacific Islanders’ (β = 1314.5, p < 0.001). The mean number of deaths for Hispanics is significantly higher than that for ‘Asian and Pacific Islanders’ (β = 743.6, p < 0.001). The mean number of deaths for Non-Hispanic Whites is significantly higher than that for ‘Asian and Pacific Islanders’ (β = 3009.2, p < 0.001). The R-squared = 0.866; indicating that 86.6% of the total variation in the number of deaths is explained by the model (model 2). As such, model 2 is a better fit of the data than model 1 is.
Table 8: Model 2 Regression Analysis Results
| Estimate | Std. Error | t-value | P-value | |
| (Intercept) | 151.8 | 81.3 | 1.9 | 0.063 |
| Leading cause: Heart disease | 688.8 | 66.0 | 10.4 | 0.000 |
| Leading cause: Cancer | 265.5 | 66.0 | 4.0 | 0.000 |
| Sex: Male | -66.1 | 53.9 | -1.2 | 0.221 |
| Race ethnicity: Non-Hispanic Black | 1314.5 | 94.2 | 14.0 | 0.000 |
| Race ethnicity: Hispanic | 743.6 | 94.2 | 7.9 | 0.000 |
| Race ethnicity: Non-Hispanic White | 3009.2 | 94.2 | 31.9 | 0.000 |
| Race ethnicity: Not Stated/Unknown | -367.6 | 94.2 | -3.9 | 0.000 |
| Race ethnicity: Other Race/ Ethnicity | -402.5 | 91.8 | -4.4 | 0.000 |
| Note. Reference group for leading cause groups is ‘all other causes’, and the reference group for race/ethnicity groups is the ‘Asian and Pacific Islander’. F (8, 321) = 259, p < 0.001, R2 = 0.866 | ||||
Summary of Findings
Findings indicate that there exists a significant variation in the average number of deaths across the different ‘leading causes’ groups. This depicted that different causes/diseases had a varying average number of deaths; with heart diseases having the highest number of deaths. Findings also exhibited that race/ethnicity has a significant influence on the number of deaths while gender (sex) does not significantly impact the number of deaths. The findings depicted a significant variation in the number of deaths across different races/ethnicities. . On average, Non-Hispanic Whites had the highest number of deaths, followed by Non-Hispanic Blacks.
Implications
The current study findings present various implications. The findings could provide essential insights for healthcare policy formulation. The findings highlighted heart disease as the leading cause of death in NYC; it points towards the identification of strategies that can be applied to alleviate or eradicate the causes of heart diseases. The findings also contribute to existing literature and form a basis for subsequent research. On a practical spectrum, the findings offer insight in light of resource allocation, more resources should be dedicated towards the control and prevention of heart diseases. Further, the resources should be appropriated in respect of races/ethnicities, some races/ethnicities should be allocated more resources as they are more affected.
References
Ahmad, F., & Anderson, R. (2020). The Leading Causes of Death in the US for 2020. JAMA, 325(18). doi:10.1001/jama.2021.5469
CDC. (2017, 2022 21). Stats of the State of New York. Retrieved from cdc.gov: https://www.cdc.gov/nchs/pressroom/states/newyork/newyork.htm
Data.cityofnewyork.us. (2022, 3 20). New York City Leading Causes of Death. Retrieved from Data.cityofnewyork.us: https://data.cityofnewyork.us/Health/New-York-City-Leading-Causes-of-Death/jb7j-dtam
WHO. (2019, 3 21). The top 10 causes of death. Retrieved from Who.int: https://www.who.int/news-room/fact-sheets/detail/the-top-10-causes-of-death
 write
write