Executive Summary
Power generation, renewable energy, aviation, healthcare, and finance are all areas in which General Electric is active. With the help of sustainability and innovation, the firm has created state-of-the-art technologies and solutions to satisfy customer needs worldwide. GE works in highly competitive and often chaotic markets. The power market is changing due to the worldwide demand for clean, sustainable energy. Products and services from GE, a world leader in power-generating technology, may be found worldwide. Aviation is thriving due to increased demand for air travel and rigorous fuel efficiency standards. GE’s experience in wind engines/turbines with other renewable energy technology provides them an advantage. GE’s healthcare product range and commitment to R&D help keep the company competitive, and its focus on innovation helps it maintain its position as an industry leader in other areas, such as fuel efficiency. GE Capital stands out because of its wide range of banking options and dedicated support staff. Between 2021 and 2022, GE’s financial performance increased. In 2021, the company went through losses of $6.52 billion, but in 2022, it made a profit of $225 million. Revenue from continuing operations increased, indicating more profit. It was challenging to market machinery. GE’s liquidity ratios go worse between 2021 and 2022. When the current, quick, and cash ratios drop, satisfying short-term obligations with careful management of available funds becomes increasingly more challenging. Maintaining a stable debt-to-equity ratio indicates sound financial footing and a healthy debt-equity mix.
Introduction
Company Description
General Electric (GE) is a worldwide corporation that has excelled in numerous fields for decades. Founded in Boston in 1892, GE is a world leader in innovation, technology, and sustainability (Electric,2023). The company focuses on manufacturing and distribution of power, healthcare, aviation, renewable energy, and capital items are the mainstays of the business, which caters to customers worldwide (Electric, 2023), offering a wide range of services and products. Power is a division of GE that specializes in high-tech equipment and solutions for the power industry. Power generation may be made more effectively and reliably with the help of the company’s gas and steam turbines, generators, and grid solutions (Tikkanen, 2022).
GE’s knowledge in this field aids in constructing reliable energy systems and meets the evolving demands of local populations. GE’s commitment to clean and sustainable power generation is shown in its investment in the renewable energy sector (Tikkanen, 2022). The firm was an early adopter of wind energy, offering cutting-edge wind turbines and associated services to convert wind into power. Hydroelectric power, energy storage, and grid solutions are just some of GE’s many efforts in renewable energy, all to make the world a better, greener place (Tikkanen, 2022). GE’s Aviation business unit is a household name because of its industry-leading engines, systems, and services for aeroplanes. The company’s cutting-edge innovations are used by various civilian and military aircraft worldwide (Electric, 2023). By prioritizing fuel efficiency, reliability, and safety, GE Aviation is leading the aerospace industry in its ongoing reinvention and improving aircraft performance while reducing environmental impact. As a leader in the healthcare industry, medical imaging equipment, diagnostics, patient monitoring devices, and healthcare IT solutions are just some of the many products that GE develops and manufactures (Tikkanen, 2022). GE’s technology may help healthcare providers enhance the quality of care they provide to patients, boost efficiency, and streamline clinical processes.
GE Capital also provides banking and related services to companies and consumers across various sectors. In order to foster economic development and encourage long-term investment on the part of firms, this division offers commercial lending, leasing, and asset management services (Almansoori et al., 2021). In addition, GE places a premium on innovation and consistently seeks innovative ways to address social issues. The company invests much money into R&D to foster innovation and constant progress. The firm can stay abreast of technological advances and contribute to developing industrial ecosystems by partnering with corporations, educational institutions, and emerging businesses.
Industry Overview and competitive positioning
The business environment in which General Electric (GE) works is fast-paced, and the company confronts competition from a wide range of sectors. To grasp GE’s strategic position and prospects, one must have a firm grasp of the industry landscape and the company’s competitive status (Tikkanen, 2022). In the electricity sector, where GE operates, there is always a need for innovative yet reliable power sources. GE has new possibilities and difficulties due to the worldwide shift toward clean and sustainable energy sources, causing massive disruptions in the power business.
The business has become an industry leader in power generation technologies with gas and steam turbines, generators, and grid solutions (Bloomberg, 2021). The increasing focus on renewable energy and energy efficiency is reflected in GE’s efforts to develop innovative and effective solutions (Finance, 2022).
The renewable energy business in which GE operates is quite cutthroat. Due to increased environmental concerns and government support for renewable energy, wind power has experienced unprecedented expansion (Finance, Y., 2022). The company’s aviation segment faces stiff competition in a booming but saturated market. Demand for air travel, technological advances, and mandates for more excellent fuel economy are just a few factors that propel the commercial aviation industry forward (Tikkanen, 2022). As an industry leader in aircraft engines, systems, and services, GE must contend with competition from companies worldwide. The corporation has a leg up on the competition because of its commitment to innovation and ability to manufacture cleaner, more efficient engines. GE’s strategic partnerships with the aviation industry’s aircraft manufacturers and airlines help it stay ahead of the competition (Finance, 2022).
The markets for medical imaging equipment, diagnostics, and healthcare IT solutions are incredibly competitive, with multiple rivals providing unique goods and services. GE participates in the healthcare industry, characterized by a high pace of technical advancement and increased demand for healthcare. The advanced medical imaging systems, diagnostic tools, and patient monitoring equipment that comprise GE’s entire product range help the corporation stand out in the market. Continual investment in research and development ensures that the firm remains at the cutting edge of healthcare technology, allowing it to provide solutions that boost both patient outcomes and the effectiveness of healthcare systems (Tikkanen, 2022).
In addition, GE’s Capital division determines the company’s competitive standing in the financial services industry. A glut of competing financial institutions offering the same products and services exists. Commercial lending, leasing, and asset management are just some of GE Capital’s many financial offerings, giving the company a leg up on the competition (Tools, 2021). The firm is well-positioned to compete in the financial services industry because of its worldwide reach, depth of industry expertise, and focus on satisfying customers’ needs.
Comparative Financial analysis for the two consecutive years concerning the industry
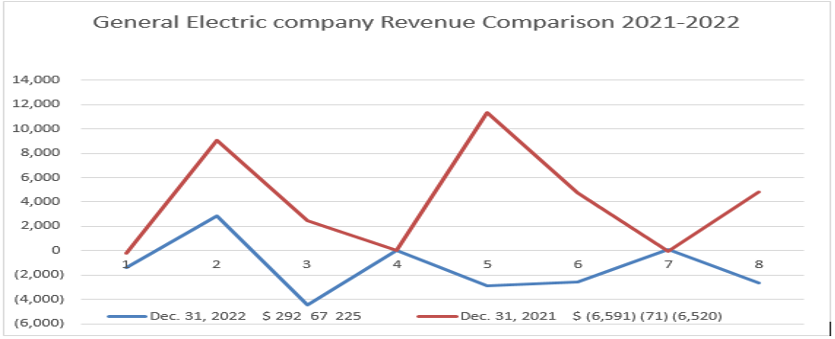
Fig1. Revenue comparison graph
In addition, there was a rise in the company’s net income (losses), which went from a net loss of $6.6 billion in 2021 to a net profit of $292 million by the end of 2022. This improved from the previous year’s net loss of $6.6 billion. The corporation reported a loss in net income for the year 2021.
Financial Statement
Comprehensive Income Statement
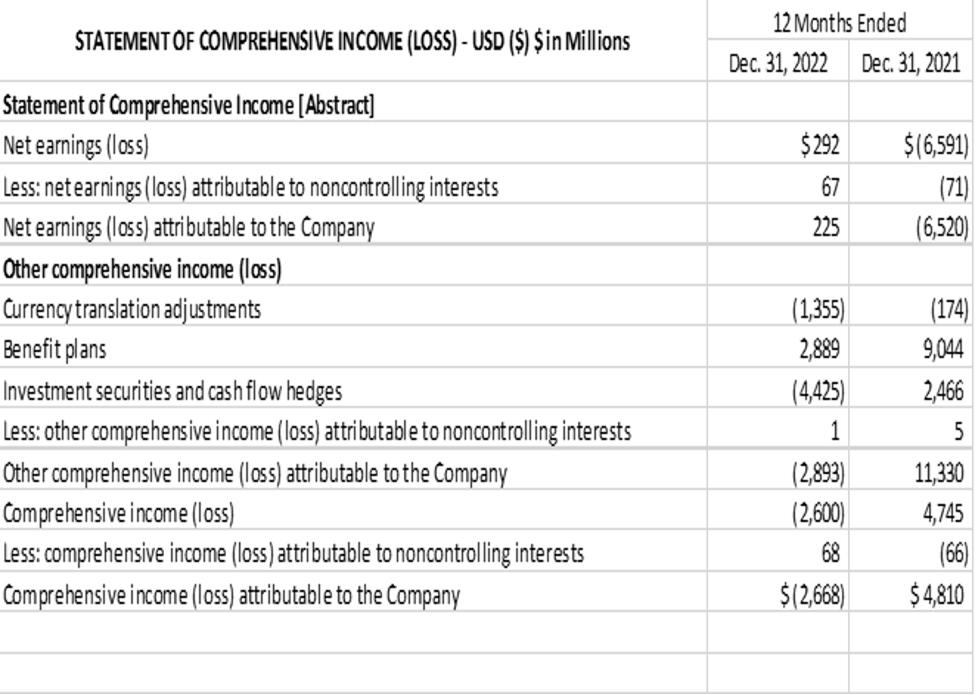
Figure 2: GE Comprehensive Income statement for the year 2021 -2022
In 2021 and 2022, significant changes were made to the income statement and comprehensive loss of General Electric (GE). In 2021 the company lost $6.52 billion, but in 2022, it made $225 million. This bodes well for the company’s financial success compared to the prior year. Other comprehensive income (loss) varied widely across the two time periods. The beneficial effects of currency translation adjustments and benefit programs contributed significantly to GE’s $11.33 billion other comprehensive income in 2021.
On the other hand, the business lost $2.89 billion in other comprehensive income in 2022, most of which was attributable to unfavourable currency translation adjustments and investment securities and cash flow hedges. The positive outcome is shown in GE’s $4.81 billion overall income (loss) for 2021. The company’s financial performance declined in 2022, evidenced by a $2.67 billion comprehensive deficit. These financial figures illustrate the ebb and flow of GE’s profits and comprehensive income throughout the time under study by highlighting the company’s ups and downs. Even after the corporation eradicated its net loss in 2022, the performance of the company was negatively impacted by the negative other comprehensive income to a large degree. GE needs to figure out what is causing these fluctuations and fix it if it wants to have stable, long-term financial success in the future.
Statement of Earning
The following table shows that the company’s revenue climbed from $74.2 billion in 2021 to $76.6 billion in 2022, while the company’s costs and fees decreased from $80.7 billion in 2021 to $76.4 billion in 2022. Between 2021 and 2022, noticeable changes may be seen by examining GE’s Statement of Earnings (Loss). The firm increased its overall income while decreasing its expenses and fees. Better budgeting and increased productivity over the year explain the drop. Earnings from continuing operations swung from a loss of $3.7 billion in 2021 to a profit of $1.4 billion in 2022 before income taxes were included, marking a decisive turn to profitability.
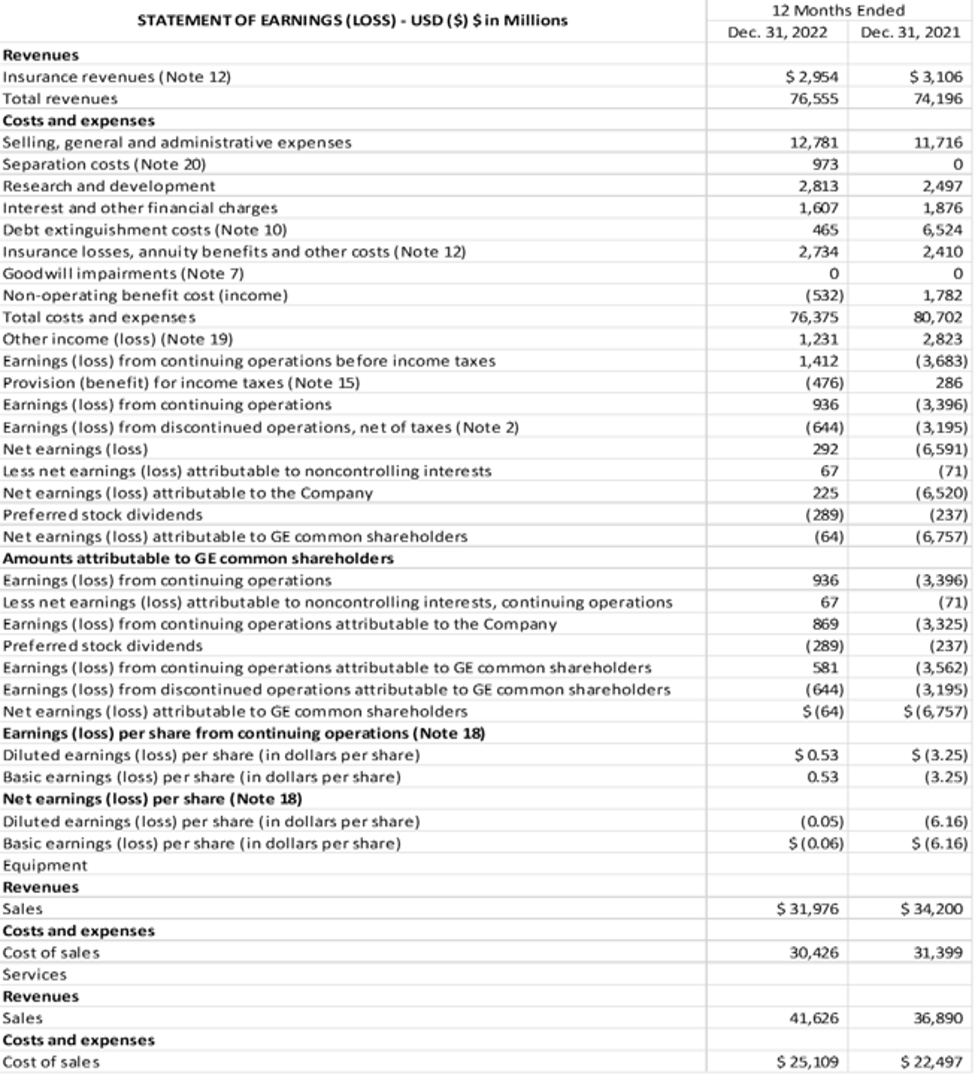
Figure 3. Table of GE’s Statement of Earnings (loss)
In addition, there was an improvement in the company’s net income (losses). This resulted in a net profit of $292 million at the end of the year 2022 after having a net loss of $6.6 billion in 2021. In 2021, the company’s net income was negative. Furthermore, profits per share (EPS) for continuing activities went from a loss of -$3.25 per share in the prior year to gaining positive ground in the current year. Continuing operations essential EPS followed a similar trajectory. From 2021 to 2022, equipment sales at GE decreased from $34.2 billion to $32 billion. The segment’s attempts to maintain profitability were reflected in a decrease in the cost of sales. From 2021 to 2022, services revenues increased from $36.9 billion to $41.6 billion. The services segment’s cost of sales increased as well, although it continued to trail revenues, indicating improved profitability. According to these numbers, GE’s finances will strengthen in 2022 compared to 2021. The firm saw a rise in its revenues and earnings from continuing operations and net earnings. However, there are still challenges, such as falling equipment sales. Financially, GE will be in better shape in 2022 thanks to the company’s efforts to reduce costs and boost profits.
Ratio
Liquidity ratio
With the information that was supplied about the liabilities, we are now able to compute the liquidity ratios for General Electric (GE) based on the data from the balance sheet:
Current Ratio
| Year 2021
Current Assets divided by Current Liabilities $66,348 million ÷ $51,953 million = 1.28 |
The year 2022
Current Assets divided by Current Liabilities $66,234 million ÷$56,947 million = 1.16 |
Quick Ratio
| Year 2021
Quick Ratio Current Assets – Inventory divided by Current Liabilities $66,348 million – $15,847 million ÷ $51,953 million = 0.97 |
The year 2022
Current Assets – Inventory divided by Current Liabilities $66,234 million – $17,403 million ÷ $56,947 million = 0.86 |
Cash Ratio
| Year 2021
Cash Ratio = Cash & Short-Term Investments divided by Current Liabilities $28,067 million ÷ $51,953 million = 0.54 |
For 2022:
Cash Ratio = Cash & Short-Term Investments divided by Current Liabilities = $24,871 million ÷ $56,947 million = 0.44 |
Liquidity ratios evaluate a company’s short-term financial flexibility. Increases in the current ratio indicate that a corporation is more liquid since its current assets are more significant than its current liabilities (Hayes, 2021). The quick ratio is a more conservative indicator of short-term liquidity since it does not consider inventory levels. Because it measures how easily current liabilities may be met with cash and short-term investments, it indicates a company’s liquidity situation (Woodruff, 2019). The projected decline in GE’s liquidity ratios relative to 2022 is slight. There was a decline from 1.28 to 1.16 in the current ratio, 0.97 to 0.86 in the quick ratio, and 0.54 to 0.44 in the cash ratio. These numbers show that GE’s liquidity will be worse in 2022 than in 2021. The company’s ability to meet its immediate debts depends on how well it manages its cash flow
Long term Solvency
Debt-to-Equity Ratio
| Year 2021
Debt to Equity Ratio = $33,672 million / $41,760 million = 0.81 |
The year 2022
Total Long-Term Debt divided by Total Equity = $30,986 million ÷ $37,714 million = 0.82 |
The ratio of a company’s debt to its equity shows what percentage of its total capitalization comes from debt as opposed to equity held by the shareholders (Kenton, 2021). Because it indicates less financial leverage and a lower degree of financial risk, a lower ratio is suggestive of a stronger long-term solvency position. This is because a lower ratio displays a lower degree of financial risk. The statistics show that General Electric’s debt-to-equity ratio was 0.82 in 2022 and 0.81 in 2021; both of these ratios suggest that the firm is in a favourable position in the market owing to the fact that it has a low amount of long-term debt in proportion to its equity.
Asset Turnover ratio
In order to get General Electric’s (GE) Asset Turnover ratio for the years 2021 and 2022, we will use the following formula:
Asset Turnover
= Net Sales divided by Average Total Assets
| Year 2021
Net Sales = $74,174 million Average Total Assets = $198,874 million + $256,211 million divided 2 = $227,542.5 million Asset Turnover for 2021 = $74,174 million divided by $227,542.5 million ≈ 0.325 |
Year 2022
Net Sales (Revenue) = $76,571 million Average Total Assets = $187,788 million + $198,874 million divided by 2 = $193,331 million Asset Turnover for 2022 = $76,571 million divided by $193,331 million ≈ 0.396 |
The Asset Turnover ratio measures an organization’s efficiency in turning its assets into revenue. A greater ratio is indicative of more efficient use of assets (Al Mheiri et al., 2021). General Electric’s Asset Turnover ratio in 2022 was around 0.396, which means that for every dollar in average total assets, the company made about $0.396 in sales. That means the business did well financially. This implies that GE’s asset utilization has grown since 2021, when the ratio was about 0.325. The rise in asset turnover in 2022 is suggestive of GE’s improved ability to transform its holdings into cash flow. This might be because of the company’s improved operational efficiency, better resource usage, or new strategic initiatives.
Profitability
We may use General Electric’s (GE) statement of profits (loss) to calculate two fundamental profitability metrics, net profit margin and gross profit margin (Amanda, 2019).
Net profit margin
The term “net profit margin” is used to describe the relationship between net income (profit) and sales prices. After taking into account all costs, it assesses how profitable the business is overall.
| Year 2021
Net profit = -$6,757 million Net profit margin for 2021 = -$6,757 million divided by $74,196 million * 100 ≈ -9.11% |
Year 2022
Net profit = Net earnings (loss) attributable to GE common shareholders Net profit = -$64 million Net profit margin for 2022 = -$64 million divided by $76,555 million * 100 ≈ -0.08% |
Gross profit Margin
The profitability of a company’s core business is shown by its gross profit margin. By dividing gross profit by overall revenues, it is computed.
| Year 2021
Gross profit = $74,196 million – $53,537 million = $20,659 million Gross profit margin for 2021 = ($20,659 million divvied by $74,196 million) * 100 ≈ 27.8% |
Year 2022
Gross profit =Total revenues – Cost of goods sold Gross profit = $76,555 million – $55,285 million = $21,270 million Gross profit margin for 2022 = ($21,270 million divided by $76,555 million) * 100 ≈ 27.8% |
As the Asset Turnover ratio measures a company’s ability to turn its assets into cash flow, a higher ratio indicates better asset utilization (Al Mheiri et al., 2021). General Electric’s Asset Turnover in 2022 was at 0.396, indicating that for every $1 in average total assets, the company generated nearly $0.396 in sales. Since 2021, when the ratio was about 0.325, this implies GE has increased the efficiency with which it uses its assets. In 2022, GE’s gross profit margin was close to 27.8 per cent. This means that for every $1 the company brought in, it kept around 27.8 cents. Regardless of this, the net profit margin ended up being a negative 0.08% after taking into account all of the costs. In 2022, the net profit margin was 0.08%, which was an improvement from -9.11% in 2021, while the gross profit margin remained unchanged at 27.8%. It signifies that General Electric was able to reduce its losses and get closer to profitability in the most recent fiscal year.
Market value
Figure 4: GE’s Shares year 2022 and 2022
| For 2021
Shares Outstanding = 0.85 billion Share Price = $111.01 Market Value in 2021 = $111.01 * 0.85B = $94.36 billion |
Year 2022
Shares Outstanding 0.85 billion Share Price = $111.01 Market Value in 2022 = $111.01 * 0.85B = $94.36 billion |
As a result of this, the valuation of the stock market for General Electric Company in 2022 and 2021 is around $94.36 billion.
The current stock price of a company is multiplied by the total number of shares that are still outstanding in order to calculate the market capitalization of that company. (Kenton, 2021). The following equation is used to forecast GE’s stock price for 2022 and 2021.In 2022, the market value is projected to be $94.36 billion, based on a share price of $111.01 and an expected 0.85 billion shares outstanding. The market value in 2021 would be $94.36 billion if there were the same number of outstanding shares and the same price per share.
DuPont Analysis
Focusing on net profit margin financial leverage and total asset turnover. we will conduct a DuPont analysis on General Electric Co’s given balance sheet for fiscal years 2021 and 2022. The results are as follows:
Net Profit Margin:
= Net Income / Sales Revenue
| Year 2021
Net Profit Margin = $3,334m divided by $74,174m = -4.49% |
Year 2022
Net Profit Margin = $869m divided by $76,57m = 1.13% |
Total Asset Turnover:
= Sales Revenue divided by Total Assets
| Year 2021
The total assets turnover of $74,174 million divided by $198,874 million = 0.37 |
Year 2022
Total Asset Turnover = $76,571millions Divided $187,788 million = 0.41 |
Financial Leverage
= Total Assets / Shareholders’ Equity
| Year 2021
Financial Leverage = $198,874 million divided by $40,310 million = 4.93 |
Year 2022
Financial Leverage = $187,788 million divided by $36,366 million = 5.16 |
It is clear from the data shown here that the net profit margin of General Electric Company increased from -4.49% in 2021 to 1.13% in 2022. Additionally, the turnover of the entire asset went from 0.37 in 2021 to 0.41 in 2022, an increase. The percentage of financial leverage was somewhat higher in 2022, coming in at 5.16, up from 4.93 the previous year.
Conclusion
GE is a global conglomerate with operations in the energy generation, renewable energy generation, transportation, healthcare, and financial sectors. The company’s capacity to develop cutting-edge technology and solutions to fulfil worldwide demands is a direct result of its dedication to sustainability and innovation. GE competes in highly competitive and evolving markets, as evidenced by the company’s industry analysis and positioning. GE is well-positioned to capitalize on the expanding market for renewable energy thanks to its wide range of power production technologies. GE has a leg up on the competition because of their expertise in wind turbine technology and renewable energy solutions.
Innovation and efficient use of fuel have helped GE’s aviation sector thrive in a highly competitive market. GE is able to maintain its position as a market leader in the healthcare sector because of its wide range of medical technology and solutions. GE Capital is able to maintain its position as a market leader by offering a wide range of financial solutions and focusing on satisfying its customers’ needs. Financial records show that General Electric had a better year in 2022 compared to 2021. The company turned a profit of $225 million in 2022 after losing $6.52 billion the year before. Profitability increased as top-line revenue, EBITDA, and NET income all went up. However, declining equipment sales provide challenges.
The company’s liquidity ratios show a decline beginning in 2021 and continuing through 2022. There will be a deterioration in liquidity in 2022 as measured by the current, quick, and cash ratios. General Electric uses liquidity management to meet its current debts. General Electric’s debt-to-equity ratio was stable in both years. The corporation is financed in part by loans and in part by stock. In the two years between 2021 and 2022, DuPont expects GE’s net profit margin and total asset turnover to grow. As the net profit margin rose, so did projections of future profits. The rising rate of total asset turnover is indicative of more effective sales output.
References
Almani, M., & Nobanee, H. (2020). Financial Statement Analysis of NIKE. SSRN. Retrieved from https://ssrn.com/abstract=3675026 or http://dx.doi.org/10.2139/ssrn.3675026
Almansoori, M. S., Almansoori, M. H., Almansoori, M. M., Almansoori, A. R., Alhammadi, A. A., Alnuaimi, S. M., & Nobanee, H. A. (2021). Financial Analysis of Adnoc. SSRN. Retrieved from https://ssrn.com/abstract=3895246 or http://dx.doi.org/10.2139/ssrn.3895246
Amanda, R. I. (2019). The Impact Of Cash Turnover, Receivable Turnover, Inventory Turnover, Current Ratio And Debt To Equity Ratio On Profitability. Journal of Research in Management, 2(2), 14-22.
Bloomberg. (n.d.). General Electric Co. Retrieved January 20, 2020, from https://www.bloomberg.com/profile/company/GE:US
Electric, G. (n.d.). GE Company Overview. Retrieved from https://www.ge.com/sites/default/files/GE_Company_Overview_December_2021.pdf
Finance, Y. (2022). General Electric Company (GE). Retrieved January 21, 2022, from https://finance.yahoo.com/quote/GE/financials?p=GE
Hayes, A. (2021). Profitability Ratios. Investopedia. Retrieved January 21, 2022, from https://www.investopedia.com/terms/p/profitabilityratios.asp
Kenton, W. (2021). Corporate Finance & Accounting. Investopedia. Retrieved January 20, 2022, from https://www.investopedia.com/terms/f/financial-statement-analysis.asp
Al Mheiri, R., Al Hosani, N., Saif, E., & Nobanee, H. (2021). Ratio Analysis of Apple. SSRN. Retrieved from https://ssrn.com/abstract=3895231 or http://dx.doi.org/10.2139/ssrn.3895231
Tikkanen, A. (2022). General Electric. Retrieved January 20, 2022, from https://www.britannica.com/topic/General-Electric
Tools, A. (2021). Financial statement analysis. Retrieved January 20, 2022, from https://www.accountingtools.com/articles/2017/5/14/financial-statement-analysis
Woodruff, J. (2019). What Are Activity Ratios? Retrieved January 21, 2022, from https://smallbusiness.chron.com/activity-ratios-57298.html
 write
write