Abstract
The application of a Balanced Scorecard (BSC) approach to managing the performance of international airlines is gaining more appeal as airlines seek to expand to more markets. The balanced scorecard of each organization varies depending on the industry, nature of the business, and size of a firm. Broadly, a balanced scorecard consists of four key components, including financial perspective, internal business perspective, customer perspective, and learning and growth perspective (Olson & Slater, 2002). Applying the BSC approach at Southwest Airlines would provide the senior management with a framework to develop a holistic strategy. One of the greatest benefits of using this approach is that it helps managers to look at the business from a broader perspective. In addition, the performance of employees in the lower levels is measured by the non-financial performance metrics. Besides measuring the performance of every employee, the approach communicates to employees how their work contributes to the overall success of Southwest Airlines. Thus, this report is based on the application of a balanced scorecard approach to the management of the performance of Southwest Airlines. The report analyzes Southwest Airlines from the four key perspectives of a balanced scorecard.
Introduction
Southwest Airlines is among the largest international airlines that reported losses for the first time in 2020 for the last 48 years. The last time the Texas-based carrier had posted losses was in 1972 when the company was just a small airline flying a few planes, mainly around the US. Prior to 2020, the airline had grown to become the third-largest international airline in terms of passengers carried. Southwest Airlines reported a loss of $3.07 billion in 2020 and attributed the loss to the Covid-19 pandemic that nearly brought the airline to a complete halt (Marketwatch.com, 2021). As a result, the airline was forced to ground the majority of its jets due to a lack of passengers. Although 2020 was a tough year for major airlines globally, Southwest airlines made the most losses compared to others in the airline industry. Based on these facts, a balanced scorecard would be an efficient strategic tool to develop a cohesive strategy to return the airline giant to profitable ways. A balanced scorecard approach is based on four comprehensive spheres of a business, including financials, operations, internal processes, and customer needs. Organizations generally fail at managing operations or implementing a strategy due to the lack of an all-inclusive management system that can align and integrate all these essential processes (Hilton & Platt, 2005). Southwest airline’s balanced scorecard is a comprehensive plan to align and integrate operations and strategy. The balanced scorecard approach can be useful to Southwest airline’s management in terms of understanding the link between processes. It would help the management to apply the systems approach rather than the less effective local optimization approach. This report focuses on the application of a balanced scorecard approach to improve the operations of Southwest Operations. Overall, applying this strategy can help the carrier to measure and communicate its strategies. Some of the key questions answered by Southwest Airline’s balanced scorecard analysis are:
Which internal processes can add more value to Southwest Airlines?
What are Southwest Airlines’ core competencies, and how can the approach add more value going forward?
Does the company require to make small or big changes to its internal processes in order to gain a sustainable competitive advantage?
How do customers perceive the airline, and what is needed to improve the brand in terms of pricing, marketing, sales, and distribution?
Is Southwest Airlines innovative enough and ready for the future, given that survival in the highly competitive airline industry is dependent on the level of innovativeness?
What do Southwest Airlines’ shareholders want? Can the decisions that the carrier is making influence the financial performance of the company?
Literature Review
Accounting professional Dr. Robert Kaplan and Theorist Dr. David Norton were the first scholars to propose the concept of a balanced scorecard in 192. The two scholars used previous performance metrics and tailored them to include non-financial information (Kaplan & Norton, 2005). According to these scholars, BSC is a strategic management performance measure used for identifying and improving internal business processes. Modern managers use this management tool to measure performance and provide feedback to their organizations. When using this tool, data collection is important in order to provide qualitative results to directors for accurate decision-making. Company directors can use information from a balanced scorecard to make informed decisions for a better future for the organization. BSC was originally designed for for-profit organizations, but it was later improved to include government agencies and non-profit organizations. Specifically, BSC measures the intellectual capital of an organization, such as knowledge, training skills, and other exclusive information that provides it with a competitive advantage over its competitors in the market (Wiredja, 2010). The balanced scorecard approach assesses the performance of a business strategy and how changes can be introduced in areas like financial goals, customers’ needs and preferences, operations management, and the organization’s learning capacity. Southwest airlines management can benefit from a BSC model by creating a sustainable competitive advantage for the carrier. It also helps in understanding the relationship among the company’s financial resources, customer preferences, internal processes, operations management, and the overall business strategy.
In another interesting study by Hendricks et al. (2012), companies implement the balanced scorecard in order to align daily operations and ensure that everyone is working in line with the existing strategies. The BSC model has five perspectives, including the financial perspective, customer perspective, internal processes perspective, and learning and growth perspective. The BSC model suggests that investment analysts who consider both financial performance and non-financial indicators tend to be more accurate in their estimates relative to those who rely on financial performance indicators. Thus, the BSC model suggests a complete examination of an organization in terms of the different perspectives. Learning and growth perspective, for example, is a performance indicator that reflects an organization’s corporate culture. This perspective include activities like employees’ awareness of the company’s latest strategies, company mission, and promotion scheme. The internal business processes perspective tells more about the company’s product and service offerings. Customer perspective, on the other hand, takes into account customers’ wishes, choices, preferences, and satisfaction as the main driver for the company to determine what services to offer. The financial perspective considers financial data, including sales, income, and expenditures, to understand the company’s financial performance. The financial metrics used may include income targets, budget variances, and financial ratios.
Hoffman & Bateson (2001) note that the customer perspective is a vital element, particularly for airlines. Although airlines have various direct and indirect customers such as retailers, carriers, and tenants, among others, the passenger segment is the most important. As such, a better understanding of passengers is inevitable for an airline that wishes to succeed. According to Lovelock & Wright (2016), customers have certain expectations about the quality of service before they purchase it. These expectations are influenced by a wide range of factors such as personal needs, past experiences, and recommendations from other users. International passengers’ behavior is influenced by factors like destination, the reason for travel, age, and nationality. Airlines with a high rate of customer satisfaction tend to protect themselves against competitive pressure, especially on the basis of pricing. The customer perspective in the BSC model from an airline’s point of view is about responding to the passengers’ experiences. The implementation of the customer perspective in the BSC approach starts with communicating the company’s vision statement (Olson & Slater, 2002). The mission statement must be comprehensive, clear, and manageable. For example, Southwest’s vision is to become the world’s most-loved airline, most flown, and most profitable in the world. After the vision is effectively communicated, the next step involves planning strategy. There is a wide range of methods that can be used to collect data about passenger experiences. Surveys and customized questionnaires are the most widely used methods of collecting data about customer experiences. Pretesting is required to check if the survey and the questionnaire meet the intended research criteria. Figure 1 shows examples of the elements of the BSC model customer perspective for an airline company.
| Objectives | Measures | Targets | Initiatives |
| Strengthen the core business | Passengers’ satisfaction surveys, questionnaires, KPIs | Achieve a 90% customer satisfaction rate | Improve the quality of service, provide prompt services, modernize airline’s facilities, increase marketing for passengers’ services, increase innovations |
| Grow passengers’ loyalty | |||
| Attract new potential passengers | |||
| Strengthen passenger relation | |||
| Identify passengers’ needs, preferences, and choices. | |||
| Exceed passengers’ expectations | |||
| Provide quality services | |||
| Provide more assistance to passengers with disabilities | |||
| Address irregularities in flights management | |||
| Improve passengers’ security and safety |
Figure 1 shows an example of the elements of the BSC model customer perspective for an airline company. Source (Olson & Slater, 2002)
Measuring customer satisfaction is crucial in the airline industry to ensure an excellent customer experience. According to David (2013), airlines measure passengers’ level of satisfaction using a wide range of methods. The data collected from surveys and customized questionnaires in the previous step needs to be stored carefully in order to be evaluated. Measuring the level of satisfaction is efficient as long the costs of doing it are controlled to ensure that the benefits achieved from the information gathered outweigh the cost. It should be understood that the selection of an effective satisfaction measuring tool requires some experience and knowledge of a research team. Top satisfaction level measurement tools applied by most airlines are key performance indicators (KPI) and market surveys. Customer surveys carried out through customized questionnaires have their merits and demerits. As Sever (2015) noted, customer satisfaction is about measuring attributes of performance and importance. It is the disparity between the expected results and the actual performance according to the expectancy theory. The passengers’ perceptions are divided into four quadrants of the importance-performance analysis model. According to Yıldız (2011), the 1st quadrant (high importance/high performance) shows the strengths of an airline, while the 2nd quadrant (high importance/low performance) consists of the key areas that require to be improved with top priority. The 3rd quadrant (low importance/low performance) represents those attributes that are of no importance to an airline, so they pose zero threat to the business. The 4th quadrant (low importance/high performance) shows attributes that are over-emphasized by the airline.
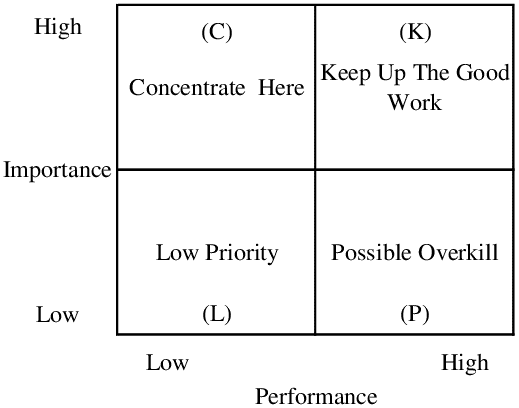
Figure 2 shows importance-performance analysis (IPA). Source (Yıldız, 2011)
Laming & Mason (2014) revealed that passengers’ perceptions of service offered by an airline differs between leisure and business travelers, as well as between frequent and non-frequent travelers. The customer perspective in the BSC plays a critical role in measuring travelers’ experiences and management’s ideas on how to meet or exceed travelers’ expectations. Airlines need to have in place a complex system of measurement that can unify the lagging indicators with those that show how the company is able to mix strategy, vision, and activities in one stream. The lost customers and the new ones are the best mirrors to reflect how well an airline delivers its services. More importantly, there is a small difference between customers’ satisfaction and disappointed customer. This small difference is comparable to the one between retaining new customers and losing them. The BSC approach not only recognizes sources but also explains necessary processes and develops measurements. It also sets out targets and supports the link between cause and effect. Every airline faces challenges related to the allocation of limited resources to different areas in need. As a result, airline companies must decide which action to undertake after considering the importance of every need. Thus, the customer perspective in the BSC model helps airlines to recognize the importance of airline uniqueness in terms of improving travelers’ experience and why they should invest in it.
Case Selection, Data, and Analysis Methods
A balanced scorecard can be used to assess the performance of Southwest Airlines by analyzing the four perspectives. For example, Southwest airline’s financial perspective can be measured through net income growth percentage, return on assets, and revenue growth percentage (Kaplan & Norton, 2005). The customer perspective can be measured through customer satisfaction and customer experience. Internal business perspective can be measured through the key processes and activities required for the airline to succeed at providing the expected customer value. Learning and growth perspective can be measured through the airline’s learning capacity and core competencies. Overall, the BSC combines the lead measures and lag measures to evaluate an organization’s performance. The lead indicators provide guidance on the current decisions, whereas lag indicators provide guidance on final results. The whole idea of using the BSC at Southwest Airlines is to apply the lead indicators to motivate, evaluate, and communicate with the various stakeholders with the expectation that the current actions will lead to significant improvements in the airline’s key lag measures in the future (Cote, 2018). The four perspectives of a balanced scorecard are related and can be used to form a cohesive framework of how Southwest airline’s management can improve the company’s long-term objectives with both non-financial and financial measures. Combined, the four key areas can help the management to make measurable and accurate decisions in a manner that creates value. In addition, analyzing each key area separately allows the management to draw conclusions from each of the four perspectives. More importantly, analyzing information from all four perspectives is better because it reduces information overload by reducing the number of measures used.
After a careful analysis of Southwest Airlines in terms of mission, goals, objectives, and purpose, it can be observed that the company values the triple bottom line framework that consists of three pillars: financial, environmental, and social (Cote, 2018). Therefore, Southwest airline’s goals and objectives fall under the three pillars of the triple bottom line model. Broadly, the goals of the three pillars of triple bottom line model can be categorized into people, planet, and profit. Southwest airlines, however, categorizes the 3 key pillars as performance, people, and the planet as indicated below;
Performance
- To maintain consistent profitability.
- To grow the net income.
- To increase shareholders’ return on investment.
People
- To create a safe and secure working environment for the employees to enable them to deliver a great customer experience.
- To encourage creativity and innovation amongst employees.
Planet
- To operate in an efficient manner by minimizing the negative impacts on the environment.
- To be sustainable in terms of resource utilization, conservation, and mitigation against environmental impacts.
Southwest Airlines Summarized Balanced Score Card
| Financial Perspective | Internal Business Processes Perspective |
| Net income growth:131.78% increase | Fleet increase: 814 aircraft |
| Sales revenue growth: 74.51% increase | Sustainable operating efficiency: 14% more fuel efficient and more than 40% quitter aircrafts than the old-generation aircraft being replaced |
| Total assets growth: 4.36% increase | |
| Customer Perspective | Learning and Growth Perspective |
| Daily reservations: 60,000 | New processes: 4,100 flights per day |
| Customer satisfaction level/score: 79% | Flight completion record: 96% |
Source: Southwest Airlines 2021 annual report
Analysis
Financial Perspective Analysis
Net income growth: Southwest Airlines’ net income growth was 131.78% in 2021 compared to -233.65% in 2020 (Marketwatch.com, 2021). The company’s net income grew from $3.07 billion loss in 2020 to $977M profit in 2021
Revenue growth: Southwest Airlines recorded a 74.51% sales growth in 2021 relative to -59.66% sales growth in 2020 (Marketwatch.com, 2021). The company’s sales revenue grew from $9.05 billion in 2020 to $15.79 billion in 2021.
Total assets growth: Southwest Airlines recorded a 4.36% growth in total assets compared to 35.39% in 2020 (Marketwatch.com, 2021). The company’s total assets grew to 38.17 billion in 2021 compared to 36.57 billion in 2020.
Internal Business Processes Perspective Analysis
Southwest Airlines’ fleet has increased from 737 in 2020 to 814 in 2021. The company purchased 814 new aircraft to respond to the 28 retirements. The increase in aircraft is expected to meet the growing demand for Southwest Airlines services as well as the company’s growth plans. According to the annual report (2021), the airline has the required cash, airports needed, and the necessary airplane order book.
Besides increasing the number of aircraft, Southwest Airlines enhanced its sustainable operating efficiency. For example, the company modernized its fleet by acquiring new models of Boing such as 737-7 and 737-7 that are 14% more efficient in terms of fuel consumption and quieter than the old-generation aircraft being replaced (Southwest Annual Report, 2021). Southwest Airlines further plans to acquire sufficient quantities of economically sustainable aviation fuel to reduce its carbon footprint.
Customer Perspective Analysis
Southwest Airlines’ daily reservations stood at 60,000 on average compared to 57,000 in 2020 (Southwest Annual Report, 2021). It means that the company’s customer service personnel book an average of 420,000 reservations on a weekly basis and an average of 1.68M million reservations per month.
In terms of customer satisfaction, Southwest Airlines was ranked 79% by the American Consumer Satisfaction Index (ACSI). According to ZHANG (2019), Southwest Airline is the largest airline worldwide in terms of customer satisfaction scores. Prior to the Covid-19 pandemic, the airline was among the top ten airlines making the highest revenues. Comparing its performance with other low-cost carriers in the airline industry, Southwest was leading with a revenue of $22.43 billion. Ryanair was the second most profitable low-cost carrier after Southwest, generating a revenue of $9.43 billion in 2019.
Learning and Growth Perspective Analysis
Southwest Airlines’ daily flights grew to an average of 4,100 flights per day in 2021 compared to 4,900 in 2020. The company further recorded a flight completion record of 96%, which was a significant improvement from 2020.
Comparing Southwest Airline’s Key Financials with its Competitors
Comparing Southwest Airlines’ 2021 financial performance with other low-cost carriers around the world, it can be observed that the company performed better than all its main competitors. From a current ratio point of view, Southwest Airlines performed better than American Airlines, Easy Jet, and Delta Airlines (Morningstar.com, 2021). The current ratio measures a company’s ability to pay off its outstanding short-term debts as and when they become due. A current ratio of between 1.5 and 3.0 is considered healthy in the airline industry, which shows that Southwest is financially healthy and able to pay its short-term debts on time (Dao, 2016). The quick ratio, on the other hand, shows a company’s ability to pay off its outstanding short-term debts without having to sell the inventory. Comparing Southwest’s quick ratio with its competitors, it can be seen that it has a relatively higher quick ratio, which demonstrates its ability to pay short-term debts without having to sell inventory first.
The financial leverage ratio measures a firm’s ability to meet its financial obligations. Too much debt is considered dangerous to both the company and investors. However, if the company’s operations generate sufficient returns compared to interest on loans, then the debt is useful for growth. Unchecked debt levels lead to low credit rating, which affects a company’s ability to get future debts (Dao, 2016). The lower the financial leverage, the lower the default risk. Comparing Southwest’s financial leverage ratio, it can be observed that Southwest Airlines is doing well in terms of managing its debt compared to its competitors in the low-cost carrier market (Morningstar.com, 2021). The debt-to-equity ratio is another key financial metric that measures a company’s total debt relative to the total amount invested by the shareholders and the earnings retained. Although it varies from one industry to another, a debt-to-equity ratio of below 2.5 is considered ideal. Thus, considering Southwest’s debt-to-equity ratio relative to its competitors, it can be observed that Southwest airline has a better debt-to-equity ratio compared to its competitors.
Net profit margin is another important key financial metric that measures how much profit a company generates as a percentage of sales revenue. Simply put, the net profit margin shows the proportion of each dollar collected as sales are translated into profits (Dao, 2016). Taking into consideration Southwest’s net profit margin relative to its competitors, it can be observed that Southwest generated a higher net profit margin compared to other low-cost carriers in the market. From the calculations, Southwest’s net profit margin in 2021 stood at 0.06 compared to -0.08 for American Airlines, -0.59 for Easy Jet PLC, and 0.01 for Delta Airlines (Morningstar.com, 2021). Return on equity measures a company’s profitability and the level of efficiency with which it generates profits. The ROE measures a company’s performance by dividing its net income by the shareholders’ equity. A return on equity of between 15% and 30% is considered ideal based on the industry. Taking into consideration Southwest’s ROE, it can be observed that all low-cost carriers are operating below the recommended return on equity. A low return on equity means that all these carriers are earning relatively low earnings relative to their shareholders’ equity.
The return on assets is a performance metric that shows how profitable a business is relative to its total assets. It shows how efficiently a company utilizes its assets to make profits. It is calculated by dividing the net income of a company by its total assets (Dao, 2016). Comparing the four airlines, it can be seen that Southwest is utilizing its assets better than its competitors. For example, Southwest’s return on assets stood at 0.1 compared to the American airlines’ ROA of -0.03, Easy Jet ROA of -0.09, and Delta Airlines ROA of 0.00 (Morningstar.com, 2021). Generally, a return on assets of between 5% and 20% is considered ideal based on the industry, so Southwest’s ROA can be considered good. The interest coverage ratio indicates how easily a firm can pay off interest accrued on its outstanding debts. The ratio is computed by dividing a firm’s earnings operating income by interest expense for a given period. Taking a look at Southwest’s interest coverage ratio relative to its competitors, it can be observed that Southwest Airlines is in a better position to pay off the interest on its outstanding debts compared to its competitors. Earnings per share, on the other hand, show the amount of money a company generates for each common stock (Dao, 2016). It is the common metric used to estimate the corporate value of a firm. A company’s EPS is computed by dividing the net profit by the number of outstanding common shares held by shareholders. Generally, a higher EPS shows greater value since investors will ordinarily pay more for a company’s stocks when they know that it has a higher net profit relative to its stock price. Looking at Southwest’s earnings per share (EPS) relative to its competitors, it can be observed that Southwest Airlines has a better EPS compared to the rest. Conclusively, Southwest Airlines has a higher corporate value relative to other low-cost carriers in the market.
Discussion
Based on the above findings, minimizing costs, revenue, and an extremely competitive low-cost environment are the main areas that Southwest Airlines needs to focus on to remain successful. The analysis of the four perspectives of a balanced scorecard points out that the management of Southwest management should consider operational improvement opportunities available within the industry to improve performance. For example, improving the satisfaction score in the customer perspective from the current 79% would enable the company to attract new potential travelers (Southwest Annual Report, 2021). From an internal business processes perspective, Southwest Airlines should work towards improving sustainable operations efficiency by acquiring sufficient quantities of economically sustainable aviation fuel to reduce its carbon footprint. In addition, the company should further increase its fleet of aircraft from the current 814 to 1,000 aircraft to meet the growing demand and expand to emerging economies where it does not fly travelers. Tapping into high-growth markets would help the company to increase its sales revenues, profitability, and size in the market. From a financial perspective, Southwest has the opportunity to increase its market share by taking advantage of its powerful brand in the market. Increasing marketing activities, for example, would help the company to gain more market share, particularly from the low-cost markets. From a learning and growth perspective, Southwest Airlines has unlimited opportunities of increasing the daily flights from the current 4,100 to more than 5,000 if it expands to unfamiliar high-growth territories (Southwest Annual Report, 2021). Increasing the daily flights would help the company to grow in terms of size, personnel, and reputation. Further to this, increasing the daily flights would also increase the company’s sales revenues and profitability, thus having a more competitive advantage over other low-cost carriers in the market. Increasing flight completion record is another improvement area of learning and growth perspective that can help Southwest Airlines to further improve its efficiency. For example, increasing the flight completion record to 98% would help the company to further build on its reputation in the market. During the Covid-19 period, Southwest Airlines faced numerous flight cancellations, which had a negative impact on the carrier’s reputation. However, the situation improved in 2021 after the recovery from the impacts of Covid-19. Working on improving the flight completion record would not only build the company’s reputation but also enhance its ability to generate more sales and greater profits. Thus, the solution to the prevailing problems lies in the implementation of the initiatives in each of the four perspectives of the balanced scorecard. Besides implementing the balanced score card, Southwest Airlines’ management should consider executing the goals as outlined in the bottom line framework, including performance, people, and the planet.
Advantages and Disadvantages of a Balanced Score Card
Overall, a balanced scorecard approach helps a company to focus on measuring its performance in more than one key area. The balanced scorecard takes into consideration areas of a business that easily get overlooked and which have a significant impact on the overall performance of a business. For example, customer satisfaction and internal business processes may sound insignificant, but they have a huge impact on the overall performance of a business. One of the main advantages of a balanced scorecard is that it brings structure to a company’s strategy (Dreveton, 2013). Different organizational departments may have their own metrics for assessing performance. However, with a balanced scorecard, departments can still customize their performance measurement, but the measurement falls within a standard structure that is understood across the entire organization. A balanced scorecard provides a level playing field for everyone within the organization to measure performance and success. Another advantage of a balanced scorecard is that it makes communication across team members as well as across departments easier (Dreveton, 2013). Having aligned the performance measurement system, it means that everyone in the organization speaks the same language, which makes it extremely easy to communicate the strategy and progress across the organization.
BSC is also hailed for its ability to facilitate better alignment. With a balanced scorecard, employees can easily link their goals and objectives at different levels of the organization. Using a balanced scorecard gets everyone synced up under a single structure which allows individuals to have a bigger picture of the organizational initiatives (Dreveton, 2013). As a result, organizational projects have a much shorter turnaround time and greater results. A balanced scorecard connects employees to the organizational goals at the individual level. It helps employees to keep focused towards the attainment of goals. As a result, employees have some sense of pride because they know there is a greater purpose behind the organizational goals and objectives that they are aiming to achieve. A BSC further helps employees to find purpose within their organization, which keeps them focused on their work.
Although there are many benefits of implementing a balanced scorecard in an organization, it has some drawbacks. To start with, a balanced scorecard must be tailored to every organization applying this approach. Customization can take a lot of time since the system cannot be copied from another organization due to the unique needs of every company (Malina et al., 2011). In addition, a balanced scorecard system needs to be implemented from the bottom level of an organization going up to the leadership to be effective. This means that the management must get the support of the junior level employees prior to implementing a balanced scorecard which can take a lot of time and convincing. Further to convincing everyone to support a balanced scorecard system, training is required in order to get everyone on board. Moreover, the framework can get a little complicated since it takes time and effort to understand (Malina et al., 2011). There are many case studies to study about the implementation of a balanced scorecard, but it is easy to get confused since every case is unique to every organization. Furthermore, a balanced scorecard requires a lot of data since team members and managers are required to report the progress on a regular basis. Involving a lot of data makes it quite tedious and may stand in the way of meeting organizational objectives.
Conclusion
In conclusion, a balanced scorecard is an efficient strategic tool that helps organizations to formulate a comprehensive strategy. BSC combines the lead measures and lag measures to evaluate an organization’s performance. The lead indicators provide guidance on the current decisions, whereas lag indicators provide guidance on final results. The whole idea of using the BSC at Southwest Airlines is to apply the lead indicators to motivate, evaluate, and communicate with the various stakeholders with the expectation that the current actions will lead to significant improvements in the airline’s key lag measures in the future. The four perspectives of a balanced scorecard are related and can be used to form a cohesive framework of how Southwest airline’s management can improve the company’s long-term objectives with both non-financial and financial measures. Combined, the four key areas can help the management to make measurable and accurate decisions in a manner that creates value. The management of Southwest can use the balanced scorecard to create a sustainable competitive advantage for the airline by having a better understanding of the relationship between the four key areas of the business. An awareness of the company’s financial resources, customer preferences, internal processes, and operations management can give Southwest Airlines a more competitive advantage over other low-cost carriers like American Airlines, Delta Airlines, and Easy Jet. Thus, the application of a balanced scorecard at Southwest Airlines is a comprehensive strategy that aligns and integrates operations and strategy to achieve greater results.
References
Cote, R. (2018). Leadership Analysis: Southwest Airlines-Herb Kelleher, CEO. Journal of Leadership, Accountability & Ethics, 15(1).
Dao, P. (2016). Performance evaluation based on financial ratios. Case: Finnair and Scandinavian Airlines.
David Mc A, B. (2013). Service quality and customer satisfaction in the airline industry: A comparison between legacy airlines and low-cost airlines. American Journal of Tourism Research, 2(1), 67-77.
Dreveton, B. (2013). The advantages of the balanced scorecard in the public sector: beyond performance measurement. Public Money & Management, 33(2), 131-136.
Hendricks, K., Hora, M., Menor, L., & Wiedman, C. (2012). Adoption of the balanced scorecard: A contingency variables analysis. Canadian Journal of Administrative Sciences/Revue Canadienne des Sciences de l’Administration, 29(2), 124-138.
Hilton, R. W., & Platt, D. E. (2005). Managerial accounting: creating value in a dynamic business environment (p. 864). New York: McGraw-Hill/Irwin.
Hoffman, K. D., & Bateson, J. E. (2001). Essentials of Services Marketing: Concepts. Strategies, and Cases, Thomson South Western Publications.
Kaplan, R. S., & Norton, D. P. (2005). The balanced scorecard: measures that drive performance. Harvard business review, 83(7), 172.
Laming, C., & Mason, K. (2014). Customer experience—an analysis of the concept and its performance in airline brands. Research in Transportation Business & Management, 10, 15-25.
Lovelock, C. H., & Wright, L. (2016). Principles of service marketing and management. Prentice Hall.
Malina, M. A., Nørreklit, H. S., & Selto, F. H. (2011). Lessons learned: advantages and disadvantages of mixed method research. Qualitative Research in Accounting & Management.
Marketwatch.com (2021). Southwest Airlines Co. financials. Retrieved from https://www.marketwatch.com/investing/stock/luv/financials
Morningstar.com (2021). American Airlines Group Inc. – Stock Financials AAL. Retrieved from https://www.morningstar.com/stocks/xnas/aal/financials
Morningstar.com (2021). Delta Air Lines Inc. – Stock Financials DA. Retrieved from https://www.morningstar.com/stocks/xnys/dal/financials
Morningstar.com (2021). Easy Jet PLC – Stock Financials EJTT. Retrieved from https://www.morningstar.com/stocks/pinx/ejttf/financials
Morningstar.com (2021). Southwest Airlines Co – Stock Financials LUV. Retrieved from https://www.morningstar.com/stocks/xnys/luv/financials
Oliver, R. L. (2014). Satisfaction: A behavioral perspective on the consumer: A behavioral perspective on the consumer. Routledge.
Olson, E. M., & Slater, S. F. (2002). The balanced scorecard, competitive strategy, and performance. Business Horizons, 45(3), 11-16.
Sever, I. (2015). Importance-performance analysis: A valid management tool?Tourism management, 48, 43-53.
Southwest Annual Report (2021). Southwest Airlines Co. 2021 annual report to shareholders. Accessed from https://www.Southwestairlinesinvestorrelations.com/~/media/Files/S/Southwest-IR/LUV_2021_Annual%20Report.pdf
Wiredja, D. (2010, June). A holistic approach to improve balance scorecard in measuring performance of listed companies. In 2nd Parahyangan International Accounting and Business Conference (pp. 681-694).
Yıldız, S. M. (2011). An importance-performance analysis of fitness center service quality: Empirical results from fitness centers in Turkey.
ZHANG, X. Y. P. T. Z. (2019). A comparative study on several national customer satisfaction indices (CSI). Aetna School of Management, Shanghai Jiao Tong University, Shanghai, PR China, p2.
Appendices
| Key Financials in 2021 | Southwest Airlines | American Airlines | Easy Jet PLC | Delta Airlines |
| Current Ratio | 1.97 | 1.19 | 1.56 | 0.76 |
| Quick Ratio | 1.84 | 1.10 | 1.39 | 0.65 |
| Financial leverage | 3.49 | 13.56 | 3.70 | 18.64 |
| Debt/Equity | 1.11 | 7.11 | 1.50 | 8.28 |
| Net margin | 0.06 | -0.08 | -0.59 | 0.01 |
| Return on Equity | 0.03 | -0.36 | -0.38 | 0.10 |
| Return on Assets | 0.10 | -0.03 | -0.09 | 0.00 |
| Interest coverage | 4.07 | -0.62 | -7.78 | 1.31 |
| EPS | 1.61 | -6.10 | -1.59 | 0.44 |
Table 1 shows key financial performance indicators of Southwest’s main competitors. Source (Morningstar.com, 2021)
 write
write