Introduction
Amazon is a unique enterprise selling multiple lines of goods involving toys, electronics, housewares, movies, music, and books. The firm has considered the relevance of private investors to sustain its growth. Recently, it has been subjective to acquisition and aggressive growth strategies to allow it to remain at the top of the game. The available personalization tools recommend purchasing the products based on the customers’ purchasing history. The financial statistics of the enterprise demonstrate an organization that has more potential both in the short and long term (Amazon, 2023). Therefore, the paper is set to conduct a financial analysis of Amazon by focusing on the Debt-to-equity ratio, current ratio, quick ratio, net profit margin, and return on equity ratio.
Balance sheet
The total assets have continually increased over the years, with 2020 recording 321195000, 2021 (420549000) and 2022 (462675000). The increase is directly reflected in the non-current and current assets that have also increased. Just like the total assets, the total liabilities have also intensified gradually. The figures recorded for the total liabilities are 2020 (227791000), 2021 (282304000) and 2022 (316632000). The increase in the figures is by over 40,000,000, implying that the organization is continually considering investments using debts. Besides, the total equity has also intensified from 2020 (93404000), 2021 (138245000), and 2022 (146043000) (Amazon, 2023). However, the increase in the total equity is declining when the three years are compared.
Income statement
The total revenue has increased from 386064000 in 2022, 469822000 in 2021, and 513983000 in 2022. The cost of generating the revenue over the years has been 334564000 in 2020, 446343000 in 2021, and 461648000 in 2022. The gross profit has increased with small margins, with 2020 recording 51400000, 66315000 in 2021, and 6764000 in 2022. The net income has significantly fluctuated, with the organization demonstrating a profit in 2020 and 2021 and a loss in 2022. The figures recorded are 2020 (221331000), 2022 (33364000) and 2022 (-2722000). Nevertheless, the total expenses have continually increased from 2020 (363165000), 2021 (444943000), and 2022 (501735000).
Cash flow statement
The operating cash flow has decreased over the years. The figures recorded are 66064000 for 2020, 46327000 for 2021, and 46752000 for 2022. Besides, just like the operating cash flow, the free cash flow has also decreased over the years, where 202o recorded 25924000, -14726000 in 2021, and -1689300 in 2022 (Amazon, 2023). On the other hand, the cash position of the enterprise has fluctuated, as demonstrated by the figures that are 423777000 in 2020, 36477000 in 2021, and 54253000 in 2022.
Financial Analysis
Debt Equity Ratio
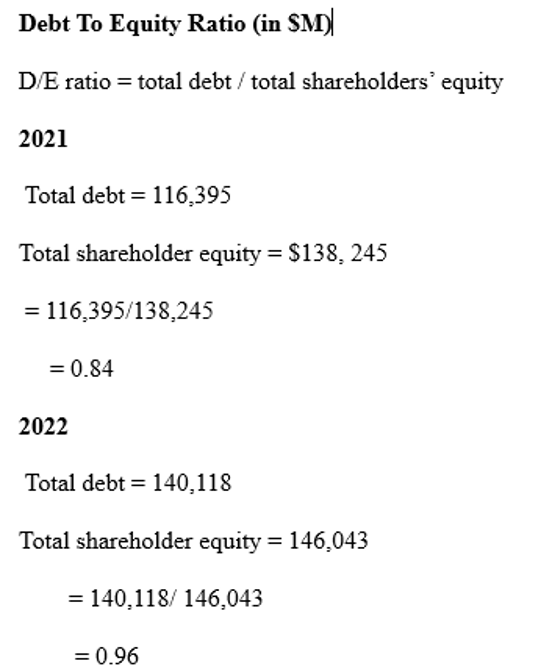
Companies use the D/ E ratio to evaluate financial leverage. It also helps the company determine whether there is enough shareholder equity to pay off the debts in case of a profit decrease. Amazon’s D/E ratio for 2021 and 2022 is 0.84 and 0.96, respectively. A debt-to-equity ratio is likely good if it is below 2.0. Thus, Amazon’s equity ratio is good and implies that Amazon’s shareholder equity is bigger and does not need any money to finance its operations and business for growth.
Current Ratio
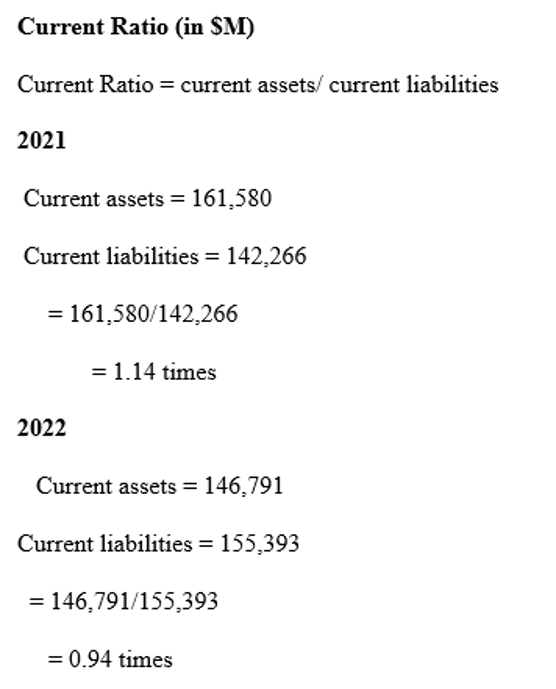
The current ratio evaluates the company’s current assets to its current liabilities. Amazon’s current ratio in 2021 and 2022 was 1.14 and 0.94, respectively. The current ratio is good when between 1.2 and 2, implying that an organization has two times more current assets than the liabilities to cover its debt. In 2021, the company had a current ratio greater than one, which implies that it had all the financial resources to remain solvent in a shorter period compared to 2022 when its ratio was less than one. In 2022, amazon needed more capital to satisfy its short-term obligations in case they were all due simultaneously.
Quick ratio ($M)
Quick ratio = Quick Assets/ Current liabilities
2021
Quick Assets = 161,580 – 32,640
=128,940
Current liabilities = 142,266
= 128,940/142,266
= 0.91
2022
Quick assets = current assets – inventories
= 146,791 – 34,405
= 112,386
Current liabilities = 155,393
112,386/ 155,393
= 0.72
Quick ratio evaluates the capacity of a company to pay the existing current liabilities without the need to obtain additional finances or sell inventories. The quick ratio for Amazon as of 2021 and 2022 is 0.91 and 0.72, respectively. Amazon’s quick ratio for 2021 and 2022 is less than one, implying that the organization needs more liquid assets to satisfy its short-term obligations.
ROE ($M)
Roe = Net income/ Shareholders Equity
2021
Net income = 33,364
Shareholder equity= 420,549 – 282,304
= 138,245
= 33,364/138,245
= 0.24 *100
= 24%
2022
Net income = (2722)
Shareholder equity = 462,675 – 316,632
= 146,043
= (2,722)/ 146,043
= 0.0186 *100
= -1.86%
ROE gauges the company’s profitability and its efficiency in generating profits. A higher ROE shows the ability of a company to generate income and growth from equity financing. The ROE for Amazon in 2021 was 24 %, while the ROE for 2022 was -1.86%. In 2021, amazon had a good ROE, implying that it was in a better position to convert its equity finances into profits than in 2022. In 2022, amazon was not profitable and needed to use its resources efficiently, leading to a lower ROE. Thus, amazon was good for investment in 2021.
Net Profit Margin ($M)
Net profit margin = (net income/ Revenue) *100
2021
Net income = 33,364
Revenue = 469,822
= 33,364/ 469,822
= 0.071 *100
= 7.10%
2022
Net income = (2722)
Revenue = 513,983
= (2722)/ 513,983
= 0.0053 *100
= -0.53%
Net profit margin determines how much a net income or profit can be generated as a revenue percentage. It helps the investors determine whether an organization generates enough profit from its sales and has controlled overhead and operating costs. The net profit margin for Amazon in 2021 and 2022 was 7.10% and -0.53%. In 2021, amazon had a good profit margin of 7.10%, implying that the company was very efficient at converting its sales into actual profit compared to 2022. In 2022, amazon had poor pricing strategies, ineffective structure cost, or inefficient management that resulted in a very low net profit margin of -0.53%.
Conclusion
In summary, carrying out the financial analysis of Amazon by focusing on the Debt-to-equity ratio, current ratio, quick ratio, net profit margin, and return on equity ratio is essential in determining if Amazon Inc. is worth investing in. Amazon’s equity ratio is good, implying that Amazon’s shareholder does not need any money to finance its operations. Amazon needs more capital to satisfy its short-term obligations in case they become due simultaneously. The low quick ratio demonstrates that the organization needs more liquid assets to satisfy its short-term obligations. The net profit margin and ROE have declined, showing how the organization is giving less returns on the invested equity. Investors should not consider investing in the enterprise as it is too risky.
References
Amazon. (2023, October 7). Amazon.com, inc. (AMZN) balance sheet. Yahoo! Finance. https://finance.yahoo.com/quote/AMZN/balance-sheet?p=AMZN
Amazon. (2023, October 7). Amazon.com, inc. (AMZN) cash flow. Yahoo! Finance. https://finance.yahoo.com/quote/AMZN/cash-flow?p=AMZN
Amazon. (2023, October 7). Amazon.com, inc. (AMZN) Income Statement. Yahoo! Finance. https://finance.yahoo.com/quote/AMZN/financials?p=AMZN
Amazon. (2023, October 7). Amazon.com, inc. (AMZN). https://www.amazon.com/s?k=a+mazon+com&adgrpid=127260490003&hvadid=585479351039&hvdev=c&hvlocphy=9070324&hvnetw=g&hvqmt=b&hvrand=10599551593594400203&hvtargid=kwd-321362582074&hydadcr=27983_14525522&tag=hydglogoo-20&ref=pd_sl_6g4xlojujf_b
 write
write