Introduction
The current data relates to an organization involving gender, age, department, position, tenure, commitment, and job satisfaction as the main variables. There is a need for regression analysis of the data to understand its implications to management, more so the application in the workplace settings (Nguyen, 2023). Therefore, the paper is set to carry out simple and multiple regression using gender, age, department, position, and tenure as the independent variables and commitment and job satisfaction as the dependent variables to understand their implication for the management of the enterprise.
Simple Regression Analysis
The variables chosen for the simple regression are employee position and general job satisfaction. The independent variable is employee position, and the dependent variable is the general satisfaction of the employees. The two variables are chosen for consideration since it is perceived that in typical work settings, employees tend to have job satisfaction based on the positions they hold at the workplace. Intensified job satisfaction leads to increased employee engagement, high employee retention, and increased productivity.
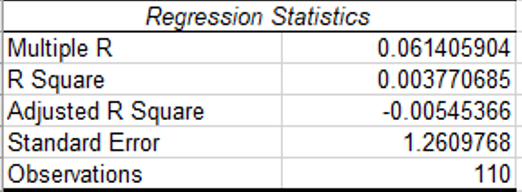
R Square
R Square of 0.004 implies that the regression model accounts for nearly 0.4% of the variance of the dependent variable. High R Squared values usually represent minor differences between the fitted and observed data. In this case, the 0.4% value is relatively low, showing that the independent variable(position) does not explain the dependent variable (job satisfaction) variation better. Thus, the independent variable(position) does not account for much of the realized mean.
Adjusted R Square
The Adjusted R Square is crucial in comparing the regression models with their particular independent variables that differ. The model had an adjusted R Square of -0.005, showing that the model is worse relative to the typical outcome variable average. The negative values imply that the model does not have a predictive value, thus the need to utilize different models.
Standard Error
The standard error is typically used to show the size of residuals and usually indicates how wrong the regression model can be on average. From the above Excel output, the regression model had a standard error of 1.261, which is relatively low and demonstrates the regular residual sizes by showing the defects in the entire regression model. The low value shows a smaller distance between the fitted values and data points (Frost, 2023). However, the value is about 1, indicating that the value that has been estimated is not the particular actual value.
ANOVA Table
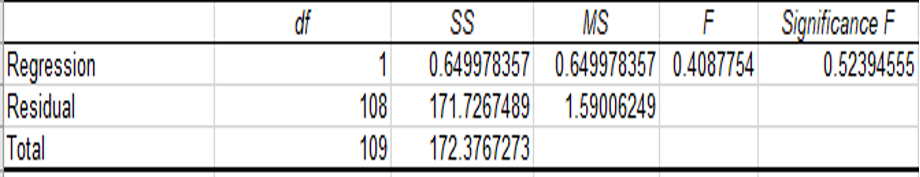
The significance F is the essential value in the ANOVA table as it represents the p-value of the overall importance of the F-test. A p-value> 0.05 indicates that the regression model is statistically insignificant, while a P-value < 0.05 suggests that the model is statistically significant. From the above output, the P-value for the regression model is 0.524 and is above 0.05, indicating that it is statistically insignificant. It illustrates that if the null hypothesis is true and the assumptions involved are valid, then there is a likelihood of realizing outcomes like the ones the model has observed. Thus, there is no significant difference between the independent variable (position) and the dependent variable (job satisfaction).
Coefficients Table
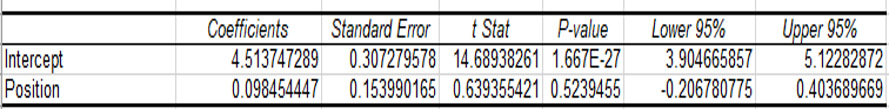
The table presents the parameter estimates related to the independent variable and the usually meaningless constant. The coefficient for a position that is the indent variable is 0.098. The positive nature of the value indicates that as the employees’ position increases, their general job satisfaction is also growing. For each unit increase in position, general job satisfaction is increasing average by 0.098. However, the p-value for the independent variable is 0.5 and is more significant than 0.05, implying that it is statistically insignificant. Thus, the general employee satisfaction is negligible in its determination by the coefficients of the position variable.
Implications For Management and Workplace Applications
The position of the employees accounts for about 0.4% variance in the job satisfaction of the employees. The variance is generally low, implying that job position does not substantially affect general job satisfaction in the work settings. The ANOVA outcome shows statistical insignificance demonstrating no significant difference between the position of the employees and their job satisfaction. The insignificance makes the null hypothesis that organizational positions contribute to job satisfaction. Moreover, an increase of 0.098 in job satisfaction when the position increases by one unit is meager and cannot be beneficial to an enterprise. Thus, in managing organizations, the job positions of the employees will only sometimes imply that the employees are satisfied. Organizations must focus on other factors that contribute to the employees’ job satisfaction. In the workplace, business enterprises should hire employees who appeal to their business objectives and functions. Focusing on the other factors will increase the operation efficiency, optimizing the commercial activities of the enterprise (Ozyasar, 2019). They will eliminate the typical guesswork allowing them to have well-crafted predictions.
Multiple Regression Analysis
The variables chosen for multiple regression are department, age, gender, position, tenure, and employee commitment. The independent variables are department, age, gender, position, and tenure, while the dependent variable is employee commitment. Employee commitment is chosen as the dependent variable due to its capacity to be influenced by other factors. Employee commitment is essential in realizing better outcomes in the work setting. It intensifies the employees’ productivity and general morale to satisfy the typical daily tasks.
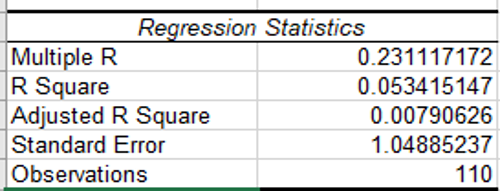
R Square
R Square of 0.053 implies that the model accounts for nearly 5.3% of the variance of the dependent variables. The relatively low value shows that the independent variables (age, gender, department, tenure, and position) do not effectively explain the variation relating to the dependent variable (employee commitment). The independent variables are not accounting for much of the realized mean. The positive value demonstrates that the existing relationship is positive between the dependent variable and the independent variables.
Adjusted R Square
The model has an adjusted R Square of 0.008, portraying that the model fits well due to the variability of the independent variables. The Adjusted R Square is crucial in offering a realistic estimate of how the model is generalizing the data allowing for accountability for the degrees of freedom of the entire model. The positive value implies that the model has a predictive value, thus no need to utilize different models.
Standard Error
The model had a standard error of 1.049, which is relatively low and demonstrates the smaller average distance between the values observed and the regression line. However, just like the standard error for simple regression, the value is about 1, indicating that the value that has been estimated is not the particular actual value. The regression model is appropriate in showing that the observation is near the line of good fit.
ANOVA Table
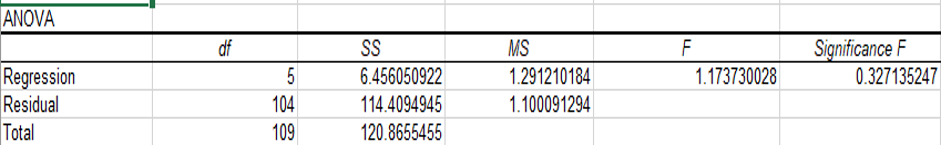
The P value for the model is 0.327 and is above 0.05, indicating that it is statistically insignificant at any potential level. It illustrates that if the null hypothesis is true, there is a 30% likelihood of realizing the observed outcomes (Frost, 2023). There is no significant difference between the independent and the dependent variables.
Coefficients Table
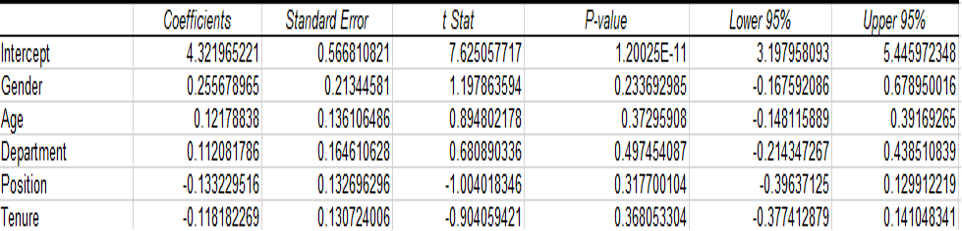
The table above visualizes the parameter estimates related to the independent variables and the intercept. The coefficient for position, tenure, department, age, and gender-independent variables are -0.133, -0.118, 0.112, 0.122, and 0.256, respectively. The positive nature of the values of department, age, and gender indicates that as the department, age, and gender of the employees are increasing, their general commitment is also growing. For each unit increase in department, age, and gender, the organizational commitment increases by 0.112, 0.122, and 0.256, respectively. Besides, the negative values of position and tenure illustrate that as position and tenure increase in the organization, organizational commitment decreases. For each unit’s rise in position and tenure, the organizational commitment is reduced by -0.133 and -0.118. However, the p- values for the independent variables are greater than 0.05, implying that they are statistically insignificant. Thus, employee commitment is insignificant in its determination by the coefficients of the independent variables.
Implications For Management and Workplace Applications
The position, tenure, department, age, and gender of the employees account for about 5.3% variance of the employees’ organizational commitment. The variance is relatively high, implying that position, tenure, department, age, and gender substantially affect the general organizational commitment in the work settings. The ANOVA outcome shows statistical insignificance demonstrating that there is no significant difference between the position, tenure, department, age, and gender of the employees and their organizational commitment. The insignificance makes the null hypothesis that organizational commitment is contributed to by position, tenure, department, age, and gender to be true. With a unit increase in department, age, and gender, the organizational commitment increased by 0.112, 0.122, and 0.256, respectively, implying that the three factors contribute to the organizational commitment. Besides, with a unit increase in position and tenure, the organizational commitment decreases by -0.133 and -0.118, demonstrating that the two factors contribute negatively to the employees’ organizational commitment. Thus, in the workplace settings, the human resource team should focus on gender, age, and department to positively increase the commitment of the employees. However, the insignificance of the ANOVA and the independent coefficient values implies that the capability of the position, tenure, department, age, and gender to contribute to organizational commitment is not statistically significant (Abeyrathna & Priyadarshana, 2019). Thus, organizations should focus on other critical aspects in the organizational settings to enhance the employees’ organizational commitment. Concentrating on position, tenure, department, age, and gender as the focus points in increasing productivity and maximizing profits will not b effective.
Conclusion
In summary, carrying out simple and multiple regression using gender, age, department, position, and tenure as the independent variables and commitment and job satisfaction as the dependent variables to understand its implication for the management of the enterprise is essential in understanding the role of regression analysis in realizing better insights to inform the decision-making process. Thus, organizations should focus on other critical aspects in the organizational settings to enhance the employees’ organizational commitment other than position, tenure, department, age, and gender.
References
Abeyrathna, S. P. G. M., & Priyadarshana, A. J. M. (2019). Impact of Firm Size on Profitability. International Journal of Scientific and Research Publications, 9(6), 561-564.
Ozyasar, H. (2019, March 5). Application of regression analysis in business. Small Business – Chron.com. https://smallbusiness.chron.com/application-regression-analysis-business-77200.html
Frost, J. (2023, March 21). How to perform regression analysis using Excel. Statistics By Jim. https://statisticsbyjim.com/regression/regression-analysis-excel/
Nguyen, J. (2023, May 9). Regression Basics for business analysis. Investopedia. https://www.investopedia.com/articles/financial-theory/09/regression-analysis-basics-business.asp
Frost, J. (2023b, May 18). Independent and dependent variables: Differences & examples. Statistics By Jim. https://statisticsbyjim.com/regression/independent-dependent-variables/
 write
write