Not only is the hospital management charged with delivering quality care services, but it also manages the organizational financial health. Lee, Yu & Yoon (2019) add that the quality of healthcare provision and effectiveness in financial management are intertwined. Conducting XXX’s financial analysis through financial ratios not only enlightens the facility’s strengths but also areas the institution is venerable hence providing recommendations on how to improve financial health to improve the quality of care services further.
Financial Ratios
Profitability Ratio
The profitability ratio measures an organization’s potential to generate income/profit relative to the total revenue. As a financial indicator, profitability ratios measure a hospital’s ability to generate income to replace assets, meet the increasing healthcare service demands, and compensate investors. Total margin, a profitability ratio, assesses a hospital’s revenue against expenses from all inpatient, outpatient, and non-patient healthcare services. (net income) by the institutional total revenue. The total margin calculations for the hospital are in Table 1. The total margin formula is (Net income / total revenue total patient revenue).
Table 1: Total margin calculation
| 2018 | 2019 | 2020 | 2021 | 2022 | |
| Total Margin | 8.547865 | 8.279819 | 4.960675 | 13.11033 | 30.9288 |
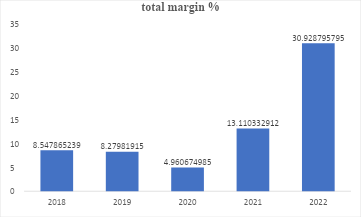
Figure 1: Total margin graphical presentation 2018-2022
Liquidity Ratios
Liquidity ratios measure a hospital’s ability to meet cash obligations on time, i.e., payment of debts on time. The ratios are essential in projecting the facility going into bankruptcy or causing interruptions in the hospital’s healthcare services provision (Bem et al., 2014). Effectively, the ratio provides the intensity of healthcare a facility can provide. For example, the current ratio assesses a facility’s assets divided by liabilities. Table 2 provides the hospital’s current ratio calculations.
Table 2: Current ratio calculation
| 2018 | 2019 | 2020 | 2021 | 2022 | |
| Current Ratio | 1.709676 | 2.166747 | 0.847209 | 1.330859 | 2.394443 |
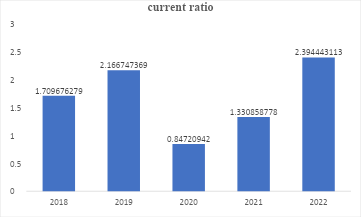
Figure 2: Current ratio graphical representation
Capital Structure
Capital structure or solvency assesses the hospital’s assets financing through debt or equity to ascertain how much the facility can take more debt. Equity financing evaluates the percentage of total assets financed by equity or total fund balances. The total fund balance is first calculated by subtracting total liabilities from total assets. Then, the total fund balances are divided by the total assets. The hospital’s equity financing calculations are in Table 3.
Table 3: Equity financing
| 2018 | 2019 | 2020 | 2021 | 2022 | |
| Equity Financing | 93.85% | 95.27% | 89.50% | 92.70% | 96.05% |
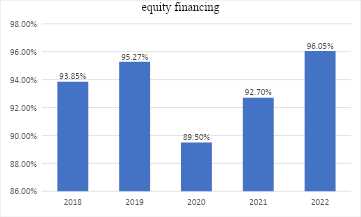
Figure 3: Graphical representation of equity financing
Asset Efficiency
Asset efficiency infers an organization’s optimal ability to generate revenue from its assets. According to Turner et al. (2015), the asset turnover ratio captures a company’s efficiency in generating profits from the available assets. The ratio is calculated by dividing total sales by total assets (see Table 4).
Table 4: Asset turnover ratio
| 2018 | 2019 | 2020 | 2021 | 2022 | |
| Asset Turnover Ratio | 3.15803816 | 2.959806 | 2.628443 | 2.76809 | 2.739991 |
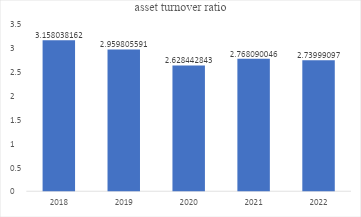
Figure 4: Asset turnover ratio graphical representation
Hospital’s Financial Health (Strengths)
Control of expenses relative to revenues
Based on Figure 1, derived from calculations in Table 1, from 2018 to 2022, the total margin is positive, indicating that the total revenue exceeds total expenses. However, despite the slight decline in total margin from 2018 to 2019, since 2020, the profitability ratio has surged from the lowest of 4.96% in 2020 to 30.93% in 2022. The subsequent increase is attributed to the number of patients, which helps reduce the cost of care provision per patient (unit). Comparing the hospital’s total margin ratio against the U.S. national median, the facility’s performance in 2021 and 2022 outperformed the national median of 5.41% as of 2020, according to the Flex Monitoring Team (2022).
Improved liquidity
Since 2021, the current ratio has increased immensely, see figure 2. With the current ratio above 1, the hospital can cover its current liabilities, i.e., short-term debts with its existing current assets. Specifically, this was realized in 2022 when the hospital’s current ratio exceeded the U.S. median of 1.87 (Flex Monitoring Team, 2022). With Definitive Healthcare (2023) attributing the high current ratio to the number of beds, it is also clear that the sharp decline in the current ratio in 2020 and the subsequent pandemic recovery in 2021 can be attributed to the high number of covid-19 related cases, which since the pandemic began subsiding, so did the number of beds.
Investor confidence
Despite the share of equity financing being higher in the facility, over 89% is still higher than the U.S. media of 49.15% based on the Flex Monitoring Team (2022). Matthews & Roxas (2023) support the increase by stating that between 2010 and 2019, private investment in hospitals amounts to$750 billion. The same scholars retaliate that post-pandemic era; this is expected to spike further due to the significant amount of unspent capital invested in the healthcare industry. Figure 3 shows that 2020 had the least equity financing attributed to market uncertainty, as there has never been such a global pandemic. Nonetheless, from 2021 to 2021, private equity investment confidence increased, attributed to the business opportunities needed to solve healthcare problems such as fragmented care delivery and improved management expertise, especially in handling the COVID-19 cases in high numbers. Therefore, if there had been efficiency improvements with fewer patients, the hospital would have been operating at even higher efficiencies, attracting private equity.
High efficiency
Based on Table 4, the asset turnover ratio of over 2.5 from 2018 to 2022 signifies high efficiency in generating revenues from the assets. Following the pandemic, the asset turnover ratio began increasing, a sign of improving efficiency following the slight decline from 2018 to 2020 (see Figure 4). From a private equity point of view, the facility is worth investing in due to the improved ability to generate sales from the assets, mainly due to efficiency in managerial decisions. Such managerial efficiency is in real-time inventory monitoring to ensure that the hospital does not run out of stock. Also, there is cost efficiency in the procurement practices, hence minimizing resource wastage and enforcing timely restocking.
Potential Issues and Recommendations
Optimize capital investment
Despite the rising total margin, current ratio, and asset turnover ratio since 2020, there is much growth potential if the hospital considers debt financing. For instance, according to Figure 3, the percentage of debt financing has been reduced from 10.5%, 7.3%, and 4.95% in 2020,2021 and 2022, respectively. With Sussman & Jordahl’s (2010) assertion that health care is a capital-intensive venture, debt financing becomes an essential source of capital. Therefore, increased debt financing access on a periodical basis will ensure the provision of healthcare services and support operations improvement, such as access to the latest medical technology. Also, this will reduce the aging equipment scenario, which could compromise the quality of care, decreasing the total patient revenue from the flow of patients. Additionally, despite the increase in debt interest, the hospital will improve value-based healthcare provision, improve the facility competencies, and integrate high physician arrangements, making the hospital one of the top choices and boosting revenues. However, accessing debt requires souring the loans at reasonable costs to reduce the interest on loans.
Leveraging uncompensated with debt financing
Based on the high uncompensated care from Medicaid and other uncompensated care, the hospital can use accounts receivables financing to boost debt financing in line with asset-based lending. Essentially, this aims to increase financial flexibility by using uncompensated care by negotiating with the respective insurance providers to access loans to fund patient care initiatives by upgrading equipment and other operational expenses (Coughlin, Ramos & Samuel-Jakubos, 2020). Notably, the outstanding invoices from a mix of state and federal government (Medicaid) and private insurance providers can amerce a cash reserve by obtaining debt from other credit providers to manage the facility’s expenses. Such capital should be redirected to capital expenses to benefit the insured, increasing the net patient revenues for maximum utility. Effectively, this will replenish the available capital, bearing in mind that the current ratio stability has been growing since 2020, reaching optimum levels in 2022. Consequentially, it will create a bridge between the date of care service provided to patients and receipts from Medicaid and other private insurance companies. An improved version is entailed in modern asset-based lending models where the hospital can sell the pending accounts receivables at a discount (Ivanovic, Baresa & Sinisa, 2011) to fund the hospital’s operations and improve organizational liquidity.
References
Bem, A., Prędkiewicz, K., Prędkiewicz, P., & Ucieklak-Jeż, P. (2014). Determinants of hospital’s financial liquidity. Procedia Economics and Finance, 12, 27-36.
Coughlin, T. A., Ramos, C., & Samuel-Jakubos, H. (2020). Safety net hospitals in the Covid-19 crisis: How five hospitals have fared financially. Washington, DC: Urban Institute, 13, 1-13. https://www.urban.org/sites/default/files/publication/103483/safety-net-hospitals-in-the-covid-19-crisis-how-five-hospitals-have-fared-financially_0_0.pdf
Definitive Healthcare. (2023). Evaluating U.S. hospital liquidity with current and quick ratios. Retrieved from https://www.definitivehc.com/resources/healthcare-insights/hospital-liquidity
Flex Monitoring Team. (2022). CAH financial indicators report: Summary of indicator medians by state. Data Summary Report No. 33. https://crh.arizona.edu/sites/default/files/2023-01/2_State-Medians-Report_revised.pdf
Ivanovic, S., Baresa, S., & Sinisa, B. (2011). Factoring: Alternative model of financing. UTMS Journal of Economics, 2(2), 189-206. https://www.econstor.eu/bitstream/10419/105294/1/715121766.pdf
Lee, D., Yu, S., & Yoon, S. N. (2019). Analysis of hospital management based on the characteristics of hospitals: focusing on financial indicators. Global Business & Finance Review (GBFR), 24(3), 1-13. https://www.econstor.eu/bitstream/10419/224425/1/gbfr2019-24-3-001.pdf
Matthews, S., & Roxas, R. (2023). Private equity and its effect on patients: a window into the future. International Journal of Health Economics and Management, 23(4), 673-684.
Sussman, J., & Jordahl, E. (2010). A guide to financing strategies for hospitals with special consideration for smaller hospitals. Chicago, IL: American Hospital Association, 3-32. https://www.aha.org/system/files/2018-02/guide-financing-strategies-hospitals-special-consideration-smaller-hospitals-2010.pdf
Turner, J., Broom, K., Elliott, M., & Lee, J. F. (2015). A decomposition of hospital profitability: An application of DuPont analysis to the U.S. market. Health Services Research and Managerial Epidemiology, 2, 1-10. https://www.ncbi.nlm.nih.gov/pmc/articles/PMC5266468/pdf/10.1177_2333392815590397.pdf
 write
write