Amazon Company
Amazon.com is a corporation that operates as an online bookstore and provider of various web solutions. (K. & Niyaz, 2022). The company sells a variety of commodities, including clothing, parts for cars and factories, beauty products and pharmaceuticals, electronics, consumables, books, games, jewelry, items for babies and children, movies, harmonic progressions, producing and distributing, toys, and equipment, among other things. Additionally, it offers a vast array of additional support programs, including cloud-hosted services, online ordering, shipping, and numerous other internet-connected services. (K. & Niyaz, 2022). Amazon owns both the online and offline platforms used to sell these commodities, and it also operates the systems. Amazon maintains authority for each of these online marketplaces.
Amazon also designs, manufactures, and distributes various electronic gadgets, including its own Amazon brand of e-readers and desktops, the Firebrand of tablets and televisions, the Echo, and Alexa. This business allows anyone to self-publish their own works in categories including music, filmmaking, and writing. (“Amazon Secures ‘Amazon Pharmacy’ Trademark in the UK,” 2021). The headquarters of Amazon may be found in Seattle, Washington, in the United States. Amazon.com, Incorporated reported income during the year and month ending December 31, 2022, Amazon.com, Incorporated reported income. The fourth revenue was USD 149,204 million, up from last year’s USD 137,412 million. The net profit was $278 million, down from $14,323 million the previous year. Compared to the same time frame a year earlier, basic earnings per share from operating income were only $0.03. Continuing operations contributed $0.03 in diluted earnings per share, down from $1.39 a year earlier.
Overstock Company
Overstock.com, Inc. offers a variety of products for the home. The company provides various products, including furniture, carpets, bedding, home remodeling, storage, mattresses, lighting, and outdoor and kitchen design. Overstock.com caters to people all around the world. The firm follows its poor earnings reports in 2022, which have been down by 33.23% Ytd in Q3 2022, and the accompanying are our revenue estimates for the organization (Lestari, 2022). First, we analyzed the top ten e-commerce businesses in the country based on their market shares. We compared them to Overstock based on their revenue growth performance in Q3 2022, the difference in analyst consensus, stock price change, and revenue estimate for Q4 2022 (BUCHNEV, 2021). In addition, we examined the expansion of the e-commerce industry in terms of total sales and compared it to the expansion of retail sales. Finally, to update our projections for the company, we analyzed Overstock’s revenue growth based on active customer growth and an increase in revenue per customer.
Summary of Companies Performance
The ever increasing demand for Amazon’s products from customers worldwide ensures that the company will maintain its current level of profitability. Amazon anticipates that its annual sales growth rate will be 12.73 percent this year, and its revenue will reach $485.902 billion in 2022. These numbers are attainable in part since Amazon significantly emphasizes scientific innovations and invests significant sums of money in scientific research (Scuba, 2022). Amazon invested $35.93 billion in technology and content in 2019, or 12.8% of the company’s net sales. Amazon devotes most of its research efforts to developing cutting-edge technologies such as artificial intelligence (AI), machine learning, cloud computing, cashless Go stores, industrial robot warehouses, crewless aerial vehicle deliveries, and cyber warfare.
Financial Analysis
Ratio Analysis
A statistical tool that is performed to get an understanding of the liquidity, operational performance and profitability of an organization is called a ratio analysis. This can be achieved by analyzing the business’s financial reports, such as income statements and balance sheets. (Velez-Pareja, 2020). The financial ratio is the first and final step in the technical analysis of ordinary earnings.
Liquidity Ratio
Liquidity ratios are an essential category of financial indicators used to determine whether or not an organization can pay off its existing debt commitments without needing additional funds from other external sources (Velez-Pareja, 2020). When calculating liquidity ratios, three different measurements are considered: the current ratio, the quick ratio, and the operating cash flow ratio (Ita, 2017). A company’s capacity to meet its financial obligations and margin of safety can be calculated using these measures and compared to industry standards.
Liquidity ratio for Amazon
| Ratio | Formula | 2022 | 2021 | 2020 | 2019 |
| 1. Quick Ratio | (Cash and short-term investments + receivables)/current liabilities | 0.4506 | 0.6751 | 0.6678 | 0.6266 |
| 2. Cash Ratio | cash/current liabilities | 0.3468 | 0.2546 | 0.3333 | 0.4110 |
From the computation, the has been a significant decline in the liquidity ratio. For instance, the 2019 quick ratio was 0.6266; in 2020, there was an increase to 0.6678, 0.6751, which was 2021, implying an increase. There was a decline to 0.4506 in the year 2022.
Liquidity ratio for Overstock Inc.
| Ratio | Formula | 2022 | 2021 | 2020 | 2019 |
| 1. Quick Ratio | (Cash and short-term investments + receivables)/current liabilities | 0.0000 | 1.8483 | 1.5821 | 0.5675 |
| 2. Cash Ratio | cash/current liabilities | 0.000 | 1.848 | 1.577 | 0.520 |
Overstock Incorporation has shown a significant improvement in the manner that there is an increase. In the year 2019 cash ratio was 0.520. In 2020, there was an improvement to 1.577; again, there was an improvement up to 1.848 in 2021. Again, the quick ratio implies an increase from 0.5675 in 2019. It increases to 2021. Therefore, Overstock is performing better in the market.
Efficiency Ratio
Efficiency ratios, often known as activity ratios, are a strategy analysts use to analyze a company’s success over a short period or in the present. Each of these ratios assigns a numerical value to the operations that make up a company’s business by using the figures found in either the company’s current assets or current liabilities (Gibson, 2020). An efficiency ratio is a metric that examines how effectively a company can convert its resources into a monetary return on investment. The efficiency ratio, for instance, would often consider various characteristics of the organization, including the time required to turn goods into cash or the time needed to collect cash from clients (Gibson, 2020). Efficiency ratios are significant since an increase in efficiency ratios almost always corresponds to an increase in profitability.
Amazon Company
| Ratio | Formula | 2022 | 2021 | 2020 | 2019 |
| 4. Days in Receivable | 365/ (revenue-total/receivables | 29.83 | 25.36 | 22.98 | 26.73 |
Overstock Incorporation
| Ratio | Formula | 2022 | 2021 | 2020 | 2019 |
| 4. Days in Receivable | 365/ (revenue-total/receivables | 3.35 | 2.81 | 4.41 | 6.96 |
When comparing the two companies, it is noted that Amazon is doing great compared to Overstock regarding debtors collection. This implies that Amazon company has better terms in collections.
Solvency Ratio
Since it evaluates a company’s actual cash flow rather than its net income, a solvency ratio provides a more comprehensive measurement of its financial stability (Velez-Pareja, 2020). In order to accomplish this, depreciation and other non-cash expenses are factored into the calculation of a company’s ability to continue operating successfully.
This capacity for generating cash flow has been calculated concerning all liabilities. In this sense, a solvency ratio estimates the corporation’s long-term health by calculating its capacity to repay its long-term debt and the interest on that debt.
Overstock Incorporation
| 3. Debt to Equity Ratio | liabilities-total/stockholder’s equity | #VALUE! | 0.432 | 1.222 | 2.630 |
Amazon Company
| 3. Debt to Equity Ratio | liabilities-total/stockholder’s equity | 2.17 | 2.04 | 2.44 | 2.63 |
From the analysis, Amazon company is highly leveraged compared to Overstock. The implication is that the number of solvency keeps decreasing from the year 2019 to the year 2022 from 2.63 to 2.17, respectively. Thus, it is doing better. On the other hand, Overstock Incorporation is doing excellent in reducing the rate from 2.630 to 0.432 in 2022.
Profitability Ratio
A company’s capacity for generating earnings following its sales, operational costs, cash balance assets, or stockholders’ equity over a prolonged time frame is evaluated with the help of a category of financial measurements known as profitability ratios. (Shimko, 2020). These ratios are calculated using data from a single point in time and are used to evaluate a company’s ability to generate earnings. When it comes to the majority of profitability ratios, it is a sign that the company is doing well if it has a value that is higher when compared to a ratio that a competitor has or when compared to the same ratio from a period in the past (Shimko, 2020). The most insightful use of profitability ratios is to compare them to those of other companies operating in the same industry, the company’s historical ratios, or the average ratios for the industry in which the company is engaged.
Amazon Company
| Ratio | Formula | 2022 | 2021 | 2020 | 2019 |
| 5. Return on Assets (ROA) | net income (loss)/assets | (0.006) | 0.079 | 0.066 | 0.051 |
| 6. Profit Margin (PM) | net income (loss)/revenue | -0.53% | 7.10% | 5.53% | 4.13% |
| 7. Return on Equity (ROE) | net income(loss)/stockholder’s equity | (0.019) | 0.241 | 0.228 | 0.187 |
Overstock Incorporation
| Ratio | Formula | 2022 | 2021 | 2020 | 2019 |
| 5. Return on Assets (ROA) | net income (loss)/assets | #VALUE! | 36.53% | 7.07% | -29.17% |
| 6. Profit Margin (PM) | net income (loss)/revenue | #VALUE! | 14.13% | 2.35% | -8.35% |
| 7. Return on Equity (ROE) | net income(loss)/stockholder’s equity | #VALUE! | 52.31% | 15.70% | -105.87% |
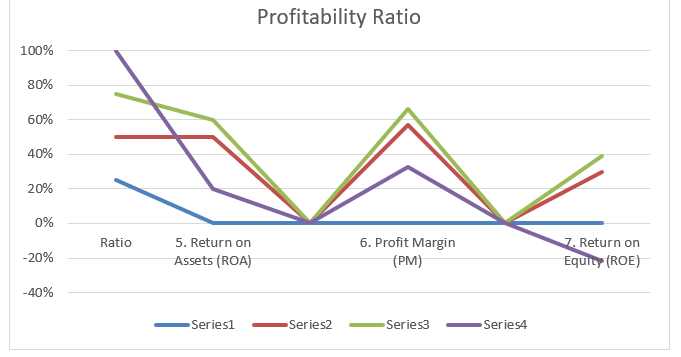
The analysis shows us that Overstock incorporation has an increasing profitability ratio. For example, the return on equity in 2019 has increased from -105% in 2019 to 52.31% in 2021. This indicates a higher increase implying that the company is doing fine in the market. Comparing the same ratio for Amazon suggests a slow gain of returns from the market. Henceforth the rates are so low compared to the market rates for the profitability ratio. In 2019, Amazon recorded a return on equity of 0.187, 0.228 in the year 2020, in the year 2021 0.241 increase, and 2022, it was about -0.19 decrease.
On overall performance, Amazon company is performing better in the market. This implies that for the company to perform well, it has to be well structured in terms of operational performance, gaining, and the enforcement laid in place. This would help the business to prevail in the market and maintain the forces brought out by the competitors. As much Overstock incorporation is trying to cope with the market, much must be needed to maintain the market at full attention.
References
Amazon secures the “Amazon Pharmacy” trademark in the UK. (2021). Pharmaceutical Journal. https://doi.org/10.1211/pj.2021.1.61899
BUCHNEV, V. O. (2021). Awarding employees by giving them shares (shares) in the company’s authorized capital. Аграрное и земельное право, 8, 88–90. https://doi.org/10.47643/1815-1329_2021_8_88
Gibson, C. (2020). How Chartered Financial Analysts View Financial Ratios. Financial Analysts Journal, 43(3), 74–76. https://doi.org/10.2469/faj.v43.n3.73
Ita, A. (2017). How Do Banks Adapt Their Asset Holdings to Binding Leverage Ratio and Liquidity Requirements under Basel III? SSRN Electronic Journal. https://doi.org/10.2139/ssrn.2884961
K., M., & Niyaz. (2022). Development of Fashionable Products through Online Retailing: A Case Study on Amazon and Flipkart. International Journal of Case Studies in Business, IT, and Education, pp. 61–75. https://doi.org/10.47992/ijcsbe.2581.6942.0151
Lestari, N. F. (2022). Analysis of Inventory Management in Order to Reduce Overstock (Case Study of TVF Footwear). International Journal of Current Science Research and Review, 05(09). https://doi.org/10.47191/ijcsrr/v5-i9-48
Ramos Santiago, D. (2017). The role of FSC certification to maintain sustainability: the case of Precious Woods Amazon Company. REBRAE, 10(1). https://doi.org/10.7213/rebrae.10.001.ao01
Scuba, R. V. (2022). STRATEGIC APPROACHES TO PROMOTING PRODUCTS OF A REGIONAL COMMERCIAL ORGANIZATION BASED ON INCREASING CONSUMER DEMAND. Moscow Economic Journal, 7(7). https://doi.org/10.55186/2413046x_2022_7_7_426
Shimko, O. V. (2020). Analyzing profitability ratios of leading global public oil and gas corporations. Financial Analytics: Science and Experience, 13(2), 200–215. https://doi.org/10.24891/fa.13.2.200
Velez-Pareja, I. (2020). Financial Analysis and Control – Financial Ratio Analysis. SSRN Electronic Journal. https://doi.org/10.2139/ssrn.1638279
 write
write