Introduction
Microsoft Corporation was formed in the year 1975 by Bills Gates and his partner Paul Allen (Franek, 2020). Today Microsoft is one of the known software organization all over the world. The company is a multinational technology company that develops personal computers, computer software, and related services (Microsoft, 2021). This paper will discuss the financial analysis of the Microsoft Corporation which is conducted based on the public available financial data for the year 2020 to 2021 and will discuss the financial strength and weaknesses of Microsoft Company based on its operations, ratio analysis, and cash flow.
Financial analysis of Microsoft Company enables the growth of the company (Microsoft, 2021). The financial analysis has enabled the company to know its strengths and weaknesses, therefore allowing it to focus on improving its strengths and reducing its weaknesses (Krylov, 2018). The financial analysis has also helped attract different investors because an investor constantly invests in a business with a lot more strengths than weaknesses. The following are the ways by which to identify the financial strength and weaknesses of the Microsoft Company.
Operations of Microsoft Corporation
Microsoft Company offers a lot of products and services to its customers (Mayes, 2020). Today, the main area of focus for Microsoft is software products and cloud-based services for business. On January 24, 2022, Microsoft Corporation announced the results for the quarter ended December 31, 2021, compared to the corresponding period of the last fiscal year. The company had revenue of $51.8 billion which was a 21% increase (Microsoft, 2021). The operating income was $22.2 billion, a 24% increase (Microsoft, 2021). The net income for the company was $18.8 billion, which was an increase of 21% from the previous year.
The company was able to get its revenue from the different services it offers to its customers (Franek, 2020). The products and services the company offers can be grouped into the following areas. First is the business productivity area. The business productivity area mainly includes the Microsoft Office, which offers different products of office tools like Excel, Word, and PowerPoint. The business productivity area was able to generate a revenue of $15.9 billion, a 19% increment from the previous year.
The other important area of Microsoft’s operation based on income generation is the server goods and services (Franek, 2020). This area includes both the original on area Microsoft Server and Microsoft SQL Server and even the modern Azure cloud (Franek, 2020). The original servers products are still important revenue generating areas and even grows really slow each year. However, the Azure cloud is a fast growing server product. The server products and services of Microsoft Corporation were able to generate a revenue of $18.3 billion in the year ended December 31, 2021, an increase of 26% from the previous year (Franek, 2020). The business productivity area and the area of server products and services are the most financial strength of Microsoft Corporation because both make up 60% of the company’s revenue generated in the financial year 2021.
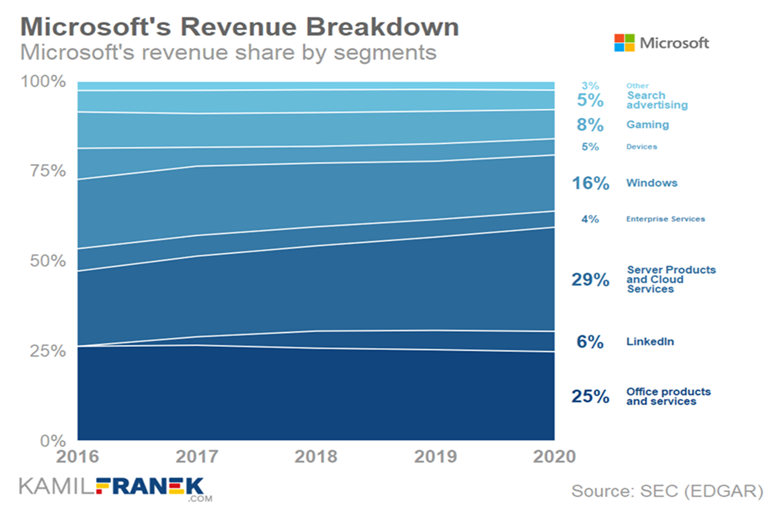
The other area from which Microsoft generates its revenue is made of small parts like personal computing products, the gaming area, search and news advertising, and many more. All these areas combined generate 40% of all the revenue generated by Microsoft Corporation (Microsoft, 2021). This area was able to generate $17.5 billion in the financial year 2021, which was a 15% increase from the previous year.
Therefore, the above data shows the products and services that generate a lot of revenue for the company (Krylov, 2018). The business productivity area and server products and services area is the most income-generating products therefore, they are the financial strength of the company (Krylov, 2018). Because they generate revenue, the company should focus all its resources on improving the product. In the instance of the search area, which does not create a lot of income, the company should consider it a financial weakness because the operating cost is more than the revenue. Therefore, the company should consider dropping the service to use the operating cost on more productive products.
Ratio Analysis
Ratio analysis refers to a fundamental aspect of equity analysis that involves the extraction of insight by quantitatively analyzing a company’s profitability, operational efficiency, and liquidity.
Current Ratio
The current ratio is the division between the assets and current liabilities that indicate the ability of a company to pay its current liabilities with its assets (Mayes, 2020). Microsoft had a total of 174,188 assets in 2020, which was an increase of 5%, thanks to increasing investments into different investment opportunities. Microsoft also had 77510 liabilities. Therefore the company had a current ratio of 2.25 in the quarter that ended in December 2021. The current ratio of Microsoft Corporation was 2.52 in 2020 (Microsoft, 2021). The following draft shows the current ratio of Microsoft over the years.
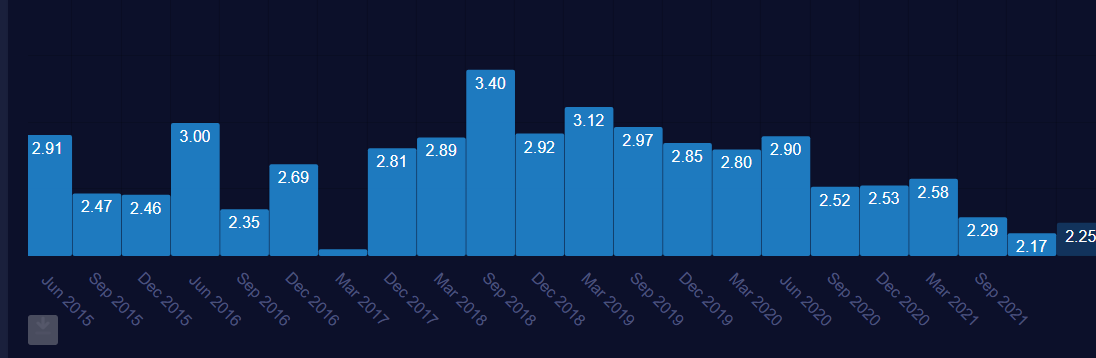
Therefore, using the current ratio data can give a sense of the efficiency of Microsoft Corporation’s operating cycle or its ability to turn its products into cash (Bhar, 2019). Because the current ratio of Microsoft Company is high, it means that it is more capable of paying its obligations. Therefore, using Microsoft’s ratio analysis over the years means that the company is on the right track. The company has financial strength because it is able to buy more assets and invest more in various fields, therefore, increasing its current ratio (Bhar, 2019). But compared to recent months, the current ratio is seen to decrease. In March 2021, the current ratio was at 2.58, and in December 2021, it was 2.25. Thus it shows the company’s weakness. This weakness is brought about by the company making bad investments. These bad investments do not increase the assets of the company, therefore, reducing the current ratio.
Cash Flow
Cash flow refers to the total number of money and the money equivalent being moved in and out of a company (Bhar, 2019). Microsoft Corporation is a big company therefore, it has a large amount of cash flow. Microsoft’s annual free cash flow for the year 2019 was $38.26 billion, an 18% increase from 2018. In 2020, the annual free cash flow for Microsoft was $45.23 billion, an increase of 18% from 2019. In the year 2021, the free cash flow for Microsoft was $56.12 billion, which was a 24% increase from 2020 (Mayes, 2020). The above data is represented in the figure below.
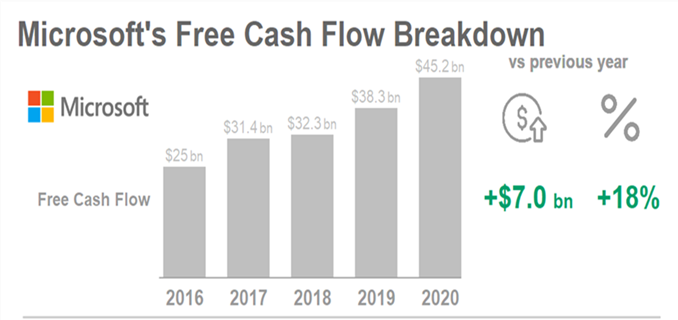
Free cash flow is the biggest important cash flow calculations (Bhar, 2019). The free cash flow shows how much cash Microsoft can generate. The company used its free cash flow in various ways. The company used $6 billion to repay its debts. The second largest outflow was $15.1 billion, which was used to pay its shareholders as dividends. Finally, the most significant outflow was $23 billion, which was used for purchasing its own stocks.
With a large cash flow, it indicates the growth of Microsoft’s business, whereby it can self-pay its investment opportunities and yet be able to pay a large amount of dividend to investors (Bhar, 2019). Therefore a large amount of free cash flow shows the financial strength Microsoft has. The financial weakness demonstrated by the amount of cash flow generated by Microsoft is about how to use it (Franek, 2020). The company uses a lot of money to invest in a bad investment. For example, in 2017, the company used a lot of free cash flow to purchase LinkedIn, and after that, it had to borrow a large amount of money to be able to keep paying its investors.
In conclusion, financial analysis of companies is very important to organizations. Analyzing the operations, ratio analysis, and cash flow of a company will help to identify its financial strength and weaknesses of the company. In the case of Microsoft Corporation, the study of the company’s operations helped identify processes that generate a lot of revenue and the operations that make the organization lose revenue. The ratio analysis of Microsoft Company revealed that the company is more capable of standing for itself and being able to pay its debts therefore, it has financial strength. Finally, Microsoft Company has financial strength because of the high volume of cash flow it generates. With more cash flow, the company is able to pay the investors, debts and also invest in other businesses.
References
Bhar, A. K. (2019). Design & implementation of a personal Cash flow program using Microsoft Excel. Global Journal of Business, Economics and Management: Current Issues, 9(1), 29–40. https://www.ceeol.com/search/article-detail?id=968807
Franek, K. (2020, August 9). Microsoft Annual Report: Financial Overview & Analysis 2020. KAMIL FRANEK | Business Analytics. https://www.kamilfranek.com/microsoft-annual-report-financial-overview-and-analysis/
Krylov, S. (2018). Target financial forecasting as an instrument to improve company financial health. Cogent Business & Management, 5(1). https://doi.org/10.1080/23311975.2018.1540074
Mayes, T. R. (2020). Financial Analysis with Microsoft Excel. In Google Books. Cengage Learning. https://books.google.com/books?hl=en&lr=&id=0mf6DwAAQBAJ&oi=fnd&pg=PP1&dq=microsoft+financial+analysis&ots=0ZPkij_DJ4&sig=gvUZwhgSth3mjGW9sgfOlEhCc_Q
Microsoft. (2021). Microsoft 2021 Annual Report. Www.microsoft.com. https://www.microsoft.com/investor/reports/ar21/index.html
 write
write