1. Introduction
The selected industry for analysis in this report is Australia’s new energy vehicle industry. Australia ranks as one of the developed countries with a GDP per capita of 60,443.11 USD. In 2021, Australia occupied position 10 in GDP per capita, above countries such as Netherlands and Sweden (Anon, 2022). As a developed country, tackling climate change is one of the top priorities of the Australian government, which is in line with the improvements in the living standards in the country over the past. The increased value of the transportation segment in Australia has also increased over the past with an estimated annual growth of 0.89% (Statista, 2023). The increased transportation indicates the potential increase in greenhouse gas emissions and excessive oil consumption, which could render the country’s transportation sector unsustainable. The spiralling concern for environmental health justifies the selection of Australia’s new energy vehicle industry. The industry assessment will also provide insights into the position of Australia in line with the strong global argument for the deployment and uptake of electric vehicles and other alternative fuel vehicles. The new energy vehicles adopted in this paper refer to the “designated plug-in electric vehicles that qualify for public subsidies (Zheng, 2021). The new energy vehicles are considered plug-in electric vehicles (PHV), which belong under the electric vehicles category. The other electric vehicle under this category includes the fuel cell electric vehicle (FCEV), hybrid electric vehicle (HEV), plug-in hybrid electric vehicle (PHEV) and battery electric vehicle (BEV) (Wang et al., 2019). In Australia, the electric vehicle market account for about 3.8% of the vehicle sales in 2022. The market share of electric vehicles in Australia varies based on the region, with the Australia Capital Territory having the highest share of EVs at 10% of the vehicles purchased in 2022 (The Guardian, 2023). The new energy vehicle market was 3.89 billion USD in 2021 and is expected to reach 20 billion USD by 2027 based on a 33.06% CAGR (Mordor Intelligence, 2023). The expected growth of the new energy vehicle industry further warrants its analysis to determine the factors for deploying and adopting these vehicles in Australia.
2. Industry Macro-Environment Analysis
2.1 Macro-Economic Environment Factors Relevant to the New Energy Vehicle Industry
The macro-economic environment analysis adopted in this paper provides insights into the factors within the larger economy of Australia that affect the new energy vehicle uptake from an economic sense. The analysis, therefore, included identifying trends in inflation, fiscal policy, and the gross domestic product (GDP)
Australia has a GDP per capita of 60,443.11 USD. In 2021, Australia occupied position 10 in terms of GDP per capita, above countries such as Netherlands and Sweden (Anon, 2022). Australia’s higher GDP per capita indicates that Australia is a high-income country. The strong GDP performance over the past years indicated increasing living standards in the country with improved disposable income.
Fiscal incentives provide one of the tools adopted by the government to increase the penetration of new energy vehicles in the domestic market. The new energy vehicles are characterized by higher purchase prices compared to combustion engine vehicles (Lévay et al., 2017). The high cost is often considered a barrier to the sales of new energy vehicles in Australia. Subsidies form part of the Australian government expenditure aimed to stimulate investment in the new energy vehicle industry besides maximizing the sustainability outcome associated with this type of vehicle (Foley et al., 2020). Australia provides fiscal incentives to the tune of $ 3000 for all-electric vehicles purchased without restrictions on when the vehicle was purchased (RACV, 2023). This subsidy represents a supplementary policy from the Australian government aimed at developing the infrastructure and incentivizing the purchase of new energy vehicles.
Australia experienced a consistent increase in the inflation rate from the fourth quarter of 2020, rising from 0.7% to an all-time high of 7.8% in the 4th quarter of 2022, as indicated in the figure below (Trading Economics, 2023). The high inflation rates corresponded to an increase in transport, housing and other product categories supporting a 1.9% quarterly increase in consumer prices (Trading Economics, 2023).
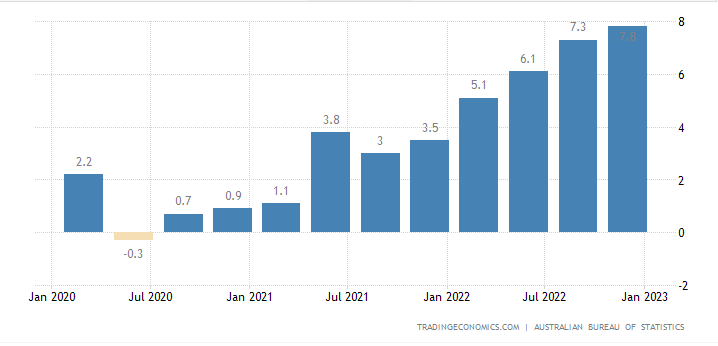
Figure 1 Australia inflation rate trends. Source (Trading Economics, 2023)
2.2 Impact of the Macro-Economic Environment on the new energy vehicles industry
As affordability in the new vehicle industry remains a major issue, the income of the consumers plays a key role in the uptake of these vehicles (ACEA, 2021). With a GDP of 60,443.11 USD, Australia is a rich country with a higher consumer potential to purchase new energy vehicles (Mordor Intelligence, 2023). The 33.06% CAGR corresponds to the 3.38% average increase in the economy of Australia from 1990. The economy of Australia revived from the COVID-19 impacts in 2021, reaching an all-time high annual GDP growth rate of 10.30% (Trading Economics, 2023). The high GDP signifies a higher income, hence the capability of Australian consumers to afford new energy vehicles.
The supplementary policy i.e. the subsidies for the new energy vehicles can be deciphered into different categories, which include the facility supporting subsidy, industrial subsidies and purchasing subsidies (Foley et al., 2020). Considering the categories of subsidies highlighted above, the Australian government provides a $3,000 purchase subsidy (RACV, 2023). A $100 industry subsidy for the annual registration of the vehicles is also provided. Facility-supporting subsidies are not well established by the rebates, incentives and discounts provided for electric vehicles. The fiscal incentives positively influence the purchase and use of new energy vehicles in Australia. In this case, the government of Australia adopts fiscal incentives to generate demand for new energy vehicles in the country, considering that the high prices of the vehicles compared to the combustion engine vehicles reduced the expenditure in this category.
Higher inflation indicated an increase in the auto industry at a time when the costs of new energy vehicles were less affordable. The effects of inflation characterized the increase of Tesla prices by up to $6,000 in 2022 (Duvet, 2022). Inflation, therefore, makes the new energy vehicles more expensive than ever, discouraging the purchase. Inflation, therefore, has the potential to slow the uptake of new energy vehicles in Australia.
2.3 Factors Influencing Supply and Demand in the New Energy Vehicles Industry
Government subsidy represents one of the main determinants of supply and demand in the new energy vehicles industry. Financial barriers are recognized as key barriers to purchasing and using new energy vehicles in Australia. One of the tools adopted by the government to stimulate demand and supply in the new energy vehicle industry comprises subsidies. Subsidies, in this case, aim to improve the importation of electric vehicles besides encouraging production, hence shifting the supply curve, as indicated in the figure below. The supply curve, in this case, shifts downwards from S1 to S2. The increased supply of new energy vehicles, in turn, increases the quantity demand by Australian consumers. As the subsidy is part of government expenditure, the shift in the supply curve depends on what the Australian government spends in the different subsidy categories, i.e. facility supporting subsidies, industrial subsidies and purchasing subsidies.
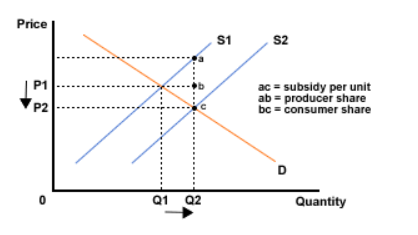
Figure 2 Impact of subsidies on the supply and demand of new energy vehicles
The subsidy provided by the government, therefore, benefits both the consumers and the producers/importers of new energy vehicles. For the consumers, the shift in the supply curve indicates that more quantities are demanded at lower prices and the consumer share of the subsidy is represented by bc, which is a fraction of the subsidy provided per unit.
Inflation is a price-determining factor where the prices of new energy vehicles increase. The price increase indicated that a lower quantity of new energy vehicles would be demanded when the inflation was 7.8% compared to when the inflation was 0.7% some time back in 2020 (Duvet, 2022). High inflation reduces the demand for new energy vehicles in Australia.
As compared to the two other factors, GDP per capita determines demand and not the prices of new energy vehicles. The high GDP of Australia, with the country among the top 10 richest countries, indicated a higher income. The high income increases the capacity of Australian consumers to afford new energy vehicles, which signals an increase in demand. Holding the other market factors constant shifts the demand curve rightwards when the economy improves. The rightward shift indicates that the market is no longer in equilibrium even when more new energy products are demanded at the prevailing market prices. In such conditions, the prices of new energy vehicles are expected to increase until a new equilibrium is achieved.
2.4 Challenges and Opportunities for the New Energy Vehicle Industry
The new energy vehicles industry analysis highlighted cost as the main challenge. The new energy vehicles are relatively high-priced compared to the internal combustion vehicles in Australia. Internal combustion engine vehicles are the main substitutes for new energy vehicles. The increasing inflation indicates that the consumers’ income allocation is affected. With inflation, consumers spend more at a time when the prices of new energy vehicles also go up. In this scenario, the consumers are more motivated to consume the lower-priced substitutes, which include internal combustion engine vehicles, thereby reducing the adoption of these sustainable vehicles in Australia.
Another challenge in the new energy vehicle industry is the supply chain disruptions caused by events such as the COVID-19 pandemic (Wen et al., 2021). Supply chain disruptions reduce supply, increasing prices, an outcome previously used to explain the decline in new energy vehicle sales during the COVID-19 period (Foley et al., 2020). The movement and travel restrictions affect overall transport, hence the need for Australian consumers to purchase new energy vehicles.
Despite the challenge mentioned above, government expenditure in terms of subsidies and the growth of the Australian economy highlight factors that could trigger the purchase of new energy vehicles. The government subsidies provide the people purchasing new energy vehicles with advantages such as cost reduction among other incentives compared to those purchasing or importing internal combustion engine vehicles. Besides, the high income highlights an increase in the number of people in Australia who can afford the new energy vehicles, which are high prices.
3. Analysis
3.1 Problems and Opportunities for the new Vehicle Industry in Australia
The macroeconomic analysis of Australia’s new energy industry identifies three factors that affect the industry. The influence of the three factors is described in the figure below, and how they affect the supply and demand in the industry.
The impacts of subsidy and inflation on the demand and supply of new energy vehicles in Australia are often tense. The expected price advantages from the subsidy are indicated by bc. But considering a scenario in which the prices of new energy vehicles increased by $6000 compared to a purchase subsidy of $3000, the price is still higher by about $3000. In this case, the inflation shifts the supply curve to the left instead of the prices of new energy vehicles reducing from P1 to P2 while increasing the quantity demanded from Q1 to Q2. In this case, the subsidy cannot offset the price increase due to inflation resulting in a new price P3 and a demand for Q3.
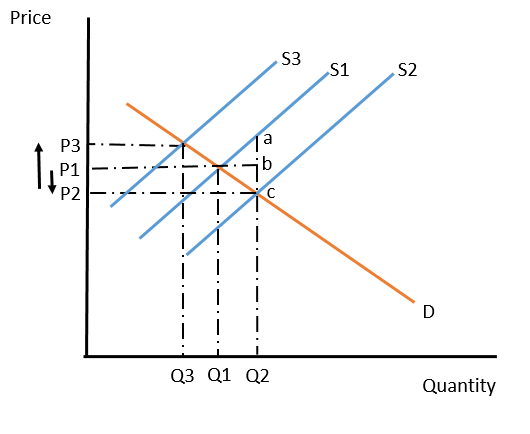
Figure 3 Analysis of the tension between inflation and subsidy on the new energy vehicle industry in Australia
As indicated in the table above, the level of subsidy provided is offset by inflation, where inflation cannot stimulate the purchase of new energy vehicles in Australia. The price increase indicated that the supply of new energy vehicles reduces, accompanied by a decline in the quantities purchased.
3.2 Government Policies to intervene in the Industry
Besides subsidies, there exist other tools that the Australian government could adopt to stimulate supply and demand for new energy vehicles. Providing significant fiscal incentives are undermined by inflation and disposable income as consumer expenditure declines with the increasing process (Ganesh et al., 2014). The tightening of the tailpipe CO2 and fuel economy in Australia is one of the relevant policies to offset the decline in demand for new energy vehicles, which are more highly-priced than internal combustion vehicles (Zhang et al., 2017). Subjecting internal combustion vehicles to stringent standards and levying a fee for carbon emission is key.
In this case, the internal combustion vehicles are low-priced, indicating that when inflation increases prices, the customers are more inclined to purchase the lower-priced substitute (Zhang et al., 2017). Increasing the costs of the substitutes within the Australian economy will reduce the supply into the country hence the demand. Implementing a policy that increases the prices of internal combustion vehicles will directly impact the demand for new energy vehicles at the same prices, as indicated in the figure below.
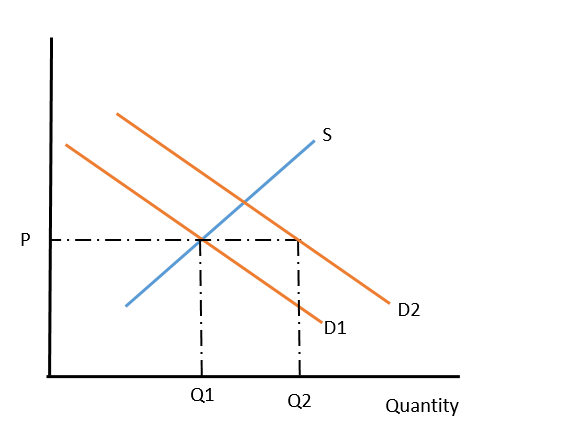
Figure 4 Effects of policy targeting tailpipe CO2 and fuel economy on demand for new energy vehicles
As indicated in the figure above, the demand curve for the new electric vehicles shifts rightwards from D1 to D2, reflecting an increase in the prices of internal combustion vehicles. The demand for new energy vehicles in Australia will therefore move from Q1 to Q2 when the prices remain the same at P. in this case, the prices of the new energy vehicle influence on the consumers’ purchase decision are limited, which in turn increases the supply and demand for the new energy vehicles.
4. Conclusion
This report provides an analysis of the macroeconomic environment in relation to the new energy vehicles industry in Australia. The analysis was based on three macroeconomic environment factors: GDP, inflation rates, fiscal policies, and incentives. The fiscal incentives assessed in this report included the new energy vehicle purchase subsidy. Australia’s subsidy and growing GDP were identified as motivations for purchasing new energy vehicles. The outcomes of these two factors were moderated by inflation. Inflation affected the prices of new energy vehicles besides reducing the money allocated for transport. To offset the effects of inflation in affecting the impacts of income and subsidies in stimulating the consumption of new energy vehicles, the following recommendation was developed:
The findings presented in this report indicated that the Australian government should seek an alternative policy approach to stimulate the supply and demand for new energy vehicles as the subsidy’s influence was overshadowed by inflation. It was recommended that the government tighten regulations on the importation of combustion engine vehicles, including levies on tailpipe CO2 and fossil fuel consumption. These strategies will increase the prices of internal combustion vehicles, a substitute for new energy vehicles. Under the influence of the policy mentioned above, the demand for new energy vehicles will increase at the same price in the country when the long-term costs for the new energy vehicles are lower than that of its substitute.
References
ACEA 2021. Electric cars: Lower-income countries fall behind, with uptake linked to GDP per capita. ACEA. [Online]. [Accessed 21 March 2023]. Available from: https://www.acea.auto/press-release/electric-cars-lower-income-countries-fall-behind-with-uptake-linked-to-gdp-per-capita/.
Anon 2022. Projected GDP per capita ranking. World GDP per capita Ranking 2021 – StatisticsTimes.com. [Online]. [Accessed 21 March 2023]. Available from: https://statisticstimes.com/economy/projected-world-gdp-capita-ranking.php.
Duvet, E. 2022. High inflation is affecting the electric vehicle market. GetJerry.com. [Online]. [Accessed 21 March 2023]. Available from: https://getjerry.com/electric-vehicles/high-inflation-affecting-electric-vehicle-market.
Foley, B., Degirmenci, K. and Yigitcanlar, T. 2020. Factors affecting electric vehicle uptake: Insights from a descriptive analysis in Australia. Urban Science. 4(4), p.57.
Ganesh, M., Raghunathan, S. and Rajendran, C. 2014. The value of information sharing in a multi-product, multi-level supply chain: Impact of product substitution, demand correlation, and partial information sharing. Decision Support Systems. 58, pp.79–94.
Lévay, P.Z., Drossinos, Y. and Thiel, C. 2017. The effect of fiscal incentives on market penetration of electric vehicles: A pairwise comparison of the total cost of ownership. Energy Policy. 105, pp.524–533.
Mordor Intelligence 2023. Australia Electric Vehicle Market Analysis – industry report – trends, Size & Share. Australia Electric Vehicle Market Analysis – Industry Report – Trends, Size & Share. [Online]. [Accessed 21 March 2023]. Available from: https://www.mordorintelligence.com/industry-reports/australia-electric-vehicle-market#:~:text=The%20Australia%20Electric%20Vehicle%20Market%20was%20valued%20at%20USD%203.89,period%20(2022%20%2D%202027).
RACV 2023. Electric vehicle (EV) discounts and incentives per state in Australia: RACV. @RACV. [Online]. [Accessed 21 March 2023]. Available from: https://www.racv.com.au/royalauto/transport/electric-vehicles/electric-car-discounts-government-incentives-australia.html#:~:text=%243%2C000%20subsidy%20for%20the%20first,discount%20on%20registration%20fees%20annually.
Statista 2023. Public transportation – Australia: Market forecast. Statista. [Online]. [Accessed 21 March 2023]. Available from: https://www.statista.com/outlook/mmo/shared-mobility/shared-vehicles/public-transportation/australia#:~:text=Revenue%20is%20expected%20to%20show,to%20hit%2054.3%25%20by%202027.
The Guardian 2023. The number of electric vehicles on Australian roads soars as demand exceeds supply. The Guardian. [Online]. [Accessed 21 March 2023]. Available from: https://www.theguardian.com/environment/2023/feb/07/number-of-electric-vehicles-on-australian-roads-soars-as-demand-exceeds-supply#:~:text=Electric%20vehicles%20accounted%20for%203.8,up%20from%205%25%20in%202021.
Trading Economics 2023. Australia GDP annual growth RATE2022 data – 2023 forecast – 1960-2021 historical. Australia GDP Annual Growth Rate – 2022 Data – 2023 Forecast – 1960-2021 Historical. [Online]. [Accessed 21 March 2023]. Available from: https://tradingeconomics.com/australia/gdp-growth-annual#:~:text=GDP%20Annual%20Growth%20Rate%20in,the%20second%20quarter%20of%202020.
Wang, N., Tang, L. and Pan, H. 2019. A global comparison and assessment of Incentive Policy on Electric Vehicle Promotion. Sustainable Cities and Society. 44, pp.597–603.
Wen, W., Yang, S., Zhou, P. and Gao, S.Z. 2021. Impacts of covid-19 on the electric vehicle industry: Evidence from China. Renewable and Sustainable Energy Reviews. 144, p.111024.
Zhang, Q., Ou, X., Yan, X. and Zhang, X. 2017. Electric vehicle market penetration and impacts on energy consumption and CO2 emission in the future: Beijing case. Energies. 10(2), p.228.
Zheng, H. 2021. New Energy Vehicles in China. Encyclopedia. [Online]. [Accessed 21 March 2023]. Available from: https://encyclopedia.pub/entry/37552.
 write
write