Introduction
Social anxiety leads to the fear of situations that occur in public. One believes they are perceived or acts in ways leading to humiliation. Common concerns include coming across as incompetent or dull, sweating, blushing, shaking, or anxious. However, these concerns are disproportionate to the expected outcome (Bystritsky et al., 2013). Ultimately these individuals dread encounters with other people leading to social withdrawal and social interactions. A range of severity characterizes social anxiety, like many psychological challenges. For starters, it is the evolutionary prompt of how one looks or appears before others. On the extreme, it becomes a highly debilitating clinical disorder resulting in specific cognitions and behaviors.
The social role theory and the schema theory propose that women and men experience social anxiety differently. Hence, there is a need for research in gender differences. For instance, the cognitive-behavioral model of problematic Internet use (PIU) proposes that social anxiety is associated with specific behaviors and cognitions on the internet (Yu et al., 2016). Hence, the research objective can be narrowed down to the relationship between PIU represented by happiness and social anxiety. Besides, there is no adequate research on multidimensional problematic Internet use and social anxiety levels. The hypotheses are tailored to explore the gender difference among the social anxiety group. Secondly, the data analysis examines the relationship between resilience, happiness, and fear.
The research problem (PIU) is described as unhealthy internet consequences such as distraction, impulse control, depression, social comfort, addiction, and social benefits. Despite the similarities with internet addiction, PIU does not necessarily contain all internet addiction symptoms. The associations between psychological impairments and PIU are supported by the PIU cognitive-behavioral model (Gámez-Guadix et al., 2015). The displacement hypothesis states that internet use is critical since it eats up time spent in real-life interactions. Hence, leading to psychological problems as one engages less in real-life interactions. Further, students who are socially more anxious and lonely tend to use the internet as a solution.
The internet is available for individuals who want to gratify their needs, interact with others, and conveniently disclose their inner selves. Hypothetically, these individuals are considered unhappy with their current real-life situations. Hence, they try to create an environment where they feel more comfortable and unwanted. However, the use of the internet leads to different types of problems. Therefore, the research uses the Subjective Happiness Scale [SH] (Lyubomirsky & Lepper, 1999]) to measure the level of happiness.
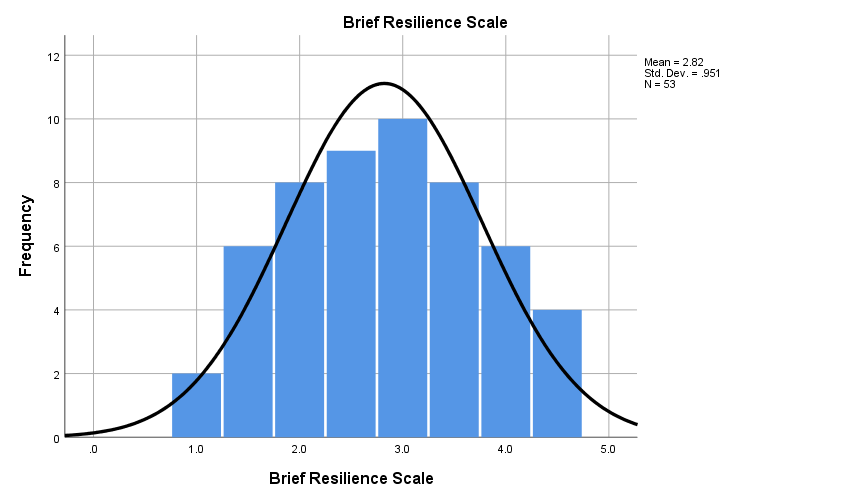
Social anxiety is a social menace increasing at a fast rate, especially among students. Resilience factors are vital in dealing with social anxiety. However, a limited understanding of the resilience impact on social anxiety exists. There exist two significant types of resilience, namely social-ecological and psychological. In a study by Jefferies et al. (2021) from 5,880 young people (SD = 3.95 M= 22 years), they found that social anxiety is negatively correlated to psychological resilience. On the other hand, the impact of social-ecological strength is less consistent among the seven different countries in which the study was carried in (Vietnam, US, Thailand, Russia, Indonesia, China, and Brazil). In this paper, the Brief Resilience Scale (BRS) is used to measure the resilience level among the participants.
Hypothesis
Null hypothesis 1: Women’s and men’s social anxiety levels have no significant difference.
Alternate hypothesis 1: Women’s and men’s social anxiety levels have a significant difference.
Null hypothesis 2: Happiness and social anxiety have no relationship.
Alternate hypothesis 2: Happiness and social anxiety have a relationship.
Null hypothesis 3: Resilience and social anxiety have no relationship.
Alternate hypothesis 3: Resilience and social anxiety have no relationship.
Null hypothesis 4: Social anxiety, happiness, and resilience cannot be used to explain the social anxiety level of a specific gender.
Alternate hypothesis 4: Society anxiety, happiness, and resilience can be used to explain the social anxiety level of a specific gender.
Methods Section
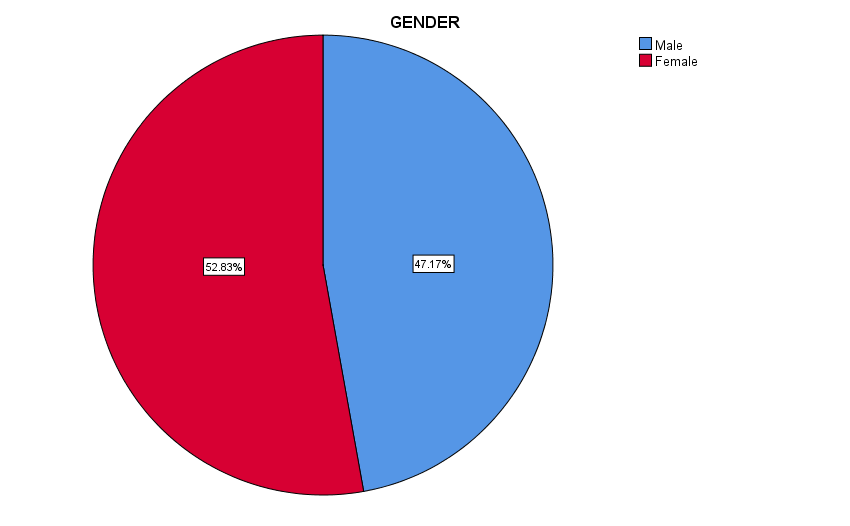
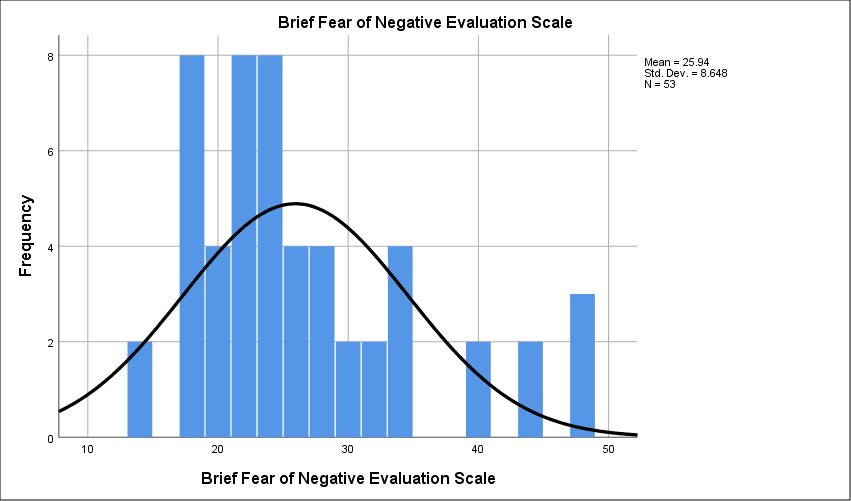
The research is quantitative and uses secondary data collected by a psychologist working in mental health. The participants are 53 undergraduate students, of whom 41.17 % are men and 52.38% are women, as indicated in the appendix 3 pie chart. The data collection was through a survey where the participants’ resilience was measured using the Brief Resilience Scale (BRS). The happiness level was measured using the Subjective Happiness Scale (SHS) and Brief Fear of Negative Evaluation Scale (BFNE) to measure social anxiety. Higher scores BRS (1-5), SHS (4-28), and BFNE (12-60) indicate higher scores of resilience, happiness, and social anxiety, respectively. Those who scored a 25 and above overall score have a significant social concern. The data analysis techniques include the T-test, Chi-square, and correlation.
Results
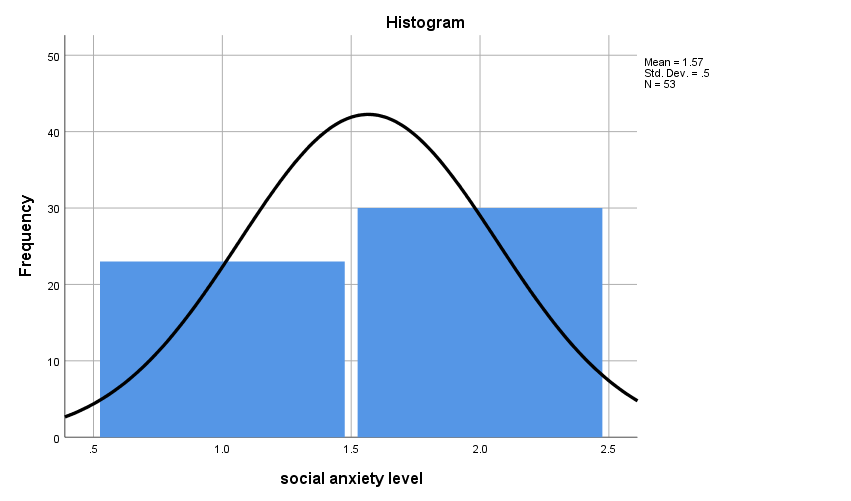
The descriptive statistics for social anxiety levels (M= 1.57, SD = 0.5) indicate the number of participants with low anxiety levels (mode =2) is higher than the number of participants with higher anxiety levels. This is indicated in Appendix 1 of the data analysis. The histogram in appendix 2 shows a bell-shaped line, which indicates the data, is uniformly/normally distributed; that is, data is unimodal. The independent t-test is used to test whether both males and females exhibit the same levels of social anxiety. The independent variable is the social anxiety levels, while the dependent variable is Gender. The independent t-test indicates a mean difference in the anxiety levels between both male (M =1.72, SD = 0.46) and female (M = 1.43, SD = 0.50) as shown in appendix 4. A mean difference of 0.29 (20%) is not statically significant; hence, the null hypothesis that both men and women suffer have the same social anxiety levels. The probability of getting the same results as the null hypothesis is 0.03 [t (51) = 2.20, p< 0.05]. Therefore, it is rejected. Hence, social anxiety scores among men and women have no significant difference.
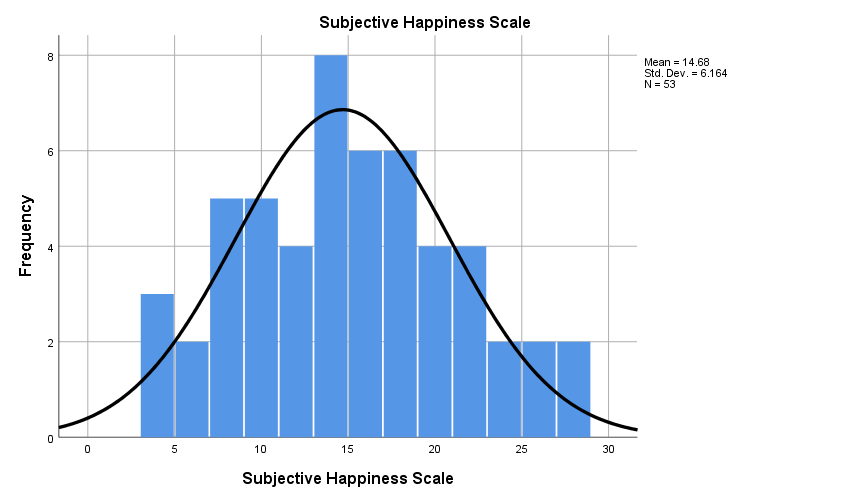
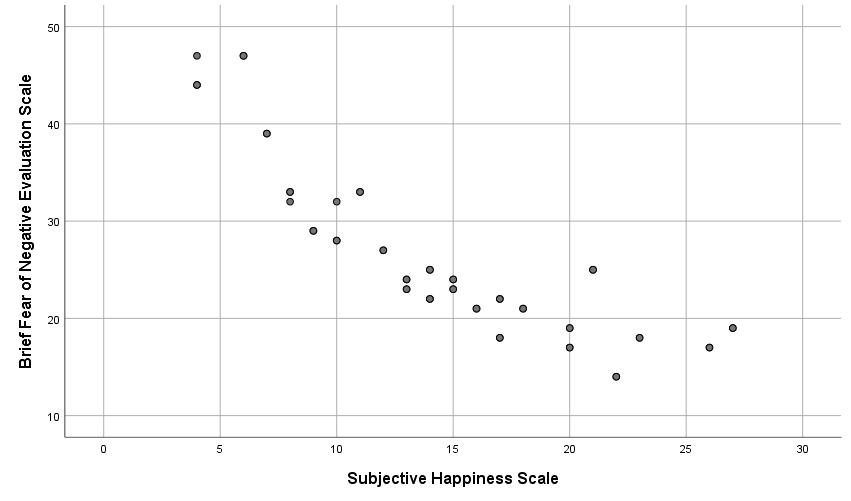
The strength of the relationship between social anxiety, resilience, and happiness is measured using correlation. The values for kurtosis and skewness indicate that the data is normally distributed according to appendix 5. Also, the histogram shape means the information is uniformly distributed and passes for parametric tests. The scatter plot in Appendix 7 indicates that social anxiety and happiness have a strong relationship that is in the negative direction. The correlation matrix between social anxiety and happiness in appendix 8 indicates a p-value of 0.86 (p> .05). Therefore, the null hypothesis is not rejected since there is an 86% chance that the null hypothesis could have produced the results. Hence, the relationship between social anxiety and happiness has no statistical significance.
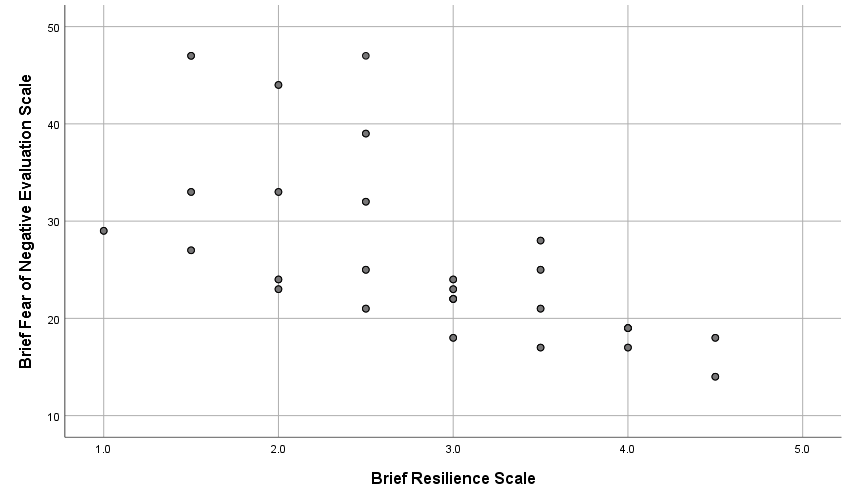
The third hypothesis is on resilience and social anxiety, measured using correlation. The results of appendix 9, which indicate the kurtosis and skewness and those of the histogram in appendix 10 showing the uniform distribution, pass the data as parametric. Hence, Pearson correlation is used to determine the relationship between the two variables. The histogram on resilience and social anxiety indicates the two variables have a negative and weak relationship. The results of the correlation matrix fail to reject the null hypothesis with a score of 0.65 (p> 0.05). Hence, the relationship between social anxiety and resilience has no statistical significance.
The fourth objective is to test how the relationship between social anxiety, resilience, and happiness scores can be used to explore social anxiety levels among males and females. The independent variable is Gender, while the dependent variable is social anxiety level. The chi-square is used to analyze the association. Both gender and social anxiety level variables are nominally scaled, hence passing the chi-square assumptions. Also, as seen in appendix 14, the scores are natural frequencies, and none of the expected frequencies fall below 5. The Chi-square value is 4.567, the degree of freedom (df)is 1, while the p-value is 0.03, as shown in appendix 15. The chi-square value is regarded as high with a significance level of 0.03 (p < .05). Therefore, social anxiety, happiness, and resilience can be used to explain the social anxiety level of a specific gender.
Discussion
The descriptive statistics indicate that males scored higher than females in the social anxiety levels. Further, the independent t-test shows the results are statistically significant; hence, the null hypothesis is rejected. Generally, studies have shown that women suffer from social anxiety than men (Balogu et al., 2018). However, the characteristics of the current population, culture and contemporary era have changed this perspective, as found out by Balogu et al. (2008). The findings of the data analysis support this change. This is maybe due to the shift in gender roles whereby they are almost the same in this contemporary era. Besides, the educational opportunities for women have closed the gap in social anxiety as women are becoming more active in society. However, there is still a need for further research and studies on men’s statistical significance with higher anxiety levels.
The second hypothesis tests the significant relationship between happiness and social anxiety. The happiness variable is used to measure the PIU of the students. For instance, men’s social components are related to social benefit problems. Women, on the other hand, have adverse use problems. A man with high social anxiety has a higher likelihood of using the internet for social support. Besides, more social problems will arise from excessive internet use. The scatter plot indicates a strong relationship between social anxiety and happiness. However, the Pearson correlation did not find any statistical significance. The third hypothesis tests the significant relationship between resilience and social anxiety. The Pearson correlation results indicate no statistical relations between the two variables despite the scatter plot showing a weak and positive relationship. The four hypotheses test how one can predict the anxiety score of a particular gender from the cumulative score of happiness, social anxiety, and resilience. The results were statistically significant; hence, the conclusion that the three variables can predict the social anxiety scores of an individual. The limitation of the findings is that the data used is from a non-clinical sample. Therefore, the results can only be generalized to a population of the same characteristics. Also, there might be common method bias as the survey relied on self-report measures. Further studies are needed to provide dynamic models to predict social anxiety without reliance on sex-related factors and cultural nuances.
References
Jefferies, P., Höltge, J., & Ungar, M. (2021). Social anxiety and resilience: Associations vary by country and sex. Adversity and Resilience Science, 2(1), 51-62. https://link.springer.com/article/10.1007/s42844-020-00026-2
Baloğlu, M., Kozan, H. İ. Ö., & Kesici, Ş. (2018). Gender differences in and the relationships between social anxiety and problematic internet use: Canonical analysis. Journal of medical Internet research, 20(1), e33. https://www.jmir.org/2018/1/e33/
Bystritsky, A., Khalsa, S. S., Cameron, M. E., & Schiffman, J. (2013). Current diagnosis and treatment of anxiety disorders. Pharmacy and Therapeutics, 38(1), 30. https://www.ncbi.nlm.nih.gov/pmc/articles/PMC3628173/
Yu, S., Wu, A. M. S., & Pesigan, I. J. A. (2016). Cognitive and psychosocial health risk factors of social networking addiction. International journal of mental health and addiction, 14(4), 550-564. https://link.springer.com/article/10.1007/s11469-015-9612-8
Gámez-Guadix, M., Calvete, E., Orue, I., & Las Hayas, C. (2015). Problematic Internet use and inappropriate alcohol use from the cognitive-behavioral model: A longitudinal study among adolescents. Addictive behaviors, 40, 109-114. https://www.sciencedirect.com/science/article/pii/S0306460314003001
Appendices
Appendix 1: Descriptive Statistics for Social Anxiety Levels
| Statistics | ||
| social anxiety level | ||
| N | Valid | 53 |
| Missing | 0 | |
| Mean | 1.57 | |
| Median | 2.00 | |
| Mode | 2 | |
| Std. Deviation | .500 | |
| Variance | .250 | |
Appendix 2: Histogram on Social Anxiety Levels
Appendix 3: Pie chart on Gender of the Participants
Appendix 4: Independent T-Test
| Group Statistics | |||||
| GENDER | N | Mean | Std. Deviation | Std. Error Mean | |
| social anxiety level | Male | 25 | 1.72 | .458 | .092 |
| Female | 28 | 1.43 | .504 | .095 | |
| Independent Samples Test | ||||||||||
| Levene’s Test for Equality of Variances | t-test for Equality of Means | |||||||||
| F | Sig. | t | df | Sig. (2-tailed) | Mean Difference | Std. Error Difference | 95% Confidence Interval of the Difference | |||
| Lower | Upper | |||||||||
| social anxiety level | Equal variances assumed | 4.527 | .038 | 2.193 | 51 | .033 | .291 | .133 | .025 | .558 |
| Equal variances not assumed | 2.205 | 50.979 | .032 | .291 | .132 | .026 | .557 | |||
Appendix 5: Statistics for BFNE and SHS
| Statistics | |||
| Brief Fear of Negative Evaluation Scale | Subjective Happiness Scale | ||
| N | Valid | 53 | 53 |
| Missing | 0 | 0 | |
| Mean | 25.94 | 14.68 | |
| Median | 24.00 | 14.00 | |
| Mode | 17a | 13a | |
| Std. Deviation | 8.648 | 6.164 | |
| Variance | 74.785 | 37.991 | |
| Skewness | 1.103 | .190 | |
| Std. Error of Skewness | .327 | .327 | |
| Kurtosis | .557 | -.664 | |
| Std. Error of Kurtosis | .644 | .644 | |
| Sum | 1375 | 778 | |
| a. Multiple modes exist. The smallest value is shown | |||
Appendix 6: Histograms for BFNE and SHS

Appendix 7: Scatterplot for BFNE and SHS
Appendix 8: Correlation between Happiness and Social Anxiety
| Correlations | |||
| Brief Fear of Negative Evaluation Scale | Subjective Happiness Scale | ||
| Short Fear of Negative Evaluation Scale | Pearson Correlation | 1 | -.864** |
| Sig. (2-tailed) | .000 | ||
| N | 53 | 53 | |
| Subjective Happiness Scale | Pearson Correlation | -.864** | 1 |
| Sig. (2-tailed) | .000 | ||
| N | 53 | 53 | |
| **. Correlation is significant at the 0.01 level (2-tailed). | |||
Appendix 9: Statistics for BFNE and BRS
| Statistics | |||
| Brief Fear of Negative Evaluation Scale | Brief Resilience Scale | ||
| N | Valid | 53 | 53 |
| Missing | 0 | 0 | |
| Mean | 25.94 | 2.821 | |
| Median | 24.00 | 3.000 | |
| Mode | 17a | 3.0 | |
| Std. Deviation | 8.648 | .9512 | |
| Variance | 74.785 | .905 | |
| Skewness | 1.103 | .017 | |
| Std. Error of Skewness | .327 | .327 | |
| Kurtosis | .557 | -.832 | |
| Std. Error of Kurtosis | .644 | .644 | |
| Sum | 1375 | 149.5 | |
| a. Multiple modes exist. The smallest value is shown | |||
Appendix 10: Histograms for BFNE and BRS
Appendix 11: Scatterplot for BFNE and SHS
Appendix 12: Correlation between Resilience and Social Anxiety
| Correlations | |||
| Brief Fear of Negative Evaluation Scale | Brief Resilience Scale | ||
| Momentary Fear of Negative Evaluation Scale | Pearson Correlation | 1 | -.659** |
| Sig. (2-tailed) | .000 | ||
| N | 53 | 53 | |
| Brief Resilience Scale | Pearson Correlation | -.659** | 1 |
| Sig. (2-tailed) | .000 | ||
| N | 53 | 53 | |
| **. Correlation is significant at the 0.01 level (2-tailed). | |||
Appendix 13: Cross tabulation
| GENDER * social anxiety level Crosstabulation | |||||
| social anxiety level | Total | ||||
| High | Low | ||||
| GENDER | Male | Count | 7 | 18 | 25 |
| Expected Count | 10.8 | 14.2 | 25.0 | ||
| % within GENDER | 28.0% | 72.0% | 100.0% | ||
| % within social anxiety level | 30.4% | 60.0% | 47.2% | ||
| % of Total | 13.2% | 34.0% | 47.2% | ||
| Female | Count | 16 | 12 | 28 | |
| Expected Count | 12.2 | 15.8 | 28.0 | ||
| % within GENDER | 57.1% | 42.9% | 100.0% | ||
| % within social anxiety level | 69.6% | 40.0% | 52.8% | ||
| % of Total | 30.2% | 22.6% | 52.8% | ||
| Total | Count | 23 | 30 | 53 | |
| Expected Count | 23.0 | 30.0 | 53.0 | ||
| % within GENDER | 43.4% | 56.6% | 100.0% | ||
| % within social anxiety level | 100.0% | 100.0% | 100.0% | ||
| % of Total | 43.4% | 56.6% | 100.0% | ||
Appendix 14: Chi-Square test
| Chi-Square Tests | |||||
| Value | df | Asymptotic Significance (2-sided) | Exact Sig. (2-sided) | Exact Sig. (1-sided) | |
| Pearson Chi-Square | 4.567a | 1 | .033 | ||
| Continuity Corrections | 3.457 | 1 | .063 | ||
| Likelihood Ratio | 4.656 | 1 | .031 | ||
| Fisher’s Exact Test | .052 | .031 | |||
| Linear-by-Linear Association | 4.480 | 1 | .034 | ||
| N of Valid Cases | 53 | ||||
| a. 0 cells (0.0%) have an expected count less than 5. The minimum expected count is 10.85. | |||||
| b. Computed only for a 2×2 table | |||||
| Symmetric Measures | |||
| Value | Approximate Significance | ||
| Nominal by Nominal | Phi | -.294 | .033 |
| Cramer’s V | .294 | .033 | |
| N of Valid Cases | 53 | ||
 write
write