Tesla, Inc. is an American-based company operating in the automobile and energy industry. It has its headquarters in Pablo Alto, California, United States. The company specializes in the design and manufacture of electric cars, energy batteries, solar roof tiles, and other related products. Elon Musk, the founder and CEO of Tesla, established the company with a mission of accelerating the production of sustainable electric cars (Kim, 2020). This mission statement is at the heart of the company’s successful corporate-level strategy. Since its inception, Tesla has established several production and assembly plants in California. In addition, it has multiple subsidiaries including Solar City, Maxwell Technologies, Tesla Energy, and Tesla Motors Canada. It has produced various classic models of electric cars such as Model S, Model 3, Model X, model, and Cyber-truck. In 2018, the company was recognized and ranked as the market leader in the manufacturing and sale of the best plug-in cars releasing over 245,240 units every year. As of 2020, the company’s revenue grew to 31.5 billion dollars, representing a 28% increase from 2019. This report focuses on Tesla’s internal and external environmental analysis, including corporate-level strategy, SWOT analysis, business-level strategies, and financial analysis.
Corporate-Level Strategy
Tesla’s main corporate-level strategy is differentiation. The company sets itself apart from its rivals by producing products that are unique. No automotive company other than Tesla has been able to produce a fully electric car that can travel over 250 miles with a single charge. Further to this, the company has a wide network of charging stations allowing customers to travel across the country with a lot of ease. Tesla’s brands are superior equipped with top-notch features such as 24’ LCD screen, leather seats, and a 90KWH battery (Kim, 2020). Through the production of quality brands, customers derive value for their money. The unique customer experience has ensured that the company continues to grow to greater heights. The demand for Tesla’s electric cars continues to grow mainly due to technological advancement, the changing customer expectations, and the new laws on safety and vehicle effluence. However, the widespread acceptance of electric cars can be linked to Tesla’s ability to improve customer experience through the production of superior products. Tesla’s shift to a web-based sales model allows the company to cut on overhead costs while allowing easy access for its products. Customers can now place their orders online, which allows for the customization of products and services. The majority of Tesla’s processes are automated, which allows the company to save millions of dollars on labor costs. Most of its manufacturing and assembling are carried out by robots. For example, the 10ft tall robots are able to rivet, weld, and install various components. An average of 8 robots manufacture a single car and can produce 83 units in a day.
SWOT Analysis
Tesla’s SWOT analysis captures the company’s internal and external strategic factors. Strengths and weaknesses highlight the internal strategic factors while threats and opportunities highlight the company’s external strategic factors.
Strengths: Tesla’s highly innovative processes, powerful brand, and strong control over the production processes put the company in a unique position as a business leader in the automotive industry. The company is known for being highly innovative, especially after it introduced the first fully electric car (Kim, 2020). This capability allows the company to continue manufacturing competitive and profitable products. Tesla’s powerful brand enhances the company’s ability to attract new customers as well as retain them by offering them renewable energy solutions. Tesla’s strong control over its production processes is a unique strength that is possible due to centralization and vertical integration. As a result, Tesla overcomes issues that arise with the involvement of third parties in production processes.
Weaknesses: High prices, limited market presence, and a limited supply chain are the main weaknesses facing Tesla. Most of Tesla’s revenue is generated in the United States because the company has little or no presence in China and the emerging economies. This internal weakness limits the company’s growth given the potential market in the overseas. Having limited market presence overseas means that the company has a lean supply chain (Kim, 2020). The limited supply chain prevents Tesla from expanding and growing. Further to this, Tesla’s products are relatively expensive compared to those of competitors, especially the electric cars with an inbuilt combustion engine. The high prices prevent Tesla from expanding its market share and customer base. These weaknesses demonstrate that Tesla needs to change its strategies to allow for expansion and growth globally.
Opportunities: Business diversification, global sales expansion, and global supply chain expansion are potential opportunities for Tesla’s growth. For example, the company would increase its sales revenues rapidly by establishing operations in emerging economies such as Asian countries. In line with global expansion, the company should consider expanding its supply chain globally to support its production and sales operations (Kim, 2020). Tesla can also increase its profitability through diversification. Introducing new product lines and acquiring new businesses will allow Tesla to reduce the risk of overreliance. All these opportunities highlight the importance of international expansion to match larger companies in the automotive industry like General Motors.
Threats: Fluctuations in material prices, aggressive completion, and dealership regulations are the main threats that prevent Tesla from maximizing its strengths and opportunities. For instance, the competition in the automotive industry, especially for electric cars, solar panels, and batteries limit Tesla’s revenues from international markets. Fluctuations in global prices of materials such as lithium used for the storage of energy products affect the company’s profits (Kim, 2020). Dealership regulations, given that Tesla sells its products directly to customers without involving dealers, increases the selling price for its product offerings. However, dealership regulations in some States such as Texas and Virginia prevent the company from selling directly to customers, so it has to sell through dealers.
Recommendations: Tesla has the necessary strengths to succeed in the automotive industry for some years to come. However, as indicated in the SWOT analysis, there are areas where the company must improve to remain competitive and increase its profitability. For example, Tesla must expand to international markets, especially in emerging markets with high potential for growth (Kim, 2020). Similarly, the company needs to invest heavily in research and development to continue producing advanced products that are more competitive. Thus, Tesla needs to put in place the necessary reforms, strategies, and initiatives that increase international presence, boost innovation, and allow for diversification.
Tesla’s SWOT analysis can be summarized in a table as shown below:
| Strengths | Weaknesses |
| 1. Powerful brand
2. Highly innovative processes 3. Strong control over production processes |
1. High prices for its products
2. Limited market 3. Limited supply chain |
| Opportunities | Threats |
| 1. Global expansion for more revenues
2. Global expansion of supply chain 3. Diversification to several product lines |
1. Dealership regulations
2. Fluctuations in prices of materials 3. Aggressive competition |
IFE Matrix and Analysis
The Internal Factor Evaluation (IFE) matrix is a strategic management tool that is used to evaluate a company’s internal environment to indicate its strengths and weaknesses. Fred R. David developed the IFE matrix to summarize a company’s internal environment (David & David, 2017). Given that strengths and weaknesses form the key internal factors in an organization, they are used as the primary factors in the IFE matrix. Fred suggested that when thinking about the strengths of a company, things that a company does better than its competitors should be considered. Similarly, when thinking about the weaknesses of a company, areas, where improvements are needed, should be considered. Fred argues that for the IFE matrix to be an effective evaluation tool, several internal factors should be identified.
Weights: Once the internal factors (strengths and weaknesses) have been identified, each factor is then assigned some weights ranging from 0.0 to 1.0 in order of importance. The number is an indication of how valuable a factor is if a company wishes to succeed (David & David, 2017). If no weights were assigned, it would mean that all the factors are equally important, which is not practical. For purposes of accuracy, the sum of all weights is equal to 1.0.
Ratings: The ratings in an IFE matrix point to how strong or weak each internal factor is in a company. The ratings are in the form of numbers ranging from 1 to 4, where 4 indicates a major strength while 3 indicates minor strength (David & David, 2017). Number 2 is a sign of minor weakness, while 1 is a sign of a major weakness. For accuracy purposes, strengths can only be assigned a rating of 3 or 4, while weaknesses can only be assigned a rating of 1 or 2.
Weighted Score: The score is arrived at by multiplying the weight by the rating, so each internal factor must receive a certain score. The total weighted score is arrived at by summing up all the individual weighted scores. According to David & David (2017), a low total weighted score is an indication that a company is weak in relation to its competitors, while a higher weighted score shows that the company is strong compared to its competitors in the industry.
The Internal Factor Evaluation (IFE) matrix for Tesla is shown below:
| Internal Factor | Weight | Rating | Weighted Score |
| Strengths | |||
| Powerful brand | 0.10 | 3 | 0.3 |
| Highly innovative processes | 0.20 | 4 | 0.8 |
| Strong control over production processes | 0.20 | 4 | 0.8 |
| Weaknesses | |||
| High prices for its products | 0.15 | 1 | 0.15 |
| Limited market | 0.15 | 1 | 0.15 |
| Limited supply chain | 0.20 | 2 | 0.4 |
| Total Weighted score | 1.0 | 2.6 | |
Grand Strategy Matrix and Analysis
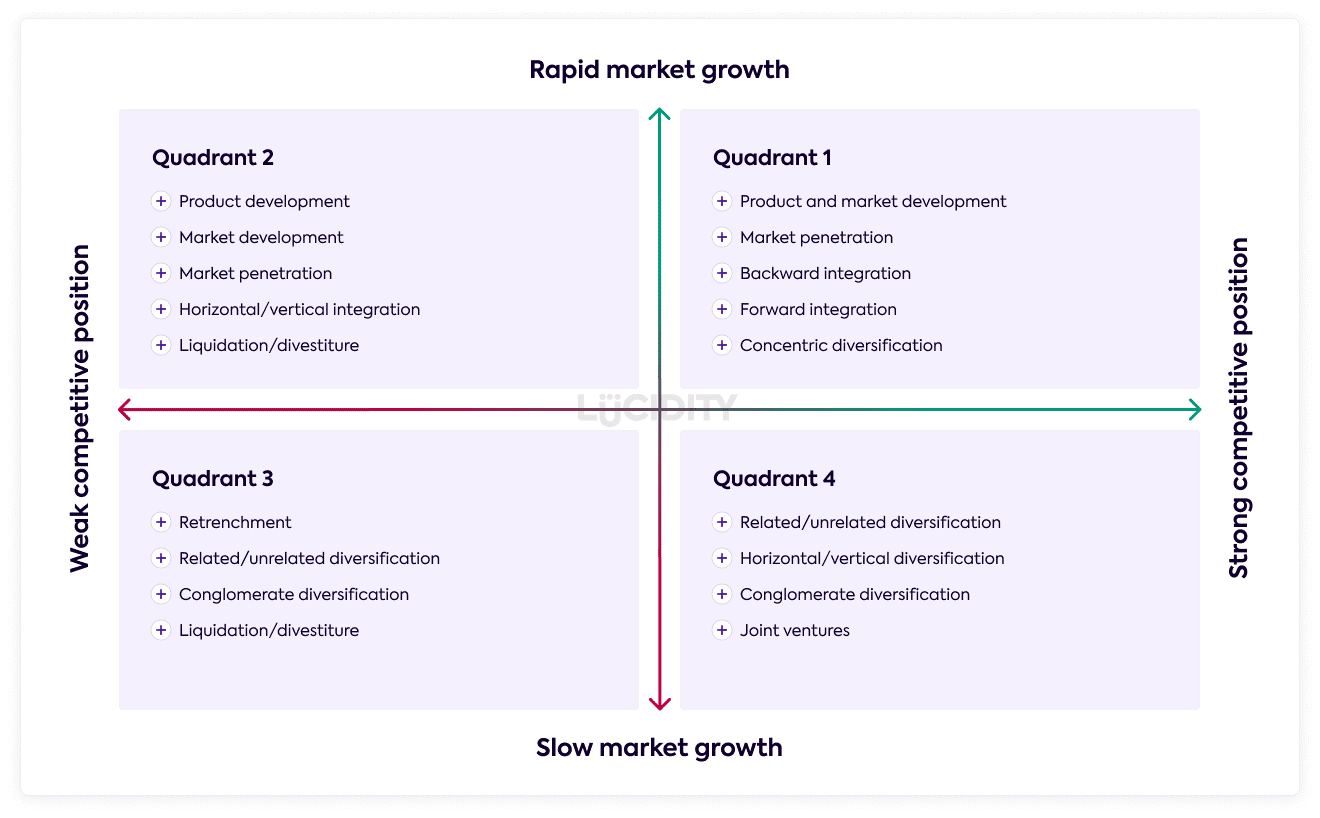
The Grand Strategy Matrix is a classic tool used to formulate and create alternative strategies for a company. All companies fall in one of the Grand Strategy Matrix’s 4 quadrants based on market growth and competitiveness (Betts, 2019). Given that the four quadrants are arranged in order of attractiveness, the matrix provides feasible strategies for an organization to consider.
Firms falling in quadrant 1 is are highly competitive and operate in a rapidly growing market. Companies in this quadrant of the Grand Strategy Matrix are in a favorable position since they have a competitive advantage and operate in a fast-growing market (Betts, 2019). Such companies are in a better position to implement strategies like market penetration, market development, product development, and much more. Firms in quadrant 1 seek to enhance their competitive base and growing their market share to greater heights.
Companies falling in quadrant II operate in a rapidly growing market but are not able to compete effectively. They need to evaluate their current approach to the market to determine what needs to be changed to improve competitiveness (Betts, 2019). The most appropriate strategies for firms in this quadrant is to penetrate into several markets, develop their products, and target market. Since they operate in a rapidly growing market, intensive strategies should be considered to enhance competitiveness. For example, they can opt for horizontal integration depending on the available resources.
Businesses falling in quadrant III are weak in terms of competitiveness and operate in a slowly growing market. These companies need to take drastic measures as quickly as possible to avoid being liquidated. Strategies such as cost reduction, sale of some assets, and retrenchment of redundant labor force should be implemented (Betts, 2019). Shifting the available resources from the current business line to a different line is an alternative strategy that can be pursued by firms in this quadrant. If everything fails, then liquidation is the only option.
Firms falling in quadrant IV compete effectively but operate in a slow-growth market. Such businesses need to pursue related or unrelated integration to establish a market for their products and services. Since these companies have the financial capacity, they should consider launching diversified programs to tap more markets (Betts, 2019). The most ideal strategies for firms in this quadrant include concentric, conglomerate, or horizontal diversification. Joint ventures is also a potential strategy for companies in quadrant IV.
Tesla currently falls in quadrant I of Grand Strategy Matrix pursuing concentric diversification and market penetration strategies. The recent purchase of Solar City, a popular company specializing in solar energy is an indication that the company is serious about diversification (Betts, 2019). The company is also putting in place measures to expand to international markets. Tesla currently dominates the United States of America market, so expanding to emerging markets will help the company to grow its revenues and increase profitability.
The Grand Strategy Matrix according to Betts (2019) is shown below:
Business-Level Strategies
Most average consumers consider Tesla products, especially electric cars to be expensive. Accordingly, the company targets wealthy individuals who are concerned about environmental conservation. However, with more tax incentives to promote the use of all-electric vehicles, the demand for Tesla’s fully electric cars continues to rise (Sharma, 2016). In addition, economic considerations, such as the rising prices of raw materials, fuel prices, and fluctuations in the exchange rate, the demand for Tesla’s cars is expected to rapidly increase. The US government’s effort to create awareness of climate change and the need for sustainable development continues to boost Tesla’s sales.
Tesla’s business-level strategy is to penetrate high-end markets where customers are willing to pay a premium price for its products. However, the company plans to lower the prices once the model succeeds. Thus, the company’s business-level strategy is broader differentiation which targets both premium customers today and low-price customers in the future (Sharma, 2016). Tesla sets itself apart from its rivals through extensive research and development which allows the company to produce highly innovative products. Further to this, the company’s product offerings are eco-friendly, which increases its economies of scale and competitive advantage.
Tesla’s product line can be described as purely energy-based since it deals in capital goods in the larger auto manufacturing industry. It currently manufactures all-electric vehicles, specializing in a range of models including Model S, Model X, and Model Y. In addition, it manufactures mega pack, power pack solar panels, and solar roofs. Today, Tesla is unable to keep up with the high demand for cars, resulting in a waitlist on backorders. The company’s production capacity is lower than demand, so drastic measures are needed to set up more production plants (Sharma, 2016). The demand is influenced by the modern designs, a highly innovative technology used, and the effectiveness of its products.
Functional-Level Strategies
Tesla has an innovative and problem-solving culture that motivates employees to develop ideas to solve the emerging problems in the market. For example, it applies the organizational culture in manufacturing fully electric cars that offer a solution to environmental issues currently facing the automotive industry. The ability to continue introducing advanced products shows the usefulness of its corporate culture. Tesla’s corporate culture is founded on six pillars that are linked to the company’s mission. These pillars are seriously executed by the employees and include moving fast to solve problems, doing the impossible, being constantly innovative, reasoning from first principles, thinking like owners, and being all-inclusive.
Tesla has a functional organizational structure with a function-based hierarchy. For instance, the company has structural groups of employees from the engineering department, sales department, and customer service department. The function-based hierarchy includes functional teams that oversee international and domestic operations (Sakhartov, 2016). This type of structure is traditional in nature and is widely used in companies that want to maintain close managerial control over the operations. Accordingly, the company’s structure includes six functional offices in order of hierarchy. These offices include the office of the chairman, who is also the CEO, Finance, Technology, Global sales and service, engineering, and legal office.
Ratio Analysis
Date of analysis 31/12/2020
Source NASDAQ. (2020 December 31)
| Ratio | Tesla | Industry | Comment |
| Liquidity Ratios | |||
| Current ratio=current assets/current liabilities
Current ratio=$26,717,000/$14,248,000=1.8751 |
1.8751 | 2.46 | weak |
| Leverage Ratios | |||
| Debt/equity ratio=total liabilities/shareholder’s equity
Debt/equity ratio=$29,073,000/$52,148,000=0.5575 |
0.5575 | 0.6 | strong |
| Efficiency Ratios | |||
| Asset turnover ratio=Total sales/ total assets
Asset turnover ratio=$31,536,000/$52,148,000=0.6047 |
0.6047 | 1.35 | weak |
| Profitability Ratios | |||
| Return on Assets=(Net income/total assets)*100
Return on assets=($862,000/$52,148,000)*100=1.6530% |
1.653% | -0.7% | strong |
The Current ratio measures Tesla’s ability to honor its short-term obligations, which fall within one year, using the current assets like cash and cash equivalents. It is a liquidity ratio and shows the company’s level of solvency. A ratio of 1.8751 indicates that the company has sufficient current assets to honor its short-term obligations (NASDAQ, 2020). However, Tesla’s current ratio is weaker compared to the industry’s average current ratio 0f 2.46
Debt-to-equity ratio is a leverage ratio that shows the level of creditor financing versus shareholders’ financing. Tesla’s debt-to-equity ratio of 0.5575 means that shareholders have invested more than creditors, which is desirable (NASDAQ, 2020). Tesla’s debt-to-equity ratio is stronger compared to the industry’s average of 0.6
Asset turnover ratio is an efficiency ratio that measures Tesla’s ability to generate revenues from its assets. For every dollar of assets, Tesla generates 60 cents of sales, which is considerably lower (NASDAQ, 2020). Tesla’s asset turnover ratio is weaker compared to the industry’s average of 1.35
Return on assets is a profitability ratio that indicates how much money Tesla earns by putting its assets to use (NASDAQ, 2020). Tesla’s return on assets of 1.653% shows that the company is efficient relative to the assets that it controls. Tesla’s return on assets is stronger compared to the industry’s average of -0.7%
Conclusion
Overall, Tesla continues to experience robust growth having successfully gained a market share of over 60% in the US market alone. However, from the analysis, the company needs to increase its production capacity to meet the customer demand. To further increase its profitability, the company needs to expand into emerging markets in developing countries. The company is highly innovative, but it must continue investing in research and development to continue producing technologically advanced products.
References
Betts, R. K. (2019). The Grandiosity of Grand Strategy. The Washington Quarterly, 42(4), 7-22.
David, F. R., & David, F. R. (2017). Strategic management concepts and cases. Pearson Education Limited.
Kim, H. (2020). Analysis of How Tesla Creates Core Innovation Capability. International Journal of Business and Management, 15(6), 42-61.
NASDAQ. (2020,December 31). Tesla, Inc. (TSLA). Retrieved from https://finance.yahoo.com/quote/TSLA/financials?p=TSLA
Sakhartov, A. V. (2016). Selecting corporate structure for diversified firms. In Academy of Management Proceedings (Vol. 2016, No. 1, p. 11521). Briarcliff Manor, NY 10510: Academy of Management.
Sharma, S. (2016). The Tesla Phenomena A Business Strategy Report.
 write
write