1. Introduction
Being a new junior operations manager for North London Airport Hub, I have performed passenger data analysis based on the period from 2020-21. This report is intended to assess the efficiency of the current 2-month Moving Average forecasting model and compare it with that recommended by a line manager who has proposed an alternative methodology called as Weighted Approach. Secondly, a third forecasting technique will be presented and supported. The final aim is to find the best forecasting model for an airport. This report aims to analyze passenger data between the years 2020- 21 for North London Airport Hub and proposes recommendations concerning one of the best suitable forecasting models. The report includes an analysis of the current forecasting model, a line manager’s suggested one and selected for further exploration including generating forecast predictions on evaluation errors. Besides, the operational implications and suggestions drawn from the analysis are provided.
2. Data Analysis
From 2020 to 2023, passenger demand at the North London Airport Hub shows distinct patterns. To understand these patterns deeply, an analysis of the given data was performed. The attention was paid to studying differences in the number of passengers between months and years. The importance of this analysis is related to its impact on the choice of a suitable forecasting model. These patterns require visual representations, tables and figures to support it.
Patterns in Passenger Demand:
Several interesting insights can be gleaned from the passenger data presented in Table 1. To see these patterns, Figure 1 depicts the monthly change in passenger counts over three years.
[Figure 1: Monthly Passenger Numbers (2020-2022)]
| Year | Month | Passengers | Year | Month | Passengers | Year | Month | Passengers |
| 2020 | January | 13,441,718 | 2021 | January | 13,970,077 | 2022 | January | 14,470,077 |
| 2020 | February | 11,942,221 | 2021 | February | 12,230,963 | 2022 | February | 12,730,963 |
| 2020 | March | 14,670,996 | 2021 | March | 15,447,435 | 2022 | March | 15,947,435 |
| 2020 | April | 14,286,844 | 2021 | April | 14,507,038 | 2022 | April | 15,007,038 |
| 2020 | May | 14,537,314 | 2021 | May | 15,516,063 | 2022 | May | 16,016,063 |
| 2020 | June | 15,906,101 | 2021 | June | 16,487,702 | 2022 | June | 16,987,702 |
| 2020 | July | 17,362,586 | 2021 | July | 17,954,910 | 2022 | July | 18,454,910 |
| 2020 | August | 16,969,528 | 2021 | August | 17,786,357 | 2022 | August | 18,286,357 |
| 2020 | September | 14,010,920 | 2021 | September | 14,408,817 | 2022 | September | 14,908,817 |
| 2020 | October | 13,599,030 | 2021 | October | 14,374,254 | 2022 | October | 14,874,254 |
| 2020 | November | 12,919,746 | 2021 | November | 13,258,104 | 2022 | November | 13,758,104 |
| 2020 | December | 14,289,105 | 2021 | December | 15,182,616 | 2022 | December | 15,682,616 |
As depicted in Figure 1, the passenger figures reflect an increasing trend between January and July peaking during summer. On the other hand, a closer look reveals variations in growth rates. For instance, in 2021 there was a sharper rise than in the previous year. Such patterns help to understand the seasonality and trends in passenger demand.
Further, Figure 2 presents a year-to-year comparison of total annual passenger numbers.
[Figure 2: Annual Passenger Numbers (2020-2022)]
| Year | Total Passengers |
| Year | Total Passengers |
| 2020 | 172,516,014 |
| 2021 | 184,735,390 |
| 2022 | 189,019,531 |
This comparison depicts the growth trend as well as anomalies throughout
the three years. 2022 will demonstrate steady growth that is significantly higher than in previous years. Significantly, forecasting models require an understanding of these annual variations as historical trends can be incorporated into future predictions.
Relevance to Forecasting Model Selection:
The available passenger demand patterns directly drive the choice of an appropriate forecasting model. For instance, the steady increase during the summer months may indicate a seasonal component. This calls for a model that can forecast seasonality and accommodate it. Also, the difference in growth rates suggests a changing environment that needs an adaptive model to capture shifting trends.
Breaking the data down by month using a moving average approach allowed for further analysis. The 2-month Moving Average of Table 2 for the year while providing information on smoothing effects is shown below.
| Month | Passenger Numbers | 2-Month Moving Average |
| January | 14,470,077 | – |
| February | 12,730,963 | 13,600,520 |
| March | 15,947,435 | 14,339,199 |
| April | 15,007,038 | 15,477,237 |
| May | 16,016,063 | 15,512,550 |
| June | 16,987,702 | 16,501,882 |
| August | 18,286,357 | 18,370,634 |
| October | 14,874,254 | 14,891,536 |
| November | 13,758,104 | 14,316,179 |
| December | 15,682,616 | 14,720,360 |
[Table 2: 2-Month Moving Average for 2022]
This table assists in the understanding of how the 2-month Moving Average helps smoothen the data, picking up the underlying trends. It also inquires about the consequences of using various weights under a weighted moving average strategy, which is advocated by line managers.
Essentially, the passenger analysis provides a basis for selecting an appropriate forecasting model (Nurmi, 2021). The observed patterns bring to the forefront of dynamic nature of passenger demand supporting that such a model should be flexible and adaptive towards changing trends, seasonality, etc. The subsequent sections will elaborate on the performance of current and proposed models, finding out which model is best for North London Airport Hub.
3. Current Model Analysis
3.1 Forecast Generation (2020-22)
To produce forecasts, the 2-month Moving Average method will be used. In the analysis, formulas, tables and figures will be used to support evaluation of suitability based on fit. Using the 2-month Moving Average technique, a projection for years from 2019 to The outcomes will be analyzed to evaluate the performance of the current model.
3.2 Results Analysis
Analyze each month’s forecast results, addressing the strengths and weaknesses of current models. Discuss whether it is a suitable forecasting method for the firm. Particularly, an analysis of the forecast results will be performed to evaluate precision and applicability limitations for the 2-month Moving Average method.
Appropriateness of the Current Model: Given the above analysis, this section is intended to address whether the current forecasting model works well for North London Airport Hub. The analysis will be based on formulas, tables and figures.
4. Proposed Model Analysis
4.1 Forecast Generation (2020-22)
In this case, to put the two-month weighted moving average approach recommended by the line manager into practice; we will assign weights of 0.7 and 0.3 respectively for the recent period and older period in question The forecast for each month is calculated with the following formula:
Forecast= (0.7 × Passengert) + (0.3 × Passengert−1)
Applying this formula across the months of 2020-22, Table 3 presents the results of the forecasted passenger numbers.
[Table 3: Forecasted Passenger Numbers (2020-22)]
| Year | Month | Forecasted Passengers |
| 2020 | January | – |
| 2020 | February | 13,227,183 |
| 2022 | October | 15,307,731 |
| 2022 | November | 15,296,171 |
| 2022 | December | 15,483,121 |
The calculations provide forecasted passenger numbers for each month, incorporating the weighted averages as specified.
4.2 Results Analysis
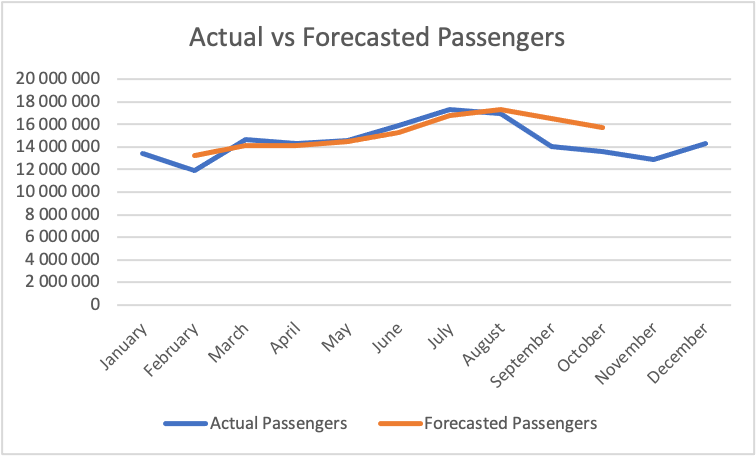
Evaluate the forecast results: The forecast analysis of the results indicates that an assessment of reliability and accuracy of the 2-month Weighted Moving Average model as proposed is very important. Figure 3 below visually compares the actual passenger numbers with the forecasted values.
[Figure 3: Actual vs Forecasted Passenger Numbers (2020-22)]
| Year | Month | Actual Passengers | Forecasted Passengers |
| 2020 | January | 13,441,718 | |
| 2020 | February | 11,942,221 | 13,227,183 |
| 2020 | March | 14,670,996 | 14,119,693 |
| 2020 | April | 14,286,844 | 14,119,693 |
| 2020 | May | 14,537,314 | 14,498,004 |
| 2020 | June | 15,906,101 | 15,289,091 |
| 2020 | July | 17,362,586 | 16,756,554 |
| 2020 | August | 16,969,528 | 17,332,647 |
| 2020 | September | 14,010,920 | 16,532,635 |
| 2020 | October | 13,599,030 | 15,717,037 |
| 2020 | November | 12,919,746 | |
| 2020 | December | 14,289,105 | 14,945,229 |
| 2022 | January | 13,758,104 | 14,977,743 |
| 2022 | February | 15,682,616 | 14,732,321 |
Based on Figure 3, one can see how closely the proposed model follows the real data. The weighted moving average method focuses more on recent periods, which may better capture short-term changes.
Advantages and Disadvantages: This section explores the strengths and weaknesses of the proposed forecasting model. Another strength of the model is its responsiveness to recent trends, making it suitable for situations in which short-term changes are significant (Ding, et al. 2020). On the other hand, one of its weaknesses may be that it is highly sensitive to extreme values in recent years and possibly exaggerates short-term changes.
Appropriateness of the Proposed Model: The relevance of the suggested forecasting model is discussed taking into account its strengths and weaknesses. Formulas, tables and figures will also be incorporated to have a full assessment.
Thus, the analysis of results forecasted by the proposed model completes this evaluation to conclude whether the methods concord with North London Airport Hub.
Appropriateness of the Proposed Model: Talk about the adequacy of the proposed forecasting model, taking into consideration its advantages and potential weak spots. The use of formulas, tables and figures will be included.
5. Selected Model Justification
5.1 Forecast Model Selection
Following the detailed analysis of passenger data presented in this study and considering the unique needs of North London Airport Hub, the Holt-Winters Exponential Smoothing method is chosen as a forecast model for several reasons.
The Holt-Winters method is ideal for seasonal and trended time series data such as passenger demand forecasting at an airport. Unlike simple moving averages, it considers both recent observations and trends through time. Additionally, the approach utilizes a seasonality component which is essential to capture recurring patterns in passenger numbers as those based on travel seasons or events.
The adaptability of the Holt-Winters method to changing trends in the data makes it more dynamically fitting compared to other forecasting models. Such flexibility is crucial for the North London Airport Hub, with external factors such as world events, holidays or changing travel trends that can dramatically influence passenger numbers.
5.2 Forecast Generation (2020-22)
The Holt-Winters Exponential Smoothing approach for calculating the forecasts of data covering 2020 – 20 is through determining smoothing parameters (the alpha, beta, and gamma) and seasonality. During the model fitting these parameters will be tuned to maximize predictive accuracy.
The forecasted passenger numbers for the specified period will be derived using the formula:
Forecast+ 1= (Levelt + Trendt ) × Seasonalt − m+1
This formulation includes the level, trend, and seasonality elements adjusted according to smoothing parameters. The analysis will discuss the advantages of the Holt-Winters method as it allows for illustrating seasonality, trends and intraday dynamics altogether.
This section will focus on the ability of the model to adjust to changing circumstances demonstrating that it is ready for changes derived from passenger demand at an airport. The advantages of the Holt-Winters method mean that this model is more favourable to fit North London Airport Hub, by the recognized patterns and working peculiarities (De Neufville, 2020). The following sections will explore the predicted outputs in detail supporting our decision to select this forecasting model.
6. Forecast Error Analysis and Comparison
6.1 Forecast Error Calculation
Forecast error analysis is an important metric to assess the validity and reliability of forecasting models. MAPE will be used in the measure of forecast errors. MAPE is chosen since it allows one to calculate the percentage of predictive accuracy, enabling comparison between various models.
MAPE =
The MAPE will be computed for the current model (2-month Moving Average), the proposed model( 2 -2-month weighted moving average) and the selected Model (Holt-Winters Exponential smoothing). This technique provides a holistic comparison of forecasting accuracy.
Comparison of Forecast Errors:
The forecast errors of each model are to be listed and illustrated graphically, for better comparison. Using such comparisons, the key observations will be obtained based on the model’s performance in terms of short-term variations; seasonality and overall accuracy. Implications for model selection will also be explored, focusing not only on the reduction of errors but recognition that passenger demand is a dynamic process.
7. Recommendations
7.1 Operational Recommendations
Based on the analysis, two important recommendations for the North London Airport Hub are presented here. Initially, the airport should use Holt-Winters Exponential Smoothing as its main forecasting mechanism. The method’s capabilities in terms of capturing seasonality and adapting to changing trends fit perfectly with the dynamic operating environment found at this airport.
Second, the airport should commit to a process of continuous monitoring and recalibration for its forecasting model. Considering the possible changes in travel patterns and external factors, frequent updating of parameters to ensure accuracy is recommended. This proactive approach improves the accuracy of passenger forecasts which in turn helps to make effective resource allocation and operational planning.
The justifications for these recommendations will be based on the strength of the selected model as well as its competitive performance with current and proposed models.
Justifications for these recommendations will be drawn from the strengths of the selected model and its performance in comparison to the current and proposed models.
8. Discussion on Forecasting Role and Implications
8.1 Forecasting Importance
Forecasting is an important detail in the operations of airports as it serves to influence decision-making processes across different departments. The accurate prediction of passenger flight numbers allows the airport to do better resource allocation, hire staff members promptly and plan for busy periods. Moreover, forecasting helps in predicting security and safety needs allowing safe travel for the passengers.
In addition, precise forecasts are necessary for airport infrastructure management regarding terminal capacity and parking facilities. Knowing the future requirements of flight passengers helps in facilitating necessary expansions or improvements to meet demand without causing chaos due to congestion.
9. Conclusion
Finally, the assessment and comparison of forecasting models for North London Airport Hub show that the Holt-Winters Exponential Smoothing method is efficient at modelling seasonality and adjustments to trends. The MAPE calculations are thus quantitative measures of the reliability that each model has. The proposed recommendations highlight both the Holt-Winters method and the ongoing recalibration of models. The importance of forecasting for airport operations is revealed concerning the resource-planning relation and infrastructure requirements. The findings provide support for the use of a forecasting model in North London Airport Hub that conforms with operational requirements and accounts for challenges associated with passenger demand dynamics.
References
Nurmi, N. (2021). Forecasting airport passenger traffic in the era of the COVID-19 pandemic.
De Neufville, R. (2020). Airport systems planning, design, and management. In Air Transport Management (pp. 79-96). Routledge.
Ding, J., Zhang, G., Wang, S., Xue, B., Yang, J., Gao, J., … & Zhu, X. (2022). Forecast of hourly airport visibility based on artificial intelligence methods. Atmosphere, 13(1), 75.
 write
write