I. Introduction
The war in Ukraine and its outcomes are generating new fears of an impending global recession. Omega Enterprise, a wholesaler that has traded in lorry tires for more than 35 years, and has in recent years, been mulling over market diversification. There are two project proposals: the food and beverage industry and the clothing and apparel industry. Market diversification can be an alternative risk-reduction approach that Omega Enterprises can use to expand into a new industry and achieve higher rates of profitability. However, the company’s executives should evaluate the economic climate and sources of financing to consider the viability of the project.
Businesses thrive in stable economic climates because of a higher demand for goods and services and a lower cost of production. Typically, a stable economy is associated with higher consumer demand for products, whereas a weaker economy results in reduced consumer spending. Also, the economic environment affects the business through competition in industry because intense competition is often apparent during strong economic conditions and less during weaker economic environments.
II. Economic Climate
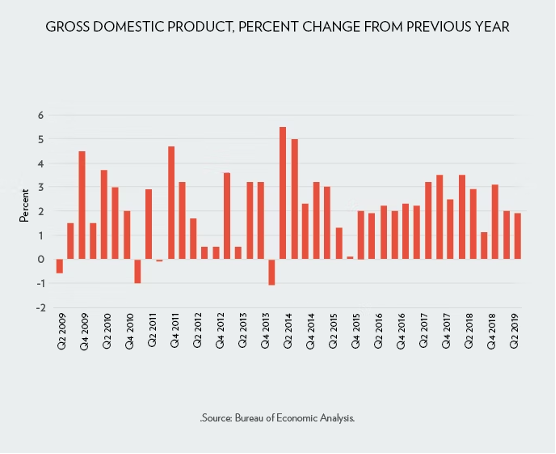
A recession refers to the slowdown of the economy. During a recession, the general economic activities of firms and households’ general dwindle. The last recession to hit the UK was caused by the Covid-19 pandemic. In Q1 and Q2 of 2020, the UK’s economy receded by 2.6 percent and 18.8 percent, respectively (Partington, 2022; Elliott, 2022). The Covid-19 pandemic contributed to severe economic disruption and extensive shortages of supplies magnified by nationwide shutdowns.
The thought of an economy entering a recession is not a positive one for firms and individuals. However, recessionary periods do not automatically have to be painful, provided that business owners can prepare for them. A recession is a period of an economic slump and is often defined as when two quarters experience negative growth when adjusted for the economy’s real national income. A recession can last for just a few months, and in certain scenarios, they make years for an economy to turn around. In the last two decades, the 2008/2009 recession was the longest one to be experienced in the UK because it lasted 5 quarters beginning with the second quarter of 2008 until the second quarter of 2009 (Allen, 2010). The business might suffer from declining profits because as the economic growth stunts, competitors and consumers become wary when it comes to spending. It means that the business might find it more difficult to generate sales, and it will be forced to cut costs to meet the things that are needed. Lenders tighten their belts during recessionary periods, and this makes it a challenge for the business to access their typical lines of credit. Subsequently, interest rates often increase during an economic slowdown, while covenants are often known to increase while the lender requirements often become stricter.
Vendors and customers can find it a challenge to make payments on time during a deep recessionary period. The business will be forced to spend more time chasing payment due, and this in essence will delay the firm’s payments to their suppliers and creditors. Such a situation might be challenging in particular for businesses that are sorely focused on business-to-business arrangements. If a customer goes under, then their bills become a bad debt (Cowling, Liu, Ledger, & Zhang, 2015). In addition, recessionary periods are associated with stock market crunch. This means that the values of companies being publicly traded often suffer a hit when a recession happens. The fall in cash flows and profits ultimately makes its way to the official financial reports of the business. Profit warnings and reduced financial performance mean reduced dividends and lower value estimates of the company.
The finance officer is justified to be concerned about the implication of trend inflation and interest rates on the business and how the war between Russia and Ukraine could impact the business. When inflation increases by a certain rate, it cause wage and raw materials price increase. In addition, inflation is related to interest rates. Credit providers often set prices on loans and funds based on the expected rate of inflation over the expected life of credit. The war between Russia and Ukraine could aggravate supply chain disruptions that suffered massively from the Covid-19 pandemic. Disruptions and rerouting of trade routes because of the war would lead to massive costs being transferred to consumers from respective point in the distribution system.
III. Sources of Finance
The major sources of capital that the company can seek to finance either of the two projects are divided into equity and debt. The decision between the two sources resolves around the potential size of opportunity, the company’s need for control and revenue. Speaking broadly, equity finance is for ideal for opportunities that have the potential for a very large exit while debt financing is for more modest opportunities. Equity is very risky for the investor and they need the potential for a ten times or greater return of their investment to justify the risks involved. Debt is less risky, and hence ideal for either of the two projects. In addition, debt does not require a huge exit to justify the investment.
The company’s need for control is also a major issue when choosing between debt and equity. When the company sells equity to finance either of the project, it will be selling ownership of the business. Equity money normally comes with board members who will represent the investors in the business. However, debt financing typically requires the business to have revenue now. Often, the re-payment of the loan is realized either monthly, yearly or at the end of a specified time frame of the loan. Monthly is the most common format for most debt. Excluding convertible notes, which is really equity financing dressed up like debt. Usually the interest is paid monthly, yearly or in one instalment at the end of the loan, however, most lenders prefer monthly payment of interest.
IV. Industry Comparisons
The industry financial ratios refer to the aggregate measure of the performance of an entire industry. In this exercise, the two industries are compared using leverage ratios, liquidity ratios, and profitability ratios. The debt-to-equity ratio for both industries demonstrates the clothing and apparel industry has a larger appetite for debt compared to the food and beverage industry (Appendix 1). In 2022, the former is nearly in as much as one and a half times in debt than its equity, while the latter’s debt was nearly on par with its equity. The business has the option to leverage on debt to help it grow its businesses. However, the enterprise also must avoid taking on too much debt and which can lead to the possibility of default.
While the clothing and apparel industry is highly leveraged compared to the food and beverage industry, the latter appears to be lightly capable of meeting its short-term obligations (Appendix 2). Theoretically, both industries have demonstrated a healthy ability to meet their short-term obligations using their current assets. However, this fails to materialize if one considers illiquid current assets with the quick ratio for the two industries being less than one for the three financial periods. It is important to note that the food and beverage industry appears to be slightly better at meeting its short-term obligations compared to the clothing and apparel industry.
The total cost of goods sold consumes a large proportion of the revenues for firms operating in the clothing industry compared to those operating in the food and beverage industry. Equally, the food and beverage industry demonstrated greater net margins and better return on assets except for the financial year 2021, when the industry reported a net loss.
V. Project Appraisal
The two projects require different initial capital investments. In addition, they are expected to generate different cash flows. Capital project appraisal informs analysts about the economic viability of projects. The techniques of appraising projects allow analysts to consider if the net cash flows generate returns that can be expected from an investment and then compared them with alternative investment projects. Essentially, the alternative investment is an opportunity for the company to forego the forecasted profits (Lavrynenko, et al., 2020). It means that if there is a choice between an investment in the food and beverage industry and an investment in the clothing and apparel industry, the best option to be selected should be one that generates the greatest return, after considering risk. Remember that risk is a broad area of analysis.
The appraisal exercise undertaken concerning the two projects is majorly considered with the evaluation of the expected costs and anticipated revenues linked to the cash inflows and outflows of each investment and over the expected life of the two projects. In this exercise, both projects are expected to last at least ten years. The expected life of the projects is the tie period that analysts consider to be relevant for the appraisal of the projects’ expected cash flows. The feasibility of the project investments is evaluated using the payback period, accounting rate of return (ARR), the net present value (NPV), and the IRR and Profitability Index (PI). These methods are associated with their strengths and weaknesses.
i. Payback Period
The payback period approach only considers the time when the initial capital invested in the business will be recouped. Under a project to invest money and resources in a business operating in the food and beverage industry, the initial capital of £ 151650 will be recouped in just under seven years and six months period, while the £56280 to be invested in a business operating in the clothing and apparel industry will be recouped in about 6 years and five months. The task in this exercise is to select which of the two possible investments results in the greater benefit. This approach simply suggests that choosing a project provides faster recouping of capital investment. Given these periods and using the Payback Period, the project on the clothing and apparel industry would be chosen. The Payback method is simple and it focuses on the speed of investment recovery, which is certainly important when looking at risks and liquidity. However, the method avoids having to forecast cash flows that extend past the date of the payback. In addition, the method ignores the time value of money, which means that the expected net cash flows during later periods in the life cycle of the project are treated the same as those that are received or spent at the earlier part of the project’s life.
ii. ARR
The ARR is the ratio of the average net cash flows generated during the life of the project divided by its initial investment. The ARR is often expressed as a percentage. Here, the decision rule is that the project with the highest average profit return is considered over those with a lower profit return. A project focusing on the food and beverage industry has an ARR of 24.1 percent, while the investment in the clothing and apparel industry will generate an ARR of 23.1 percent, which demonstrates that the latter is superior and hence based on the ARR should be selected over the latter.
iii. IRR
The IRR can be described as a rate when applied to the cash flows of a project results in a zero net present value. The decision rule is that a project should be accepted if it has a larger IRR than other projects, and when the IRR is greater than the cost of capital. An investment in a business operating in the food and beverage industry will generate an IRR of 11.6%, while one in the clothing and apparel industry will generate an IRR of 14.0%. Given the use of the IRR technique, the latter appears to be superior.
iv. NPV
The NPV is the total sum of all the expected cash flows over the life of a project and discounted using the discount rate, and then the resulting amount is summed up with the negative cash flow spent during year zero. The analyst needs to reiterate that this method measures the absolute addition of the net cash flows of the business in terms of their current values. A project with a positive NPV would be preferred and when two projects are competing the project with the largest NPV will be selected. The selection of the project with the highest NPV is ideal because it maximizes shareholder value compared to others that have lower NPV. Projects with positive NPVs generate greater returns compared to the cost of capital and hence they are generally better placed at increasing the wealth of the company. Projects with negative NPV mean that the firm is better at investing in alternative investments than subjecting their capital to such a project. Accordingly, the NPV is the appropriate measure for evaluating the impact of an investment on shareholder value. The NPV considers the time value of money as well the entire span of the project.
Using a discount rate of 6.75%, which consists of the 1.75% August 2022 Bank of England Base Rate and the 5% adjusting rate, the present values and NPV of the two projects have been presented in Appendix 4 below. In general, the company should expect an NPV of £ 64299 and £ 27838 from an investment in the food and beverage industry and one in the clothing and apparel industry, respectively. If the company has limited finance and can only be invested in either of the two projects, then according to the NPV method, the business should only invest in a project in the food and beverage industry. However, if the company can amass other cash toward the second project, then it should not be off the table, because an investment in the clothing and apparel industry would still generate a positive NPV.
VI. Conclusion
The two projects are mutually exclusive and they are competing in such a way that if the project on food and beverage is accepted then it will block the acceptance of the one on clothing and apparel. This has generated an expected situation where the NPV and the IRR conflict. The NPV may lead the company to accept the project in the food and beverage industry, while the IRR shows that the project in the clothing and apparel industry appears to provide greater viability. The conflict between the two measures can be traced to the fact that the two projects require substantially different amounts of initial capital. In addition, the conflict between the two exists because of the dissimilar cash flow timing and the patterns of Project A and Project B proposals in their expected lengths. When faced with a conflict between the two methods, a rule of thumb is to choose a project with the largest NPV. To reiterate, the objective of any capital investment is to maximize shareholder value, and the logic suggests that the best way this can be achieved is through a project with the largest NPV. Hence an investment in the food and beverage industry will exert a positive effect on the value of the business and through the principle of transitivity, the net result will be the growth in the wealth of shareholders. Besides, the NPV provides a more reliable approach compared to the IRR, and it is the better technique when ranking proposed investments that are mutually exclusive. Most analysts consider the NPV to be the best approach to be used when ranking investment projects.
References
Allen, G. (2010). Recession and recovery. Retrieved from www.parliament.uk: https://www.parliament.uk/globalassets/documents/commons/lib/research/key_issues/Key-Issues-Recession-and-recovery.pdf
Coulter, S. (2016). The UK labour market and the’great recession’.
Cowling, M., Liu, W., Ledger, A., & Zhang, N. (2015). What really happens to small and medium-sized enterprises in a global economic recession? UK evidence on sales and job dynamics. International Small Business Journal, 33(5), 488-513.
Elliott, L. (2022, December 22). UK braces for recession after recovery from pandemic weaker than thought. Retrieved from The Guardian : https://www.theguardian.com/business/2022/dec/22/uk-only-g7-member-with-economic-output-still-lower-than-pre-pandemic-level#:~:text=The%20Office%20for%20National%20Statistics,the%20third%20quarter%20of%202021.
Lavrynenko, S., Kondratenko, G., Sidenko, I., & Kondratenko, Y. (2020). Fuzzy logic approach for evaluating the effectiveness of investment projects. In 2020 IEEE 15th International Conference on Computer Sciences and Information Technologies (.
Partington, R. (2022, March 23). How has the UK economy fared in the two tumultuous years since Covid? Retrieved from The Gurdian : https://www.theguardian.com/business/2022/mar/23/how-has-the-uk-economy-fared-in-the-two-tumultuous-years-since-covid
Appendices
Appendix 1 Leverage Ratio
Appendix 2: Liquidity Ratios
Appendix 3: Profitability Ratios
Appendix 4
Table 1: Cash Flows, PV of Cash flows and Appraisal Measures
| Year | Food and Beverage | PV (Food and Beverage) | Clothing and Apparel | PV (Clothing and Apparel) |
| 0 | -151650 | -151650 | -56280 | -56280 |
| 1 | -10000 | -9368 | 5000 | 4684 |
| 2 | -5000 | -4388 | 6000 | 5265 |
| 3 | 10000 | 8220 | 7500 | 6165 |
| 4 | 20000 | 15401 | 8800 | 6777 |
| 5 | 30000 | 21641 | 11000 | 7935 |
| 6 | 35000 | 23652 | 12500 | 8447 |
| 7 | 40000 | 25321 | 15000 | 9495 |
| 8 | 65000 | 38545 | $18,000.00 | 10674 |
| 9 | 80800 | 44885 | 21000 | 11666 |
| 10 | 100000 | 52038 | 25000 | 13010 |
| NPV | £64,298.70 | £27,837.77 | ||
| IRR | 11.6% | 14.0% | ||
| Payback | 7 years and 6 months | 6 years and 5 months | ||
| ARR | 24.1% | 23.1% |
Table 2: Discount rate
| August 2022 Bank of England Base Rate | 1.75% |
| Plus 5% points | 5% |
| Discount rate | 6.75% |
 write
write