Introduction
MarineMax Incorporation is an international company established in 1998. The incorporation is located in Clearwater, Florida. The company fundamentally focuses on the sale of yachts and boats. Over the years, the company has been focusing on various services, including superyacht services. MarineMax incorporation operates in around 79 retail establishments spanning 21 states, which offer new and pre-owned recreational boats, including pleasure and fishing boats. MarineMax not only sells boats but also supports customers in securing boat financing, insurance, and extended service contracts (Chuliá, Estévez, et al., 2023, p.125). Over the years, through assessing the financial statements and ratios, MarineMax Incorporation has gained its milestone through steadfast dedication to high-quality service delivery and goods. This is attributed to a devoted team with an average of three thousand personnel (Fridson et al.,2022, p.135).
The incorporation’s ownership is critical; through its dedicated management team, the company has attained incredible financial performance over the years. BlackRock Fund Advisors are among the top investors in the company, with statistics showing a significant shareholding of 13.47%. According to the reports published on the company’s website, American Century Investment Management Incorporation has a 9.10% stake, whereas Vanguard Group acquired a stake of 6.18%. This shows that the company has sufficient capital to finance its capital-intensive operations. Notably, in the fourth quarter, the gross profit margin declined by 240 basis points, irrespective of its favorable performance over the years.
The decrease in revenue was mainly caused by reduced profitability in the sales of both new and used boats, although the favorable effect of the IGY acquisition broadly balanced this. The selling, general, and administrative expenditures increased to 28.5% of revenues, resulting in a $169.4 million rise. This was primarily due to the inclusion of IGY and other acquisitions. At the onset of the report, it is essential to state that the increase in the interest cost to $15.8 million resulted in an increase in interest rates and an increase in long-term debt experienced based on the acquisition of IGY. Regardless of these financial altercations, MarineMax incorporation completed the financial year 2023 based on its financial reports with a net income of $109.3 million. Hence, to effectively comprehend the financial position of MarineMax, this report needs to analyze the financial statements of MarineMax incorporation, such as the balance sheet, cash flows, income statements, and various ratios relevant to this report. These financial instruments assist in effective decision-making in making investments.
Problem identification/Method
Income Statement
IncMarineMax has demonstrated a dynamic financial performance over the past four years. The company achieved strong revenue growth, reaching an impressive peak of 36.67% in 2021. Nevertheless, the pace of growth slowed down in the following years, with growth rates of 11.87% in 2022 and 3.75% in 2023. Although experiencing a decrease in growth, MarineMax successfully improved its gross profit, demonstrating effective cost control and a strong business plan. The company’s capacity to sustain a solid financial performance against fluctuating market conditions is shown in the steady increase of gross profit, which rose from $398.71 million in 2020 to $835.33 million in 2023.
The gross profit shows an upward trend, and the net income provides a more intricate representation. The significant decline of 44.80% in net income in 2022 is a cause for concern regarding the company’s profitability and stability. Comprehending the elements contributing to this decrease, such as alterations in operational costs, interest, and income taxes, will be essential for MarineMax’s strategic planning. The organization should prioritize mitigating these oscillations to achieve a more consistent and enduring financial performance by balancing its aspirations for revenue development and implementing efficient cost control methods. To summarize, MarineMax’s financial statements reveal both positive aspects and difficulties, underscoring the importance of adopting a strategic approach to traverse the intricacies of the marine business effectively and sustain long-term economic well-being.
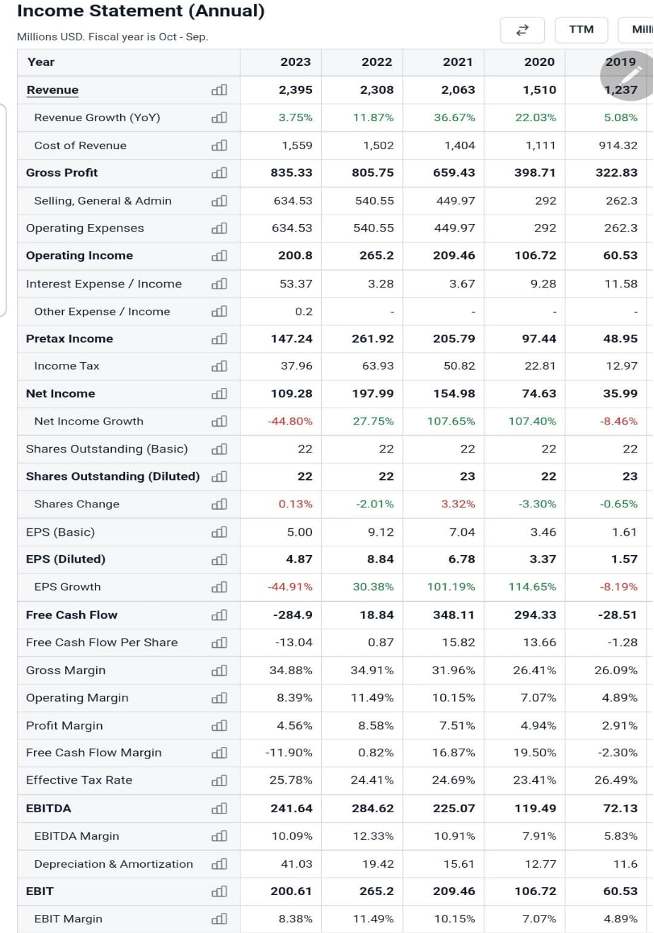
Source: https://stockanalysis.com/stocks/hzo/financials/
Balance Sheet
This section of the report conducts a comprehensive analysis of the balance sheet of MarineMax Incorporation from 2014 to 2023. The company had a critical expansion in its total assets, surging from $402.68 million in 2014 to $2.42 billion in the financial year 2023. Based on the expansion of the company’s current assets, the fundamental surge contributed immensely to a rise in receivables and inventories. The incorporation’s adeptness in efficiently overseeing assets that are in existence, including cash flows, has demonstrated its practical working capital management and ability to meet its short-term obligations significantly. It is essential to state that over the financial years between 2014 and 2023, the rise in long-term assets, particularly the properties, equipment, and goodwill, indicates the company’s significant investment in infrastructure, which can enable the company to attain a long-term competitive advantage in the global markets.
MarineMax incorporation has critically increased its liabilities by 20,23, which were there.50 billion. Short-term and long-term rises in debt acquisition triggered the increased risk in its liabilities. However, the incorporation has deployed an effective debt management strategy that facilitates financial growth, as evidenced by the total debt. It is fundamental to look into the debt-equity and financial soundness of MarineMax. The shareholders’ equity has exhibited constant growth, which signifies the ability of the company to deliver favorable returns for its owners over the years. The negative net cash position of MarineMax from the company’s financial reports indicated that the incorporation had depended heavily on external financing to meet its financial obligations and expansion efforts. In summary of this section of balance sheet analysis, it is critical to state that the company’s balance sheet reveals that it possesses a robust collection of assets and has made significant investments over the years. However, it is essential to emphasize having effective and responsible debt management criteria to maintain the company’s liquidity.
It is important to state that the book value per share over the years has risen, reflecting an upward trajectory in the inherent value of each share. This has critically contributed to the incorporation’s financial health and value of the shares. The working capital has exhibited a favorable trajectory, indicating the company’s capacity to meet immediate financial obligations using its existing assets. A negative net cash position suggests a dependence on external funding, emphasizing the importance of closely monitoring cash flow and debt levels. Investors and stakeholders should carefully analyze MarineMax’s balance sheet dynamics, examining both the assets and liabilities, to thoroughly comprehend the company’s financial position and capacity to handle the difficulties and possibilities in the marine industry.
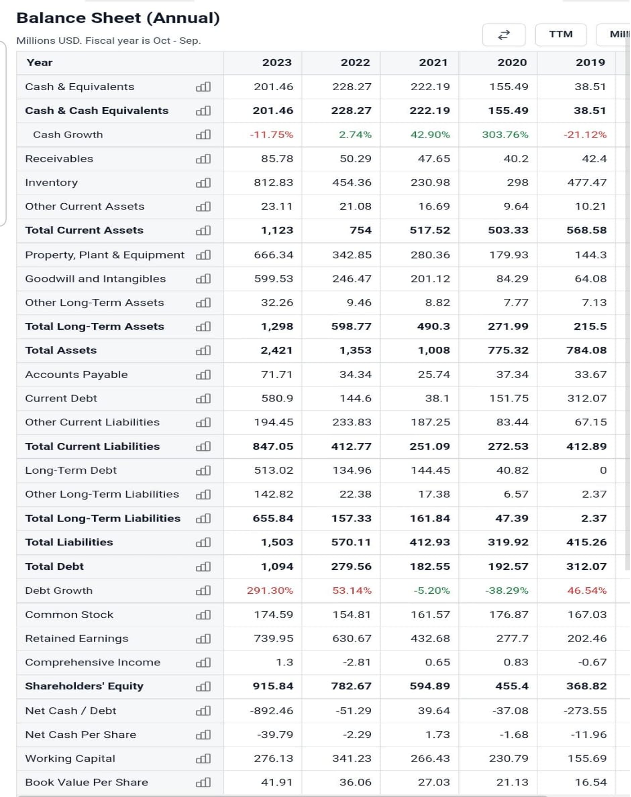
Source https://stockanalysis.com/stocks/hzo/financials/
Statement of Cash Flows Status
The statement of cash flow status grants vital insights into the company’s financial performance. It highlights its capacity to establish and handle cash flows in and out of the company. The operating cash flow, often regarded as OCF, is a significant metric that analyzes MarineMax’s capability to generate cash through its crucial business activities. In the financial year 2023, the company’s operating cash flow accumulated to a deficit of $ 222.24 million, a decline compared to the positive $76.6 million recorded in the last financial year. This indicates a critical decrease in the incorporation capacity to earn cash through daily activities.
This gave a reduction of 79.51% in OCF growth. The drop can be ascribed to a significant adverse effect from other operational activities, suggesting probable difficulties in the company’s routine business operations. Examining the investment operations, the net cash flow in 2023 amounted to -$576.37 million, indicating a significant rise compared to the previous year’s -$140.45 million. The decline in investing cash flow suggests increased expenditure on acquisitions and other investment endeavors, potentially extending the company’s assets and market share. The declining pattern in cash flow from investments is consistent with a broader capital investment plan, which may result in long-term advantages but has immediate consequences for cash liquidity.
In terms of financing, the net cash flow from financing activities in 2023 amounted to $770.4 million, representing a substantial enhancement compared to the previous year’s $73.06 million. The company’s successful endeavors in raising cash through debt and equity issuance are reflected in this favorable growth. The significant debt, amounting to $779.44 million, issued in 2023, was pivotal in funding the company’s activities and strategic endeavors. The company’s net cash flow of 2023 was at $26.82 million, which gives a critical indication of the positive net cash flow experienced in 2022, which was at $6.08 million. The substantial decline in free cash flow in 2023, which significantly decreased by -284.9 million as opposed to 2022, which was at -18.84 million, emphasizes the need to handle operational and investments-connected cash flow complexities. This assists in achieving financial stability (Kalmenovitz, Lowry, and Volkova, 2022, pp.88-99).
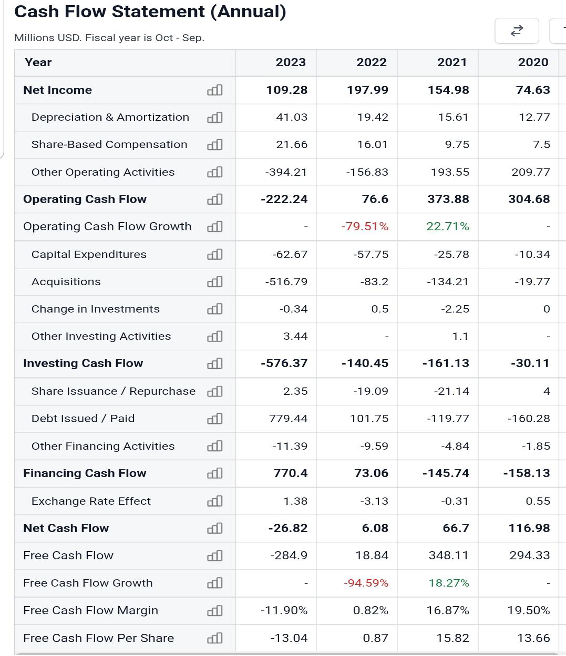
Source https://www.macrotrends.net/stocks/charts/HZO/marinemax/cash-flow-statement
Critical discussion
The net cash flow for 2023 is -$26.82 million, which means that cash and other liquid assets went down. People may be worried about the company’s negative free cash flow and net cash flow. Still, it’s important to remember that the company made intelligent investments and acquisitions during the fiscal year (Hollie, Nicholls, and Zhao, 2011, p.765). The company is ready to invest in acquisitions and debt issues to improve its position in the market and take advantage of growth opportunities. It is critical for incorporation to disclose its financial reports as needed by the international jurisdictions (Perkovich,2020, p.54). Free cash flow margin and free cash flow per share are also usually negative in businesses that need to spend much capital, like the recreational boat sector (Jihadi, Vilantika, et al.,2021, p.139).
The ratio of debt to equity
Debt/Equity Ratio = Total Debt / Shareholders’ Equity.
$1,094 million / $915.84 million = 1.19
From this calculation, if MarineMax’s Debt/Equity Ratio is 1.19, the company has more debt than equity. This shows a higher level of financial leverage. However, to acquire accurate results, it’s essential to compare this ratio to the averages for the field.
Limitations
This ratio shows what percentage of a company’s money comes from loans and what percentage comes from equity. A higher ratio means the money is being borrowed more, which can increase profits and risk. However, the number might differ in different industries, and some companies tend to have more debt.
Debt/EBITDA Ratio
Debt/EBITDA Ratio = Total Debt / EBITDA.
$1,094 million / $241.64 million = 4.53
A Debt/EBITDA Ratio of 4.53 means that the company owes more money than it makes in earnings. There is a moderate amount of financial danger here, but looking at industry standards for a complete picture is essential.
Limitation
This ratio determines if a company can pay back its debt by looking at its revenue before interest, taxes, depreciation, and amortization. There is more financial risk when the ratio is more considerable. It doesn’t look at when the debt is due, though, and a complete analysis should include the company’s cash flow and debt maturity timetable.
Debt/FCF Ratio
Debt/FCF Ratio = Total Debt / Free Cash Flow
$1,094 million / -$284.9 million = -3.84
The company’s free cash flow is insufficient to pay its total debt, as shown by the negative Debt/FCF Ratio. It makes people worry about the company’s ability to make money to pay off its debts.
Limitation
A skewed number can happen if the free cash flow is negative. In this case, the negative ratio means that free cash flow is insufficient to pay off the loan. This ratio should be carefully interpreted and used with other financial measures to understand better how healthy the company’s finances are.
Quick Ratio
Quick Ratio = (Current Assets – Inventory) / Current Liabilities
($1,123 million – $812.83 million) / $847.05 million = 0.34
Limitations
A quick ratio below one could mean there are liquidity problems, but it doesn’t look at the quality of the assets. It might not work for industries that need different amounts of operating capital.
Current Ratio
Asset Turnover = Revenue / Average Total Assets
$2.39 billion / (($2,421 million + $1,353 million) / 2) = 1.04
MarineMax makes $1.04 in sales for every dollar of average total assets, according to an Asset Turnover of 1.04. It means that the assets are being used efficiently.
Limitation
Like the quick ratio, the current ratio gives a general picture of liquidity but might not show how quickly assets can be turned into cash. Different types of businesses may have different ranges for this ratio that are okay.
Market Capitalization Growth
Market Cap Growth = ((Current Market Cap – Previous Market Cap) / Previous Market Cap) * 100
(2023): (($793 million – $719 million) / $719 million) * 100 = 12.10%
A Market Cap Growth of 12.10% shows that the market is becoming more positive about the company. But it’s important to look at this along with other financial measures.
Limitation
The mood of the market affects the growth of market capitalization, and short-term changes may not accurately show how well a company is doing in the long run. It’s essential to look at other business indicators and trends in the industry.
Liquidity ratio (current assets/current liabilities)
MarineMax’s current ratio of 1.33 indicates a very sound short-term financial situation, which is determined by dividing total existing assets by current liabilities for the quarter ending in September 2023. If the company’s current ratio exceeds 1, it has enough assets to pay its short-term debts and adequate liquidity (Kliestik, Valaskova et al.,2020, p.76). The company has consistently kept its current ratio within a very constant range over the last ten years, as evidenced by the historical data, which shows a median of 1.73, a maximum of 2.06, and a lowest of 1.33.
The Return on Sales (ROS) ratio
By dividing operating income by net sales or revenue, one can determine MarineMax’s operating efficiency using the Return on Sales (ROS) ratio. MarineMax’s return on equity (ROS) for the quarter that ends in September 2023 is 5.77%. It means the company makes about $0.0577 in operating income for every dollar of revenue. Although a positive return on investment (ROS) is typically desirable, a thorough evaluation must consider historical trends and industry benchmarks. MarineMax’s ROS, in this instance, points to a respectable operational efficiency.
Impact of culture on employee attitude and behavior
Employees behavior is a big part of a company as it affects how employees think and act. It also affects the atmosphere and helps people feel like they fit in and have an identity. In the bigger picture, organizational culture shapes workers’ values, norms, and expectations. According to Ricci, 2019, p. 175, when a company creates a positive and welcoming atmosphere, workers are likely to be engaged, committed, and satisfied with their jobs. For example, a workplace that promotes open communication, teamwork, and mutual respect will likely have happier workers, making for a more productive and peaceful. Thus reducing employees turnover rate (Kvam, Molnár et al.,2022 p.64)
Conclusion
MarineMax recently earned a 12.60% return on equity (ROE) and return on assets (ROA), which shows that the company is making good use of shareholder equity and assets to make money. However, the return on capital (ROIC) went down slightly to 7.42%, which suggests that it might be challenging to keep the current level of capital efficiency. Marinemax acquired IGY, which was a strategic move. This was based on the fact that MarineMax’s focus is on premium boating and watches. This strategic move enhanced MarineMax’s global markets and positioned the corporation to significantly capitalize on the exceedingly growing demand for sophisticated yacht experiences globally.
Looking at ROE and ROA over time, you can see that they have been going in the same direction. This means the business is still making money and using its assets efficiently. Still, changes in ROIC show that capital is being used more or less efficiently over time. From the ratios analysis, it is essential to state that a high ROE and ROA were detected in 2021 and 2022. This showed that the incorporation generated enough finances using its resources more effectively. Financial statistics and statements are critical. This is based on the fact that they show how well MarineMax is performing and how much disposal finances it has. Distinct parts of a corporation’s finances can be judged by assessing its ratios. The trajectories on the ratios, from 2014 to the financial year 2023, have indeed shown incredible financial management by MarineMax incorporation. It is fundamental, as it has enabled the company to stay within the competitive edge over the years. The company has also focused on employee motivation, which has helped in reducing employee turnover rates.
Moreover, the company’s income statement often shows how well the business is performing, whereas the balance sheets, as discussed in the report, show how cash flows are in the industry. It assists in making the right investment decisions and getting the most of the capital invested. Cumulatively, these financial. Tools help leaders evaluate the company’s performance and develop long-term plans to achieve a competitive edge. MarineMax, Inc.’s economic research shows that the recreational boats and yachts market is changing and growing. The business has been very profitable, smart acquisitions have been made, and it is prominent in the market. However, during the fourth quarter of fiscal 2023, problems such as a decline in net income, increased borrowing or loan percentage, and reduced profit margins must be carefully considered (Stulz, Rene 2018, pp.3-27). The Income statement and balance sheet also portray the impact of acquisitions, especially IGY, on critical financial ratios. Furthermore, it is essential to state that understanding how culture affects people when a company changes is even more critical (Vogt, Stephen 2014, p.21).
Change efforts are often met with resistance, and a company’s culture can either help people change or get in the way of progress. When a company has a strong and flexible culture, employees are more likely to welcome change and see it as a chance to grow rather than a problem (Kalmenovitz, Lowry, 2022; Volkova, p.621). Employees may be skeptical, afraid, or unwilling to change in a company that doesn’t like it, making it harder to implement new strategies or processes. Hence, this report on the financial analysis provides a roadmap for understanding financial performance and management through assessing the cash flows, assets, and liabilities of the incorporation. Leaders of organizations need to understand how culture affects how employees feel during times of change and work to create a culture that values creativity, adaptability, and constant improvement.
References
Chuliá, H., Estévez, M. and Uribe, J.M. (2023) ‘Systemic political risk,’ Economic Modelling, 125, p. 106375. https://doi.org/10.1016/j.econmod.2023.106375.
Fridson, M.S. and Alvarez, F., 2022. Financial statement analysis: a practitioner’s guide. John Wiley & Sons p.889. https://books.google.com/books?hl=en&lr=&id=2cl6EAAAQBAJ&oi=fnd&pg=PA25&dq=financial+analysis+ratios+interpretation&ots=5YHzJp7GC1&sig=nwD6xLV4CkMUwRR9FZHWiLpoe-I.
Gray, D.L. (2020) ‘Are operating lease costs sticky for retail firms? ‘ Advances in management accounting, pp. 75–100. https://doi.org/10.1108/s1474-787120200000032003.
Greaves, S.R. (2021) Why Poland’s yacht builders are among world leaders. https://www.ceeol.com/search/article-detail?id=1063366.
Hollie, D., Nicholls, C. and Zhao, Q. (2011) ‘Effects of cash flow statement reclassifications under the SEC’s one-time allowance,’ Journal of Accounting and Public Policy, 30(6), pp. 570–588. https://doi.org/10.1016/j.jaccpubpol.2011.04.003.
Husain, T., & Sarwani, S. N., & Lisdawati.(2020). Firm’s Value Prediction Based on Profitability Ratios and Dividend Policy. Finance & Economics Review, 2(2), 13-26. https://core.ac.uk/download/pdf/480403817.pdf
Jihadi, M., Vilantika, E., Hashemi, S.M., Arifin, Z., Bachtiar, Y. and Sholichah, F., 2021. The effect of liquidity, leverage, and profitability on firm value: Empirical evidence from Indonesia. Journal of Asian Finance, Economics and Business, 8(3), pp.423-431. https://eprints.umm.ac.id/88934/3/Peer%20Review%20-%20Jihadi%20-%20Financial%20Ratio%20Corporate%20Social%20Responsibility%20Firm%20Value%20Firm%20Size.pdf
Kalmenovitz, J., Lowry, M. and Volkova, E. (2021) ‘The government agenda and the effects of regulatory dispersion,’ Social Science Research Network [Preprint]. https://doi.org/10.2139/ssrn.3802888.
Klieštik, T. et al. (2020) ‘Remaining financially healthy and competitive: The role of Financial Predictors,’ Journal of Competitiveness, 12(1), pp. 74–92. https://doi.org/10.7441/joc.2020.01.05.
Kvam, E., Molnár, P., Wankel, I., & Ødegaard, B. A. (2022). Do sustainable company stock prices increase with ESG scrutiny? Evidence using social media–Internet Appendix. https://ba-odegaard.no/wps/2022_esg_us_paper/esg_appendix_2022_09.pdf
McFarland, J.M., 2006. Good News Investors: You’ve Got a Financial Expert on the Board. The Bad News: It Doesn’t Mean Anything. Hastings Bus. L.J., 2, p.165. https://heinonline.org/hol-cgi-bin/get_pdf.cgi?handle=hein.journals/hbuslj2§ion=8
Palepu, K.G., Healy, P.M., Wright, S., Bradbury, M. and Coulton, J., 2020. Business analysis and valuation: Using financial statements. Cengage AU.ks.google.com/books?hl=en&lr=&id=IDT6DwAAQBAJ&oi=fnd&pg=PR13&dq=Palepu,+K.G.,+Healy,+P.M.,+Wright,+S.,+Bradbury,+M.+and+Coulton,+J.,+2020.+Business+analysis+and+valuation:+Using+financial+statements.+Cengage+AU.&ots=uKan80od9V&sig=iAUnJY96DZiSJ3l1NpS_IW9z12s.
Perkovich, J., 2020. The International Aspect of ESI Production. eDiscovery for Corporate Counsel.https://papers.ssrn.com/sol3/papers.cfm?abstract_id=3722024
Ricci, C.W., 2019. Detecting Earnings Management via Financial Ratios in U.S. Small-Cap Corporations. International Research Journal of Applied Finance, 10(9), pp.232-242.https://search.proquest.com/openview/cbbd2b4c1aac08bb94f9e1d8c22135eb/1.pdf?pq-origsite=gscholar&cbl=2046325
Smith, B 2010, Introductory Financial Accounting and Reporting, McGraw-Hill Education, Maide ProQuest Ebook Central. [January 8th, 2024]. Created from UNICAF on 2024-01-08 13:25:38.
Shrestha, A., 2021. Application of machine learning algorithm to measure a firm’s performance. https://osuva.uwasa.fi/handle/10024/12896. Application of machine learning algorithm to measure a firm’s performance.
Stulz, Rene M. 2018. “Managerial Discretion and Optimal Financing Policies.”
Journal of Financial Economics 26:1, 3–27.
Vogt, Stephen C. 2014. “The Cash-Flow/Investment Relationship: Evidence from U.S. Manufacturing Firms.” Financial Management 23:2, 3–20.
Widagdo, B., Jihadi, M., Bachitar, Y., Safitri, O.E. and Singh, S.K., 2020. Financial Ratio, Macro Economy, and Investment Risk on Sharia Stock Return. The Journal of Asian Finance, Economics and Business, 7(12), pp.919-926.
 write
write