Introduction
Apple Inc. is an American cosmopolitan corporation that provides premium hypermedia service as well as selling tools for the design and development of consumer goods. The corporation was founded in 1976 and it is headquartered in California. The corporation offers customer gadgets including as the iPhone, iPad, and iPod, as well as MacBook and premium hypermedia services such as iTunes. Apple Inc is listed on NASDAQ with the ticker ‘AAPL’. The primary purpose of this article is to provide an outline of financial success of Apple Inc, this became nonetheless good news for creative market goods. As a result, getting a realistic perspective on the corporation’s economic numbers and assessing the good inventory efficiency depends on ratio value and preferences of consumers is fascinating (Aigbedo, 2021).
Financial Ratio
Financial ratios are often employed to provide statistical justifications of assets or subdivisions of accounting records. Such accounting information experiences have helped company internal administrators, lenders and operators to evaluate how well a business functions and where improvements are required (Chen et al., 2018). In this section, we conduct Apple Inc.’s financial statement analysis using the ratio analysis approach, whereby the corporation’s current financial output pattern is described by employing various Profitability ratios, ratio segments, Solvency, Efficiency, and Liquidity.
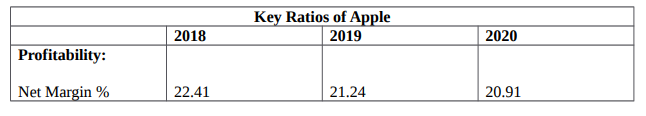
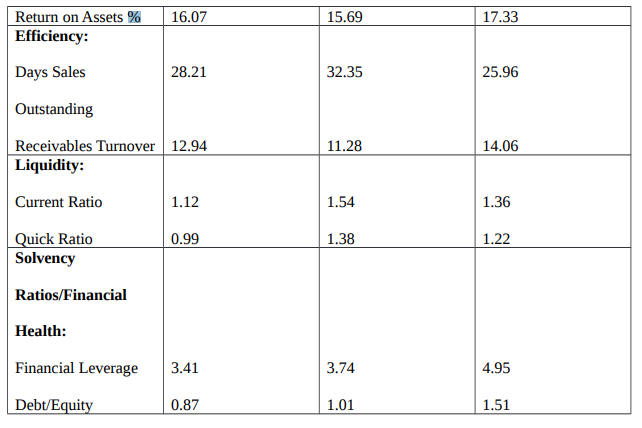
Table 1: shows Comparison of Financial Performance over Time (Zhao et al., 2019).
Profitability
Net Profit Margin %
The net profit margin shows the amount the company is earning from the wholes sales. When the net profit margin is higher, it shows that the corporation is converting income into actual profits in an efficient manner. The net profit margin isn’t similar to the profit margin’s gross margin. Such figures shows that the corporation retained a solid ratio in the years, 22.41 (2017), 21.24 (2018), but it fell to 20.91 in 2020. Between 2019-2020, the corporation was inefficient at translating sales into actual profit (Gullett et al., 2018).
Return on Assets %
The ROA metric informs investors about the efficiency with which the corporation converts money into net profit. The higher the return on assets, the better, because smaller investments yield more revenue. As a result, overall assets are recalled to be the sum of equity and total liabilities. The ROA of Apple ROA was 16.0, 15.69, and 17.33 in 2018, 2019, and 2020 respectively. The corporation’s earnings have been greater in 2018 and 2020 despite lesser investments. In 2019, the ROA fell a little to 15.69 (Magwizi, 2020).
Efficiency
Days Sales Outstanding (DSO)
A large number of DSOs imply that a company offers its items to customers on credits, which might take longer to generate revenues. An extended period of time amid when a business sells and when it receives payment might cause cash flow issues. The DSO of DSO was; 28.21, 32.35, 25.96 in 2018, 2019, 2020 respectively. It demonstrates that the corporation was selling its products on credit to clients in 2019 and also taking longer to recover funds (NAGAR & MURAD, 2021).
Receivables Turnover
A higher turnover in receivables shows that an organization is receiving receivables properly with a good number of higher-quality consumers who are paying their obligations promptly. A higher receivables turnover ratio reflects the financial operation. Based on this data, Apple showed a higher Receivables Turnover in 2020 (14.06), showing that the firm went more on a cash basis in 2020 than in 2018 (12.94) and 2019. (11.28) (Pastorella, 2020).
Liquidity
Current Ratio
The current liquidity ratio determines if the corporation is willing to provide sufficient capital to achieve its short-term obligations. The current ratio indicates how a company’s overall assets compare to its current liabilities. It is said in the following manner. The current ratio that is lesser compared to the industry norm might show higher risks of default or trouble. The current Ratio of Apple was 1.12, 1.54, and 1.36 in 2018, 2019, 2020 respectively. In 2019, the company has more resources to pay its short-term complications than in 2018 and 2020. Nevertheless, the difference has been little over the years (Wild, 2019).
Quick Ratio
The quick ratio indicates that a corporation is willing to pay down its present liabilities without the need of selling or getting fresh funds. The higher ratio shows how stronger an enterprise’s liquidity and health; the lower ratio, shows the likelihood it is going to struggle when repaying debts. Apple’s Quick ratio is seen to improve in 2019 (1.38) and 2020 (1.22) than in 2018. (0.99). It demonstrates that Apple strived harder in 2018 when it came to debt repayment.
Solvency Ratios/Financial Health
Financial Leverage
A higher level of financial leverage implies that, although the company levers vary only slightly, profitability is going to vary considerably. Higher leverage can frequently lead to higher inventory price flexibility due to better company volatility in sales/earnings. The table depicts that the corporation’s ratio in 2020 (4.95) is higher compared to that in 2018 (3.41) and 2019. (3.74). It suggests that the corporation’s revenue is going to be more volatile in 2020 (Zhao et al., 2019).
Debt-to-Equity
A higher debt to equity ratio is associated with higher risks; it indicates that a corporation fiercely subsidized its debt increase. Suppose a large portion of this debt is utilized to fund growth, the corporation may generate more revenue compared to what it will have else. Having a Debt-to-Equity ratio of 0.87, the corporation indicates that it has been aggressive in funding its expansion with debt in 2018. Nevertheless, in 2019 and 2020, the company’s ratio has enhanced.
Financial concerns that have affected the corporation
Apple has long been a ticking time bomb, gradually rising and producing an ever-increasing diversity of earnings. It simply isn’t. The Silicon Valley behemoth announced on Tuesday that its net profits had dropped by 13% in the previous year, despite advances in services and wearable gadgets. The findings revealed strong indicators of weakening for one of the country’s financial strengths. Apple has built a massive iPhone company; however, the revenues of these devices have plunged in a congested device market for 3 quarters in a row. These findings indicated that the corporation may begin to avoid deterioration in sales and other key areas, like auctions from the Chinese economy. The earnings and sales of Apple have plunged across the board in the last two quarters.
Clearly, the company has been going over a period of diminishing revenues on iPhones,” stated by Luca Maestra. “However, our technical road maps are really favorable, we are very optimistic concerning the future,” Apple replied by reporting that net profits fell from $11.50 billion a year earlier to $10.04 billion in the third quarter, while earning $2.18 billion more than Wall Street projected. Revenue climbed to $53.8 billion from $53.3 billion the previous year. Mr. Maestri stated that earnings fell as revenue climbed due to lower foreign currency margins, which he cited.
Conclusion
Since Apple has a number of items to launch or release in the near future, stock performance will undoubtedly be determined by the long-term feasibility of these stocks and whether they are as best as the corporation’s past services. Investing in the corporation’s equity is therefore excellent exclusively for development purchasers, as the stock is expected to steadily increase above the industrial level and not be subject to short-term tides. As a result, the stock is only suitable for growth investors seeking capital gains in their long-term portfolio.
Recommendation
It is advised that the trend toward substantial R&D investments go on because it is a critical success factor for the company – keeping it one step ahead of its competitors. Furthermore, the program gives third-party retailers with songs, e-books in exchange for helping Apple’s products succeed. The services is kept running as well. Furthermore, the company might recompense for the negative consequences of lower stock turnover by increasing its product promotion and marketing operations.
References
Aigbedo, H. (2021). An empirical analysis of the effect of financial performance on environmental performance of companies in global supply chains. Journal of Cleaner Production, 278, 121741.
Chen, C. C., Huang, H. H., Shiue, Y. T., & Chen, H. H. (2018, December). Numeral understanding in financial tweets for fine-grained crowd-based forecasting. In 2018 IEEE/WIC/ACM International Conference on Web Intelligence (WI) (pp. 136-143). IEEE.
Gullett, N. S., Kilgore, R. W., & Geddie, M. F. (2018). Use of financial ratios to measure the quality of earnings. Academy of Accounting and Financial Studies Journal, 22(2), 1-12.
Magwizi, C. N. (2020). An investigation of operational management in the organization, on the example of the Apple Computer, Inc (Master’s thesis, Тернопільський національний технічний університет імені Івана Пулюя).
NAGAR, S., & MURAD, M. U. (2021). FINANCIAL ANALYSIS OF VOLTAS AND BLUE STAR.
Pastorella, G. (2020). The Apple ecosystem: from the commoditisation of advanced hardware towards a services oriented industry.
Wild, J. (2019). Financial Accounting: Information for Decisions, 9e.
Zhao, H., Anong, S. T., & Zhang, L. (2019). Understanding the impact of financial incentives on NFC mobile payment adoption: An experimental analysis. International Journal of Bank Marketing.
 write
write