Introduction
Human and natural sources contribute to the release of carbon dioxide. Respiration, decomposition, and ocean discharge are some examples of natural sources. Burning fossil fuels like coal, oil, and natural gas is an everyday human activity, as is making cement. Both are toxic, but whereas emissions from natural sources sink back into the earth, those from human activity stay in the atmosphere because they have nowhere else to go. This forces a dangerous range and throws the CO2 levels out of equilibrium (Friedrich & Damassa, 2014). Despite the fact that there are several sources of CO2 emissions back into the atmosphere, human causes account for the majority of these emissions.
Background of the Research
According to the flat global CO2 emissions in 2015 and 2016, the trend of CO2 emissions is now rising. The drop in coal use in various regions, including China, the United States, and Europe, is the cause of the flat worldwide CO2 emissions in 2015 and 2016. Additionally, several nations worldwide are developing renewable energy sources like solar and wind power to replace natural gas in power plants (Friedrich & Damassa, 2014). The patterns in primary energy consumption and energy mix are to blame for the rising trend in CO2 emissions in 2017.
Since CO2 emissions are the primary source of the greenhouse effects that result in global warming, tracking CO2 emissions is crucial to understanding a country’s development. Applying technology to renewable energy to replace fossil fuels would reduce CO2 emissions, which will be beneficial to every nation (Friedrich & Damassa, 2014). Additionally, it contributes to lessening global warming’s detrimental effects on the environment, human health, and economic growth. Additionally, several entities, not just one, are required to reduce CO2 emissions. Therefore, creating policies and rules for commercial firms to abide by is vital in this circumstance, and it is the government’s job. The most contentious policy concerns affecting the global economy of low-, middle- and high-income countries are those related to environmental safety, efficiency, and improvement (Friedrich & Damassa, 2014).
According to academics, gross national income and CO2 emissions are closely associated. Carbon dioxide is more significant in high-income nations like the U.S.A., China, and others than in low-income nations (Friedrich & Damassa, 2014). Due to the widespread use of conventional energy sources by several companies in high-income nations to support their production processes, the demand for fossil fuels is considerable.
Purpose of the Research
The most significant greenhouse gas automobiles produce carbon dioxide (CO2). Methane and nitrous oxide are two other gases that vehicles create. However, the number of emissions in cars varies. The amount of gasoline a vehicle can burn and its fuel type affect CO2 emissions(Ibikunle & Gregoriou, 2018). Over the past few years, Australian road transportation has experienced substantial growth. Due to this expansion, more fuel-consuming vehicles are now on the road, which has subsequently led to a rise in CO2 generation from the sector. Emissions from transportation increased by 3.4% in 2017 alone and around 63% since 1990 (Ibikunle & Gregoriou, 2018). Thus, the problem has been becoming worse and worse. Vehicle traffic has increased as a result of population expansion. Likewise, more than 80% of Australians commute to work by automobile. High emissions from vehicles have also been caused by increased shipping demand.
Scope and objectives
The increasing threat of global warming brought on by greenhouse gas emissions is something the world is battling to manage. As a result, the sea level increases, temperatures rise, precipitation varies, and extreme weather conditions continue (Ibikunle & Gregoriou, 2018). Due to their effects on food, water, air, and weather, these changes endanger human health. One of the most significant contributors to this threat is the transportation industry. Therefore, the research aims to analyze the C.O. emissions worldwide and recommend ways to get ahead of the situation.
Literature Review
Friedrich & Damascus (2014) claim that between 1850 and 1960, the industrialization age, there was a rapid rise in global emissions. China and other developing Asian nations have emerged as the leading CO2 emitters, replacing developed nations, which held that position until the early 2000s. Despite stabilizing, emissions in the United States and other western nations are still high. From the 1990s to 2011, Asia’s economy grew rapidly. As a result, the area has risen to the position of top CO2 emitter and now produces more than half of all CO2 emissions worldwide.
Olthoff & Christensen (2018) note that it is anticipated that global CO2 emissions will set a record in 2018 and continue to rise in 2019. The increase is attributable to the number of automobiles on the road and the comeback of coal consumption. The Global Carbon Project anticipated that CO2 emissions would increase by 2.7% in 2018 compared to the 1.6% increase observed in 2017. Nearly every nation is to blame for the growth, claims the research. With an increase of 4.7%, China now leads the world in emissions, followed by India (6.3%), the U.S. (2.5%), and the E.U., which had almost flat growth.
The United Nations began raising awareness about the need for a global effort from all countries to combat the epidemic as it became clear that the earth was in danger due to carbon emissions. The United Nations made its first attempt to unite nations in May 1992 when it persuaded them to join the “United Nations Framework Convention on Climate Change” (UNFCCC), which went into effect in March 1994 after being ratified by a sizable number of nations. Stabilizing the atmosphere’s greenhouse gas concentration was its primary goal (Ibikunle & Gregoriou, 2018). However, this pact proved ineffective because it imposed no-strings-attached emission caps on nations and lacked enforcement measures.
Nations ratified the “Kyoto Protocol” on December 11, 1997, in Kyoto, Japan, in an effort to increase compliance. The Kyoto Protocol, which replaced the previous accord and established legally enforceable carbon reduction goals at the global level, went into effect on February 16, 2005 (Kitidis et al., 2019). In December 2015, the most recent deal, “the Paris Agreement,” was adopted in Paris as part of the Paris Climate Conference. It outlines a global action plan meant to help the earth avoid the disastrous impacts of climate change. This is the first universal, legally binding international climate treaty, and it has been ratified by 195 nations (Kitidis et al., 2019). The accord seeks to cut the upper limit on global warming to 1.5°C with additional reductions.
According to I.T.F., one of the biggest producers of CO2 and black carbon is the transportation sector. Around 25% of global CO2 emissions are attributed to the sector. Commercial freight and passengers are the two main sectors of the global transportation business. Due to increased global commerce and the diversity of value chains for the majority of products, commercial freight is growing quickly (Kitidis et al., 2019). Most of the passenger market is made up of urban travel, where commuters take short-distance but frequent excursions and long-distance journeys by ship, road, train, and air.
I.T.F. continued to claim that if transportation sector emissions are not reduced, they will be by 60% by the year 2050. From around 110,000 billion ton-kilometers to 330,000 billion ton-kilometers, the need for freight transportation is predicted to treble (Olhoff, 2018). The demand for passenger transportation, on the other hand, is anticipated to rise from roughly 50,000 billion passenger kilometers to 120,000 billion by the year 2050. The number of motor vehicles is also anticipated to rise from 1 billion in 2015 to 2.5 billion by 2020 (Olhoff, 2018).
Moreover, given that most means of transportation use oil-based fuels, the likelihood of increased CO2 and black carbon emissions grows as this industry continues to grow. According to I.T.F., the global oil consumption by the transportation sector is 65 % (Olhoff, 2018). Forty per cent of the CO2 emissions from the transport sector are attributed to the freight sector. A third or so of the emissions in this group are primarily from maritime traffic. Rail and highway traffic are to blame for the remaining pollutants. In emerging nations with inadequate rail infrastructure, the growth of road transportation is remarkably rapid. In the transportation sector, the passenger segment is responsible for 60% of emissions (Olhoff, 2018). Urban transport is responsible for around half of the emissions in this sector. Only 16% of emissions from passenger transport are caused by air travel. Passenger traffic on the sea produces very little emissions.
Methodology
Data
Data was collected from 235 countries around the world, and the observations of CO2 emissions were recorded from 1980 to 2019. The data showed the sum of C02 emissions per country from 1980 t0 2019. In addition, data was collected on energy types worldwide and how they have contributed to CO2 emissions over the years. These types of energy include; coal, natural gas, nuclear, petroleum, and renewables. These data were also collected from the year 1980 to 2019. The dataset was made available on Kaggle.com. It presents 55441 Rows and columns A to K (11 columns), and the entries present information on each country’s energy production and consumption, population, G.D.P., and CO2 emission from 1980 to 2019.
Tools Used
When conducting the research, we used a few tools that helped us analyze our collected data. These tools include; Tabulation, Excel, R, and Python. Data visualization helps data analytics by presenting data in a graphical way that makes it simple to understand and evaluate the data. Tableau is a program that makes it possible for even average users to visualize data to understand it. It does this by providing simple-to-use features and the capacity to display data visually using maps and graphs.
Excel has several built-in functions that may be coupled with user-defined equations in cells. Actual numbers are introduced into user-defined equations very infrequently, if ever. In most cases, equations relate to the cell addresses of the data-holding cells. Make an effort to structure spreadsheets such that data flows consistently from top left to bottom right. Users’ comprehension of how spreadsheets work will be much more simplified. User clarity and understanding are both improved by a good flow.
Analysis
Increased pavement softening and expansion from higher temperatures can result in rutting and potholes, which put stress on the joints of bridges. Construction is hampered by heat waves, particularly in places with high humidity levels. Road construction and upkeep may become more expensive (Shurpali, Agarwal & Srivastava, 2019). Frequent heavy rains might cause floods, which would delay traffic and obstruct building work. Climate change can also concentrate rain into stronger storms that seriously harm the nation’s transportation infrastructure. For instance, in Vermont, Tropical Storm Irene in 2011 destroyed nearly 2,000 roads, 200 miles of rail, and 1,000 culverts and caused the closure of 200 bridges (Shurpali, Agarwal & Srivastava, 2019).
According to E.P.A., ice roads may only form in places like Alaska when it is below freezing. Warming temperatures may shorten the time these roads are open, restricting travel to these areas since the tundra beneath the roadways is vulnerable to damage from routine vehicle use. Many cars also overheat in high temperatures, which has the added effect of hastening tire deterioration (Shurpali, Agarwal & Srivastava, 2019). Additionally, hot weather causes the rail lines to expand and buckle, which, if left unattended, can result in expensive derailments. Rail transportation may be disrupted and delayed if there is a lot of rain. As an illustration, in 2018, the Midwest experienced severe flooding that resulted in the daylong shutdown of east-west train routes.
Aircraft performance is impacted by prolonged periods of severe heat, which can result in flight delays or cancellations and limits on cargo. There may be delays in air travel due to increased rains and floods. During storms, entire airports may have to be closed. Airports around the Northeast and the Gulf Coast, respectively, were shuttered for days during Hurricanes Sandy and Hurricane Katrina (Shurpali, Agarwal & Srivastava, 2019). Climate change is likely to make these occurrences more often, which will make the airline industry experience more annoyance. According to the E.P.A., airport facilities, especially airstrips, are also harmed by floods. Airports closer to the water are more susceptible to storm surges and flooding. Rising temperatures similarly impact airports in permafrost regions like Alaska. Warmer temperatures will cause the permafrost to thaw, which might cause damage to the airports’ buildings and foundations (Shaheen & Lipman, 2007).
The depth of a canal and the presence of sea ice are only two of the numerous elements that ships take into account while planning their journeys. Climate change may impact these elements; for instance, many underwater bridges have less clearance due to rising sea levels (Shaheen & Lipman, 2007). Due to a drop in water levels and the resulting narrowing of channels, such as in the Great Lakes region, ships may also be subject to weight limits in inland waterways. Flooding can cause shipping channels to close, and increased silt from heavy precipitation can result in a pile of debris that makes channels shallower and less accessible. Extreme storms, such as hurricanes, cause coastal infrastructure, especially harbor facilities, to be destroyed (Shaheen & Lipman, 2007). For instance, Hurricane Katrina caused significant boat damage. One of the most exposed regions is the Gulf Coast, home to seven of the largest ports in the country.
Transport sector stakeholders are working to transition away from energy sources dependent on oil and toward greener energy sources. This concept is starting to gain traction among large international corporations. For instance, Maersk, the most enormous shipping corporation in the world, declared in 2018 that it will become carbon-neutral by the year 2050 (Shaheen & Lipman, 2007). Developed nations are pushing more and more drivers and freight operators to utilize more efficient vehicles, such as electric cars. Countries including Canada, Japan, the U.S.A., and China have established efficiency criteria, particularly for freight vehicles, to promote this changeover. Along with other nations, the E.U., South Korea, Mexico, and Brazil are contemplating emission rules.
Electric vehicles and trucks that run on batteries or hydrogen fuel cells are becoming more and more common among automakers. Mercedes-Benz will begin producing electric trucks in 2021, while Tesla, the leading manufacturer of electric automobiles, has begun making electric semi-trucks (Delasalle & Erdenesanaa, 2019). Large truck fleet users are adopting the new electric vehicles in their operations; Anheuser-Busch, for instance, just acquired 800 Nikolas hydrogen-powered trucks.
In order to increase fuel economy, the shipping industry has enacted strict air pollution standards. These rules contributed to a 30% rise in fuel economy between 2008 and 2015. Additionally, new ships must adhere to efficiency requirements set out by the International Maritime Organization. The cost of fuel-saving initiatives is also rising for airlines. Additionally, electric aircraft and ships for shorter distances are planned (Delasalle & Erdenesanaa, 2019. Electric and hybrid ferries emit 95% less CO2 and are already in use in certain nations, including Norway, Taiwan, and Finland. However, given that long-haul shipping and aviation are significant sources of CO2 emissions, there is a need for ongoing innovation in battery technology.
It was discovered that the railway sector is leading other industry sectors in the usage of greener sources of energy. However, when it comes to moving freight, this means of transportation is underused (Delasalle & Erdenesanaa, 2019). For instance, in the United States, compared to vehicles, which move 40% of the goods but are responsible for 60% of emissions, trains transport just 32% of the cargo but produce only 6% of the greenhouse gases (Delasalle & Erdenesanaa, 2019). However, businesses are switching from using trucks to trains. For instance, the U.K.’s Tesco store is now shipping the majority of its goods by rail to save driving 26 million miles on trucks annually. The corporation claims that the action has reduced fuel use by almost 16 million gallons.
China overtook the United States as the world’s greatest CO2 emitter as a result of its exploding transportation industry and brisk urbanization. A dramatic initiative for renewable energy has also been started in China recently. However, as globalization continues, developing economies invest a little bit more in their logic of mass consumerism. In light of this, they will be substantially accountable for increased GHG emissions in the years to come. According to one research, China’s infamously deadly air pollution causes the lives of 1.6 million people annually (4,400 per day), or 17% of all fatalities in the nation. This is due to the country’s export-oriented economic boom, fueled mostly by burning coal. Another research estimated that two-thirds of all fatalities were caused by air pollution, which also reduced life expectancy in China by an average of more than two years and as much as 5.5 years in the country’s north.
Forest destruction is encouraged by globalization. The greenhouse effect is caused by deforestation, which is a significant yet indirect contributor. The amount of CO2 plants converts to oxygen decreases by clearing and logging. The amount of CO2 in the atmosphere will grow in an identical amount as a result, which strengthens the greenhouse effect. A significant amount of CO2 is released when the cleared wood is burned.
The development of a nation’s economy is significantly influenced by its energy supply. The urbanization factor needs to catch up when there are requests for energy utilization. Over 50% of the world’s population now lives in urban areas as a result of the worldwide phenomenon of urbanization. Urbanization is a trend that is rising steadily and quickly in emerging countries. Since urbanization is uncontrollable and cannot be prevented by legislation, no one is restricted from moving from one location to another. In emerging nations, urbanization is anticipated to account for around 65% of global urbanization by 2050. According to a number of empirical research, urbanization influences carbon dioxide emissions in both developed and developing countries. People relocate to cities in pursuit of employment prospects. For example, the number of automobiles in those cities will rise due to urbanization, which will impact the environment in those nations. Along with global warming, Pakistan’s usage of fossil fuels significantly increases carbon emissions. Industries also have a role in this; those located in Pakistani urban areas’ communities frequently burn fuels that have adverse environmental effects.
When it comes to the environmental expenses associated with urban crowding, vehicular traffic, congestion, and industrial pollutants in these metropolitan regions have all contributed to astronomically high prices. There has been a notable rise in Pakistan’s urban population since the country was created in 1948. Along with having a detrimental impact on sanitation, energy, education, law and order, and other areas, the rapid urbanization of Pakistan has also created a significant environmental degradation concern. In Pakistan, urbanization had increased dramatically since 1951, when 17.6% of the population resided in urban areas. This is also due to Pakistan’s rapid population growth, which has elevated it to the fifth-most populous country in the world with a 2% yearly growth rate.
It is challenging to make any judgments about how income levels and CO2 emissions are related. After a country has undergone essential industrialization, there appears to be little correlation between per capita income increase and CO2 emissions rise. Industrialization in South Korea has been accelerating. They must use more fossil fuels, particularly coal and oil, as a result of this region’s industrialization. In the past ten years, CO2 emissions and energy consumption have increased at comparable rates to G.D.P. Due to the increased usage of coal as a result of this region’s industrialization, the country’s CO2 emissions have worsened.
Already, there are significant environmental issues in this area of the world. Since so much coal is burnt, the air quality is infamously poor. The fact that South Korea only has roughly 16% of the population of the United States but is steadily increasing in terms of per capita income is another factor contributing to the rise in CO2 emissions. More things that enhance total energy consumption are available for purchase by the general public. Additionally, they have money to spend on things that save energy. Additionally, it indicates that people with incomes are high enough to purchase automobiles with poor emissions.
The amount of carbon emissions in the U.S. has been stable overall. Higher fuel economy regulations, energy efficiency promoted by high oil prices, and the conversion of coal-fired power plants to natural gas have all contributed to the U.S. taking the lead globally in lowering carbon emissions since 2006. One strategy to try to restrict the rise of carbon emissions is to add surcharges (taxes) to encourage conservation and promote the development of low-carbon substitutes. Certainly, the United States has adequate per capita money to cover these levies or move to low-energy items to cut CO2 emissions. In contrast to South or North Korea, the United States has access to hybrid automobiles, high-efficiency, low-energy appliances, and other alternatives to harmful products with emissions.
Over time, North Korea appears to be significantly lowering its emissions. They could not be as industrialized as the U.S. or South Korea, which could explain this. Their income has reduced over the years. Therefore they are unable to purchase items with high energy requirements and harmful emissions. They make enough money to cover essentials like food and housing. Therefore, as a result of having less money to spend on energy, their overall emissions will be substantially lower. To be able to pay for it, they must make savings. No energy can be wasted. The North Korean economy might be very different from the American one. Regarding the energy they can generate or import, as well as the policies in place to cut emissions, South Korea is a leader in the region. Even if they might impose a hefty tax on emissions, they cannot afford to pay the taxes since most people do not earn a lot of money. Less energy and emissions follow from that.
Graphs
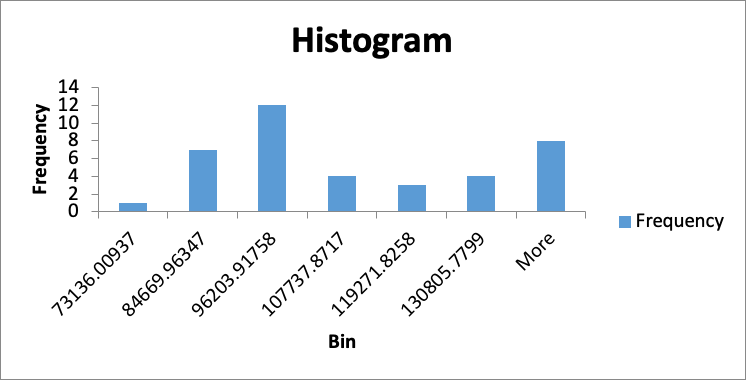
The graph looks identical on both sides of this point in a symmetric data set because the mean, median, and mode are all the same. This graph is referred to be right-skewed or positive-skewed if its tail seems to be dragged to the right. Adding additional numbers close to the distribution’s maximum may make it look like the graph is being pulled to the right. This pushes more firmly on the mean than on the median or mode. Left-skewed or negative-skewed describes a graph that seems to be dragged to the left. By adding additional values close to the distribution’s minimum, which lowers the mean value more sharply than it lowers the median or mode, we may appear to drag the graph to the left. The portion of a probability distribution furthest from the mean is called the tail, According to the histogram, the frequencies fluctuate from bin to bin. The highest frequency is recorded under 96203.97, followed by more.
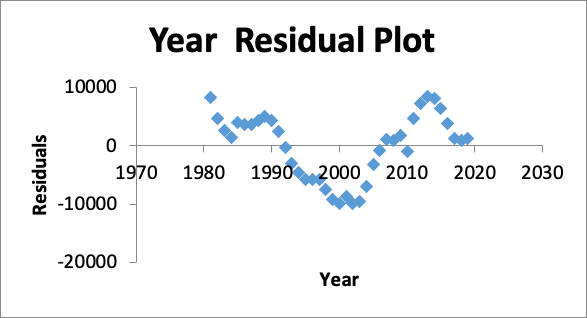
The independent variable is shown on the horizontal axis, and the residuals are shown on the vertical axis in a scatterplot called a residual plot. Residual plots enable us to assess the suitability of a linear model for the provided data. The expected value is derived using a linear model, such as a line of best fit, and the residual is the “leftover” value after subtracting the anticipated value from the actual value. A residual plot demonstrates how the data points stray from the model. A linear model effectively approximates the data points without preferring any particular inputs if the residuals are randomly distributed around the residual = 0. We conclude that a linear model is suitable in this situation. A linear model captures the trend of certain data points’ residuals better than that of other data points, if the residuals have a curved pattern. A model other than a linear model should be taken into consideration in such a situation.
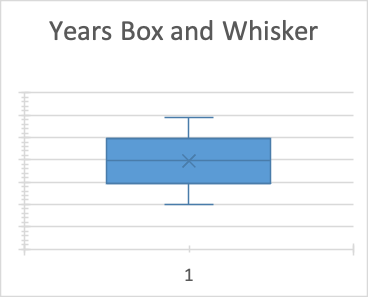
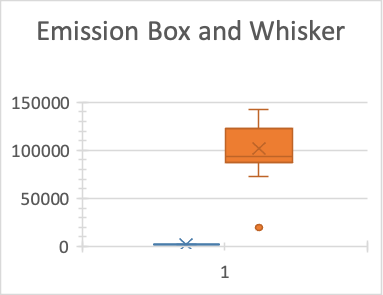
A modified box and whisker plot limits the whisker length to a maximum of 1.5 times the interquartile range. In other words, the whisker reaches the number that is the farthest from the center while remaining within a range that is 1.5 times the interquartile range from either the lower or higher quartile. Data points on the graph that fall outside of this range are shown as points and are thought to be possible outliers. The left and right sides of the box represent the lower and higher quartiles. Fifty per cent of the data are included within the interquartile range, which is covered by the box. The median may be found along the vertical line that divided the box in half. A dot or a cross on the box plot may occasionally serve as an additional indicator of the mean.
Conclusion
Today, the threat that climate change poses to human populations all over the world is all but unanimously accepted. Assuming that human activity has accelerated climate change and that its impacts will typically have a negative influence on civilizations throughout the world, it is vital to talk about how mankind can best battle climate change in an effort to maintain the status quo of the environment. One well-known suggestion is the implementation of a “Green Revolution,” which calls for the development of a new “Clean Energy System” and other conservation initiatives in order to stabilize emissions. According to estimated emission patterns, the tipping point where environmental cycles will accelerate beyond human control will be reached in 2056, indicating that prompt action must be made prior to that time. Existing technology would be used in the Green Revolution plans, and whole industries would be created. However, the Green Revolution is doomed to failure because of social and economic issues brought on by the time restriction.
Theoretically, a decrease in CO2 emissions in the industrialized world might stabilize emissions and prevent the levels of greenhouse gases that are unacceptable, as proponents of the Green Revolution have demonstrated. As Socolow and Pacala demonstrate, taking action in a number of spheres of life might lessen the suffering experienced by any one sector while still advancing efforts to stop the continuous production of greenhouse gases. In addition to perhaps reducing CO2 emissions, this approach does it in a way that preserves the quality of the environment.
CO2 emissions, deforestation, and biodiversity loss are some of the environmental harms that emerging nation’s experience. They adhere to the “Race to the Bottom” theory, according to which open to trade and investment nations adopt laxer environmental restrictions out of concern about losing their competitiveness. They worry that their expenses will increase due to local regulations and that they would become less competitive with businesses outside. They issue a warning about lost sales, jobs, and investments to overseas rivals. In order to exert political pressure on their governments to reduce the weight of regulation, local manufacturers frequently raise the alarm about their country’s lack of competitiveness.
Globalization encourages CO2 emissions connected to business and consumer activity. Industrial activity was boosted by the expansion of cross-border trade and investment. In many cases, such as when producing electricity, which still primarily entails burning coal, oil, and derivatives, this is a significant source of greenhouse gas (GHG) emissions. Developed nations were the top polluters in the world for decades. Emerging nations are now big GHG emitters as a result of their extremely fast development over the past several years. Globalization, which promoted the industrialization of the Asian superpowers sometimes at the price of the environment, was primarily responsible for these nations’ development. Every week, China installs a new coal-fired power plant to slake its energy need.
The demand for vehicles will drive up carbon emissions unless the transportation sector takes steps to reduce them. If oil-based energy is still used by the vehicles, the predicted increases in freight and passenger transportation from 50,000 billion to 120,000 billion-passenger kilometers and 110,000 billion to 330,000 billion kilometers will have a negative impact on the environment. These increases will also result in an increase in the number of airplanes and large ships. In order to reduce carbon emissions across all industries, numerous organizations, nations, and the entire world are taking action. One effective method for lowering carbon emissions is carbon trading. Credits and permits to emit CO2 are purchased and sold in carbon trading. The majority of the participants in this commerce are E.U. member states, but other nations, particularly those in the Americas, have also started participating in it.
References
Friedrich, J., & Damassa, T. (2014). The history of carbon dioxide emissions.
Ibikunle, G., & Gregoriou, A. (2018). Carbon markets: microstructure, pricing and policy. Springer.
Kiedis, V., Shutler, J. D., Ashton, I., Warren, M., Brown, I., Findlay, H., … & Nightingale, P. D. (2019). Winter weather controls the net influx of atmospheric CO2 on the north-west European shelf. Scientific Reports, 9(1), 1-11.
Olhoff, A., & Christensen, J. M. (2018). Emissions gap report 2018. UNEP DTU Partnership: Copenhagen, Denmark.
Olthoff, A. (2018). & Christensen, JM (2018). Emissions Gap Report.
Shurpali, N., Agarwal, A. K., & Srivastava, V. K. (Eds.). (2019). Greenhouse gas emissions: Challenges, technologies and solutions. Singapore: Springer.
Shaheen, S. A., & Lipman, T. E. (2007). Reducing greenhouse emissions and fuel consumption: Sustainable approaches for surface transportation. IATSS Research, 31(1), 6-20.
Delasalle, F., & Erdenesanaa, D. (2019). Planes, Trains and (Big) Automobiles: How Heavy Transport Can Reduce Emissions and Save Money.
 write
write