The dataset for the COVID-19 comorbidities in Georgia, US, is a data frame that comprises 254018 observations and 6 features. The 6 variables include “comorbidity,” “sex,” “ethnicity,” “race,” “case,” and “death.” The “comorbidity” feature depicts the COVID-19-associated medical complications in the patients. Also, the “sex,” “ethnicity,” and “race” variables represent the gender, ethnical, and racial profiles of the patients. Furthermore, the “case” feature is a binary variable that records whether or not the patient presents with COVID-19. Finally, death is a binary indicator variable that takes one if death occurred and 0 if not. Only the “case” and “death” variables are numeric (of integer datatype); the rest have character datatype. It is hypothesized that the susceptibility to COVID-19 depends on the patient’s gender, race, and ethnicity. Moreover, the Infection Fatality Rate (IFR) in Georgia is assumed not to be statistically different from the hypothesized national population rate of 0.042 during the same period.
Data Pre-Processing and Methodology
The data had no missing value. Based on the nature of the data, all the features ought to be categorical. The features with character datatype were, as such, converted to factors. The “comorbidity” and “case” variables were dropped from the data frame since they had one unique value, which would not have been of any use in the analysis of the data because it has zero variance (Brownlee, 2020). The “comorbidity” variable had a value of “Any Chronic Condition,” and the case had a value of 1, depicting positive cases. The values for the other categorical variables were also checked. The “sex” variable has the values of “Female,” “Male,” and “Unknown.” In contrast, the values for the “ethnicity” feature comprised “Hispanic/ Latino,” “Non-Hispanic/ Latino,” and the “Unknown” values. Also, the “race” variable” encompassed such values as the “African-American/ Black,” “American Indian/ Alaska Native,” “Asia,” “Native Hawaiian/ Pacific Islander,” and the “Other.” Finally, the “death” feature, which is the target variable in the dataset, had two possible values: 1 for the occurrence of death, and 0 for no end. After dropping the “comorbidity” and “case” variables, which were of no use in the analysis of the data since they had zero variance, the resultant data frame with four columns (“sex,” “ethnicity,” “race,” and “death”) was clean and ready for analysis.
The final dataset represented the COVID-19 positive cases in Georgia, US, with comorbidity of “any chronic condition.” This observation implies all the instances in the dataset are COVID-19 positive and present with “any chronic condition” comorbidity. The number of deaths was established by determining the data frame length with death equal to zero. Next, the descriptive statistics of the data were carried out to determine the frequencies of the values in each categorical variable. Also, to determine whether the susceptibility to COVID-19 is dependent on the patient’s gender, race, and ethnicity, a simple linear regression was carried out on the data. The correlation matrix of the variables reinforced the results of the linear analysis. The researcher also did various visualizations to establish the interrelationship between the multiple variables. Finally, the researcher conducted a prop.test () or binom.test () to establish the Infection Fatality Rate (IFR) in Georgia is statistically different from the hypothesized national population rate of 0.042 during the same period.
Data Analysis and Results
Out of 254,018 positive cases, 11,360 deaths occurred. For the “sex” variable, the males, females, and unknown gender were 141,779, 111,885, and 354, respectively. The males were the majority while persons with unknown gender the minority. Also, the “Hispanic/ Latino,” “Non-Hispanic/ Latino,” and persons with “Unknown” ethnicity were 22,996, 210, 968, and 20,054, respectively. The non-Hispanic/Latinos are the majority, while the Hispanic/Latinos are the minority. Racially, the Whites at 134, 232 are the majority, while the American Indian/ Alaska Native are the minority at 176. The African-American/ Black at 91113 and the Native Hawaiian/ Pacific Islander at 291 are the second most and least populous, respectively. The “Other,” “Unknown,” and “Asians” are 13233, 10733, and 4240, respectively. The death value has minimum and maximum values of 0 and 1, respectively.
The results of the regression analysis are summarized in Table 1 below. From the table, it is evident that not all categorical values can be used to explain the susceptibility of persons to COVID-19. Only those categorical values with a p-value of less than 0.05 are significant and can be used to explain the vulnerability of persons to COVID-19. These categorical values include the male gender, the White, Asian, Other, and Unknown races, and the non-Hispanic/ Latino and unknown ethnicity. This observation implies people who are more likely to succumb to COVID-19 are male, from the White/Asian/Other races, and non-Hispanic/ Latino and unknown ethnicities. This observation aligns with Mostafa et al.’s (2021) findings, where the researchers established that more Whites died from COVID-19 in Georgia than African Americans/Blacks. In contrast, females and positive patients with unknown gender of the American Indian/ Alaska Native and Native Hawaiian/ Pacific Islander racial stock are less likely to succumb to COVID-19 since these variable values have a p-value of more than 0.05. These results are reinforced by the correlation of the variables, as shown in Figure 1 below.
Table 1
Linear Regression Analysis Results
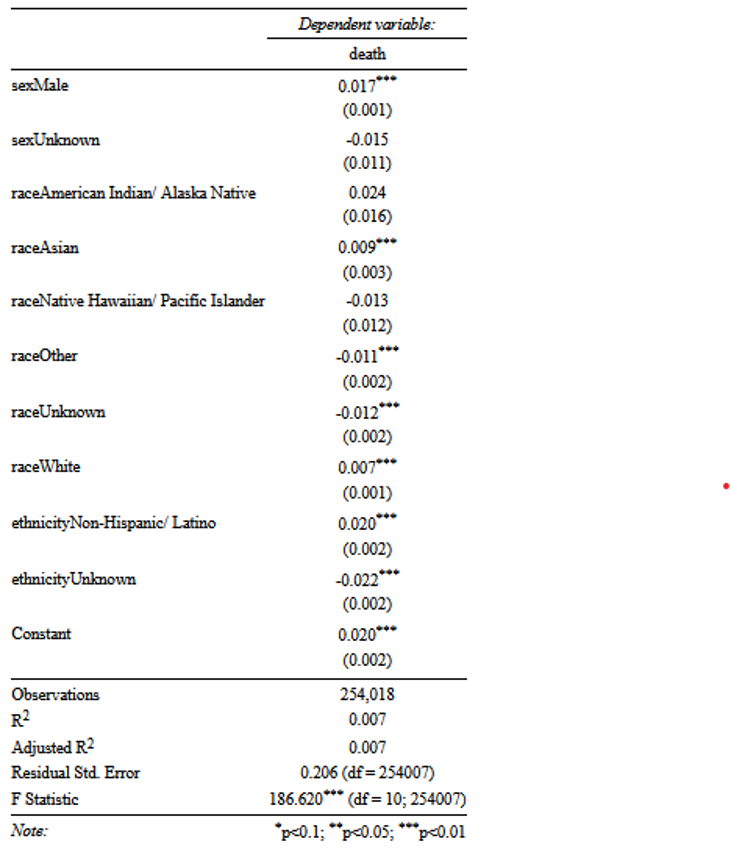
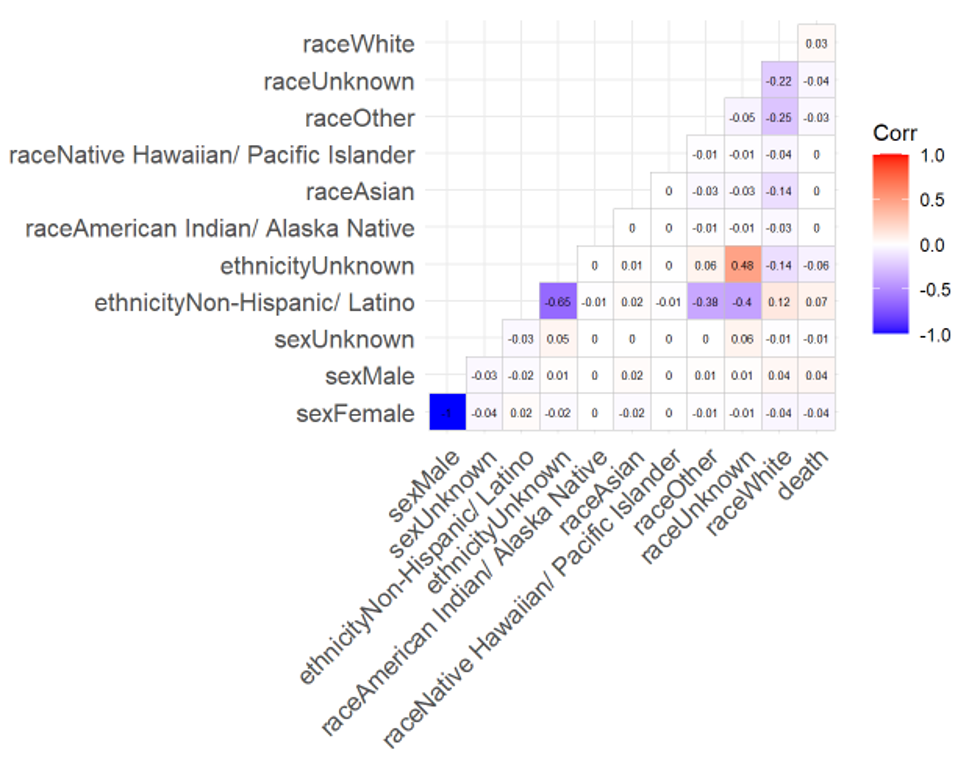
Fig. 1. Correlation matrix for the categorical variables
Although weak, some positive correlation exists between the White race, non-Hispanic/ Latino ethnicities, and the male gender with the dependent variable. This observation implies that White males from non-Hispanic/ Latino ethnicities are more susceptible to COVID-19. Also, a weak negative correlation exists between other/unknown races, unknown ethnicity, and female and unknown gender with the dependent variable. This observation also implies females and persons of unknown gender with unknown ethnicity and from other/unknown races are less likely to succumb to COVID-19. No correlation is, however, observed between the dependent variable and persons from the Asian, American Indian/ Alaska Native, and Native Hawaiian/ Pacific Islander races. This observation implies no association between these racial groups and susceptibility to COVID-19.
The following data visualizations show the distribution of patients based on gender, ethnicity, and race. The visualizations also show deaths based on gender, ethnicity, and race. For instance, Figure 2 below shows the racial distribution of patients based on gender.
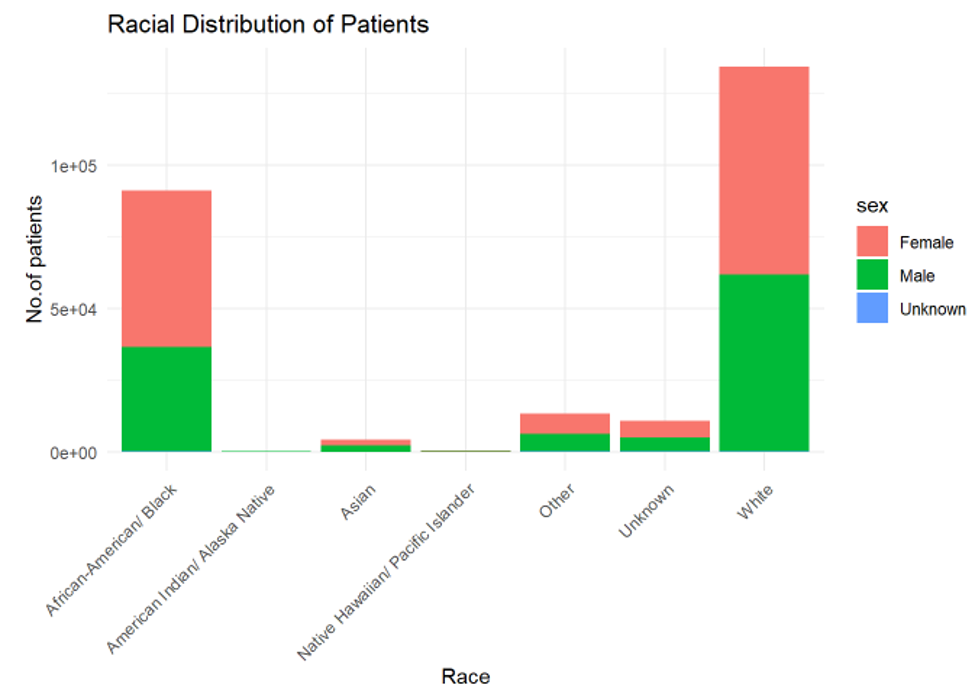
Fig. 2. Racial distribution of patients
From Figure 2 above, Whites comprised most of the positive COVID-19 cases in Georgia, US, followed by African-Americans/Blacks. The American Indians/ Alaska Natives and Native Hawaiians/ Pacific Islanders’ COVID-19-positive cases were insignificant. The female positive cases are slightly more than the males, but both are roughly identical. The unknown gender’s positive cases are also trivially small.
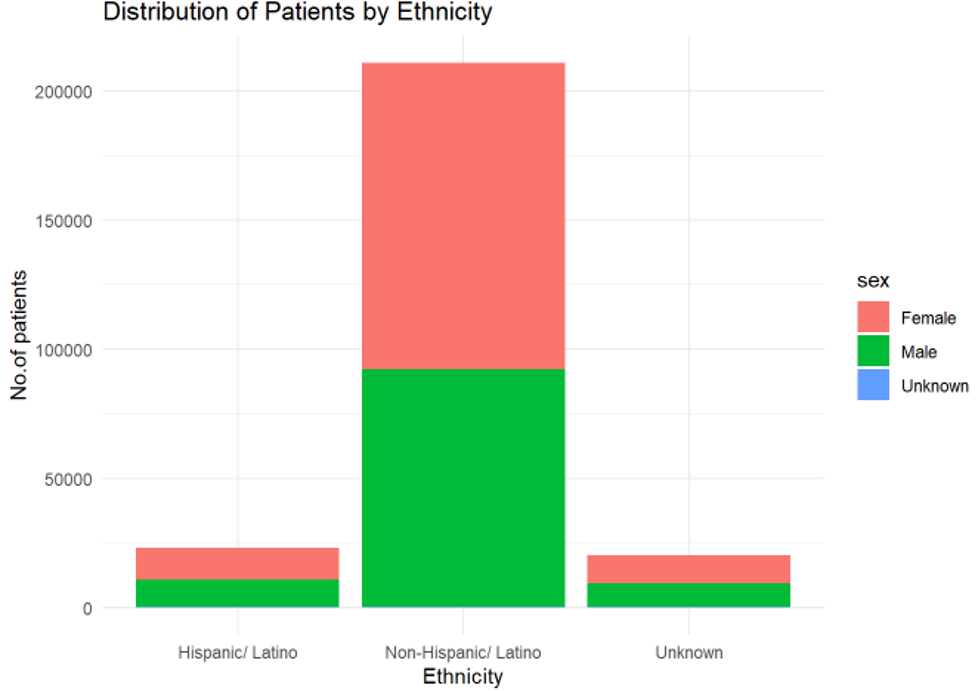
Fig. 3. Distribution of patients by ethnicity
The non-Hispanic/ Latino ethnicity comprises most COVID-19-positive cases in Georgia, the US, as shown in Figure 3 above. The distribution of COVID-19 cases among the Hispanic/ Latino ethnicity is slightly higher than that for the unknown ethnicity. The females’ positive cases are also marginally higher than the males. The unknown gender is not visually visible from the visualization.
More females survived the COVID-19 pandemic than males, as shown in Figure 4 below. A tribally small proportion of the unknown gender is shown to have survived the pandemic. Visually, the number of deaths among females and males seems roughly equal.
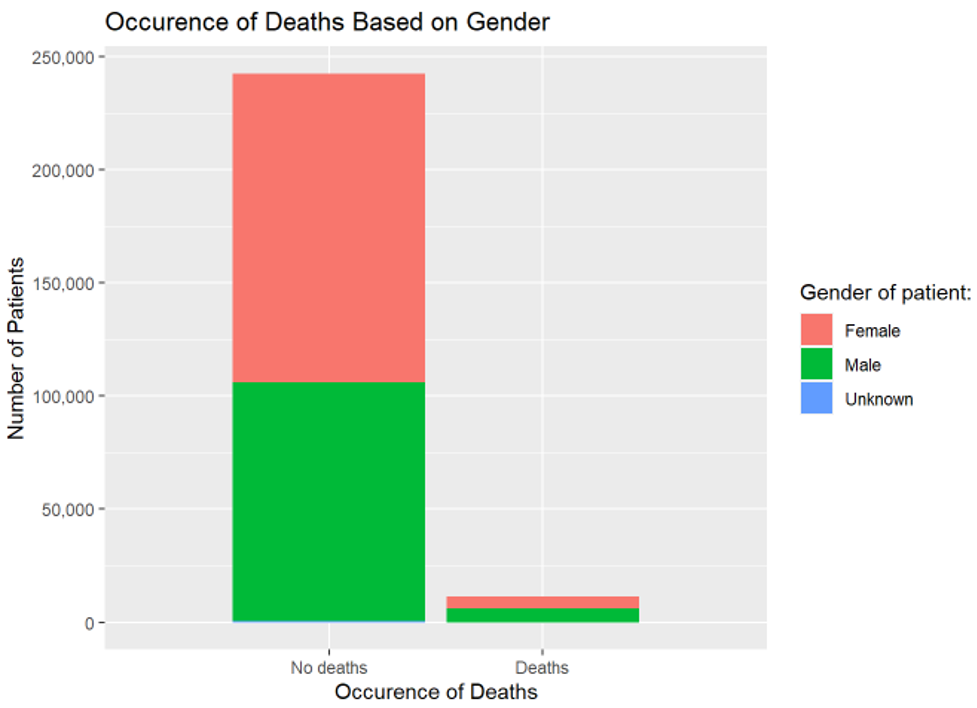
Fig. 4. Occurrence of deaths based on gender
From Figure 5 below, most of the deaths occurred among the non-Hispanic/ Latino ethnicity. A small percentage of deaths can be seen among the Hispanic/ Latino ethnicity. The non-Hispanic/ Latino ethnicity ethnic group also comprised the bulk of the persons who survived the COVID-19 pandemic in Georgia, US. The survivors of COVID are roughly the same for the Hispanic/ Latino and unknown ethnicities.
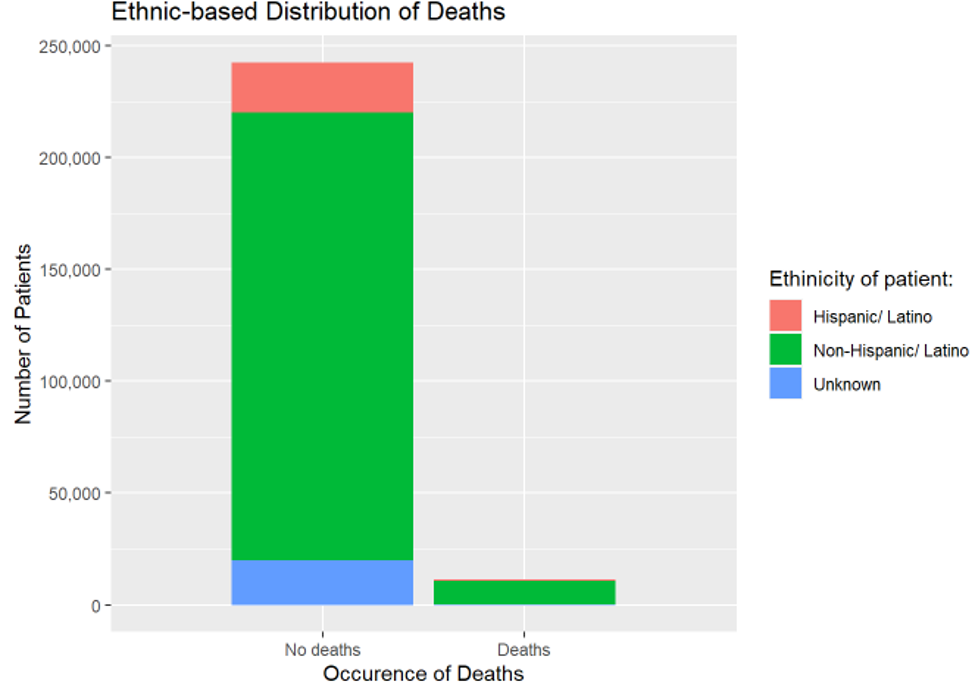
Fig. 5. Ethnic-based distribution of deaths.
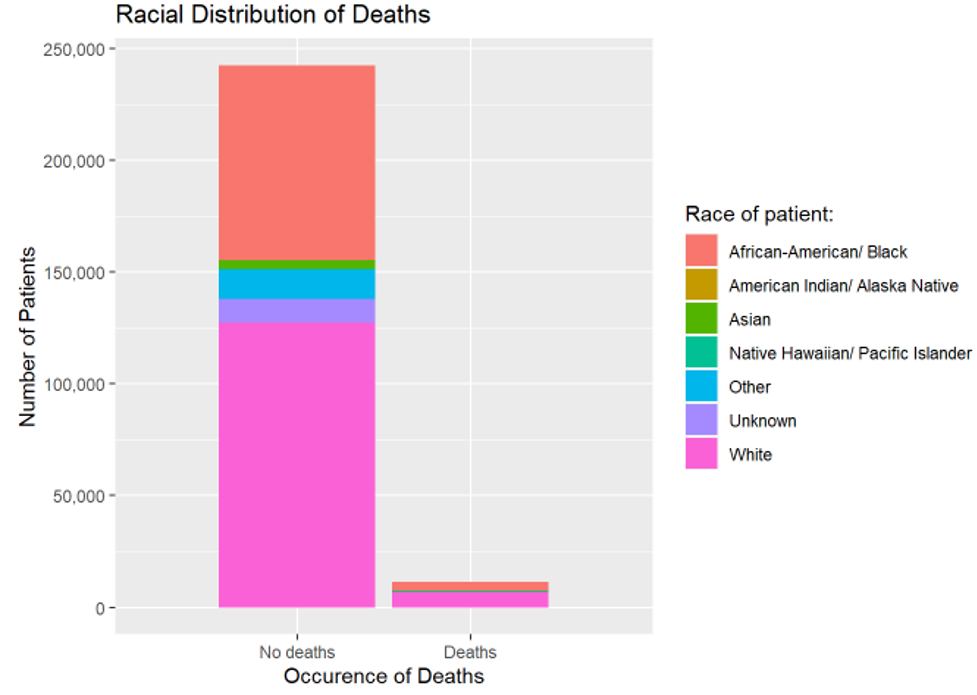
Fig. 6. Racial distribution of deaths
From Figure 6 above, most COVID-19 deaths occurred among Whites, followed by African-Americans/Black. The Whites also comprise most COVID-19 survivors, followed by the African-Americans/Black.
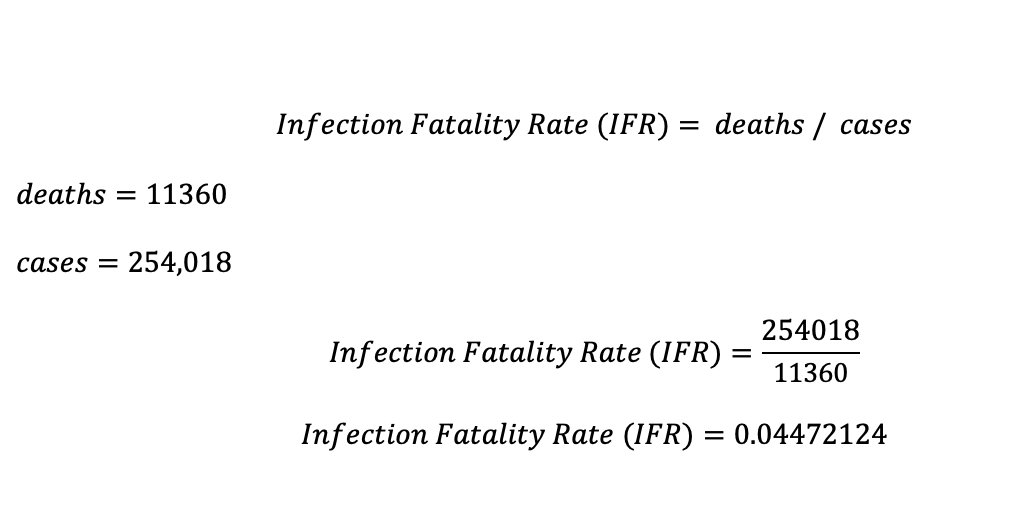
In Georgia, the US, the total number of positive cases is equivalent to the length of the data set, which is 254,018. The total number of deaths is 11, 360. It is also hypothesized that the national population COVID-19 Infection Fatality Rate (IFR) is 0.042. Conducting a t-text on the Georgian data yields a mean of 0.04472124, which implies the true mean is not equal to 0.042. These results align with the manual Infection Fatality Rate (IFR) calculations in Georgia, US, as shown below.
Also, conducting a hypothesis test using the prop.test () or binom.test () yields the same value. Since it is hypothesized that the Infection Fatality Rate (IFR) in Georgia is assumed to be statistically similar to the hypothesized national population rate of 0.042 during the same period, we can reject the hypothesis and embrace the alternative hypothesis that the true p is not equal to 0.042 and it ought to lie between 0.04391745 and 0.04552503 for the t-test, 0.04392237 and 0.04553391 for the prop.test (), and 0.04392069 and 0.04553220 for venom.test ().
Conclusion
The susceptibility to COVID-19 depends on the patient’s gender, race, and ethnicity. For instance, more females survived the COVID-19 pandemic as compared to males. Also, most of the deaths occurred among the non-Hispanic/ Latino ethnicity compared to the Hispanic/ Latino ethnicity. Additionally, most COVID-19 deaths occurred among Whites compared to other races. Furthermore, some positive correlation was observed between the White race, non-Hispanic/ Latino ethnicities, and the male gender with the dependent variable, which implies that White males from the non-Hispanic/ Latino ethnicities are more susceptible to COVID-19 as compared to females and persons with unknown gender with unknown ethnicity and from other/unknown races. The latter shows a weak negative correlation with the dependent variable. Finally, the Infection Fatality Rate (IFR) in Georgia is statistically different from the hypothesized national population rate of 0.042 during the same period since the former has a probability of success that ranges between 0.0439 and 0.0455, which is higher.
References
Brownlee, J. (2020). Data preparation for machine learning: data cleaning, feature selection, and data transforms in Python. Machine Learning Mastery.
Mostafa, F., Ganji, R., St John, J., & Khan, H. (2021). Coronavirus (COVID-19) spike in Georgia: An epidemiologic study of data, modeling, and policy implications to understand the gender-and race-specific variations. American Journal of Biomedical Science & Research, 16(2), 177-192
 write
write