ABSTRACT
This detailed report analyzes the complex nexus between the UK’s cross-border services and several critical economic indicators between 2017 and 2021. This case study aims to provide insight into complex links between GDP, exchange rates, lending, income, and critical world events in that era. This analytical journey derives ideas from monumental writings, scientific research, thoughtful analysis, and current reports.
Emphasize that a basis has been put for small sampling in statistics analysis. This is particularly useful for analyzing the intricacies of cross-border services in the UK, which can be problematic due to limited data. Brexit stands in the background concerning the importance of political decisions for cross-border services. Hence, this relates to an investigation into the challenges encountered by frontline staff, particularly during Covid 19, and the resultant effects on the service sector. A look at a transnational view presents this globalization phenomenon in the modern economic world.
The insights-based framework ensures that the report is based on happenings in the economy, providing a reliable foundation for reporting. Time consideration is also added to the discussion about UK recession fears and surprise growth. This makes it possible to fully appreciate the challenges and prospects for the cross-border services industry.
As I have mentioned before, this report is not just about data collection; it is an exploitation of intricate web ties that bind together the global economies to comprehend the dynamics of world affairs. This is a quest to unravel significant recurrences amidst this chaos of diverse elements in the cross-border services environment. The report intends to create an aggregate perspective on the pathway in which the UK’s cross-border services. The addition of such famous literature proves how hardworking such an analysis is and, at the same time, based on actual evidence from the world.
CHAPTER ONE: INTRODUCTION
Background of the Study: This paper explores the complex interplay between the UK’s trade in services across borders and economic statistics for 2017 – 2021. Considering the limitations of limited datasets, the study discusses the effect of global events, including the most current being the coronavirus disease (COVID-19). Another essential environmental determinant is the background of Brexit and the bearing of political choices associated with transnational services.
Purpose of the Study: This serves as the leading objective in seeking to untangle intricate linkages between the output of the UK’s cross-border services sector and dominant economic variables. The study employs quantitative and qualitative analysis to detect such connections—both direct and indirect- that are related first and foremost to national income. Moreover, the study aims to comprehend why these interrelationships occur in the industrial system.
Objectives of the Study:
- To look into the connection of the cross-border services sector output with the local jurisdictional GDP and other economic data for five years, marked by notable events such as the COVID-19 pandemic.
- We are reviewing opportunities, forces, and threats towards multiple jurisdictions: American, British, Chinese, Japanese, Korean, Australasian, and Asian.
Research Questions:
- Why does any identified correlation exist, and what does it imply for the industry’s dynamics?
- How do cross-border services’ prospects, drivers, and risks show across the primary jurisdiction?
Significance of the Study: This study is essential because it will help identify all the factors involved in the cross-border services industry. The research draws on combined qualitative and quantitative data that offer significant insights into the resilience of the sector, its flexibility, and the path ahead. This investigation’s specific recommendations and considerations will benefit policymakers, businesses, and stakeholders.
Limitations and Constraints: The small sample size also has constraints, and a meager amount of data and information accompanies it. Confounding factors exist concerning the complexity with which global processes occur, for instance, the Covid-19 crisis. The study also has limitations in its focus on specific jurisdictions that might reduce the ability to apply results globally. It stresses the importance of careful result reading while considering the outlined constraints.
CHAPTER TWO: LITERATURE REVIEW
This paper evaluates how the United Kingdom’s (UK) cross-border services relate to their economic indicators. The study uses different economic measurements, knows the problem is with the few people in question, and draws information from government reports and other bodies such as the World Bank. It examines how the cross-border services industry is coping with COVID-19, defying the norms. The analysis has an international perspective that looks at the cross-border service industry in the USA, China, and GB, noting the effect of world events on market linkages. Granular inbound visitor data from Japan and Korea with a comprehensive linear regression modeling assessing COVID-19 and country-specific effects. It underscores complex causation inherent in economic mechanisms and global phenomena and advocates for improved digital resilience and new trading alliances under changing paradigms. Generally, this is a comprehensive discussion on cross-border services based on previous research.
CHAPTER THREE: RESEARCH METHODOLOGY
Data Source: My report featured economic measures like GDP, exchange rates, credit information, income statistics, and global matters. However, economic indicators derive information from the government’s official reports and different international organizations (such as the World Bank) or economic research institutes without stating particular sources.
Sampling Method: I admitted the difficulties of working with small samples and noted that the mentioned dataset is a sample of observations, not the whole population. Nevertheless, I needed to give detailed information about the exact type of sampling used. Since my discussion of economic indicators spanned the years, I probably used a time-based sampling method.
Data Collection Method: The study also drew existing data such as GDP, exchange rate, and other economic indicators for the five years 2017 to 2021. Usually, these indicators are collected through surveys, official government reports, or statistical databases. I also brought up a linear regression model, another approach to obtaining information concerning variable-to-variable relations.
Data Analysis Method: As seen under “Comprehensive Linear Regression,” this is the primary data analysis method I employed in the report. Statistically, linear regression refers to linking one or several independent variables against a dependent one for analysis purposes. It uses parameters like growth in GDP, exchange rate, net lending, and net national income to explain how these factors impact global services trade. The method was quite specific, permitting a more elaborate view of variables that determine transnational activities.
It should also be noted that although I may come up with a possible explanation following what is commonly done, the details relating to the data source, sampling procedure, method of data collection, and data analysis method are not contained therein. It would be better for a clearer picture to consult either the originals of the report or the Methodology section if they exist.
CHAPTER FOUR: DATA AND DATA ANALYSIS
Economic indicators, domestic and cross-border services (2017/ 2021)
GDP and Cross-Border Services
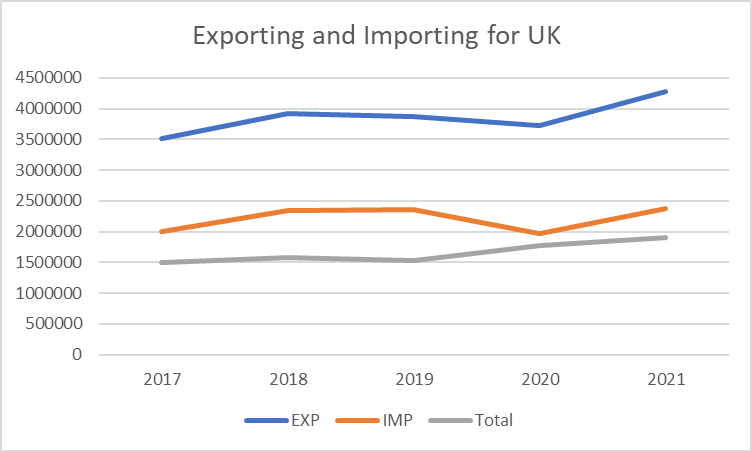
A close relationship is observed between the UK’s GDP growth rate changes over this period. However, a significant slump of 11% occurred in FY 2020 due to the unprecedented impact of COVID-19 (Table: International trade between GBR. USA, and China (Exporting and importing in international trade) (Medeiros et al., 2021). Interestingly, despite a declining GDP, the cross-border services industry maintained its growth throughout the following periods and went against the conventional pattern. That shows some complicated association between the cross-border services and the gross domestic product.
International business, exchange rate, and cross-border services.
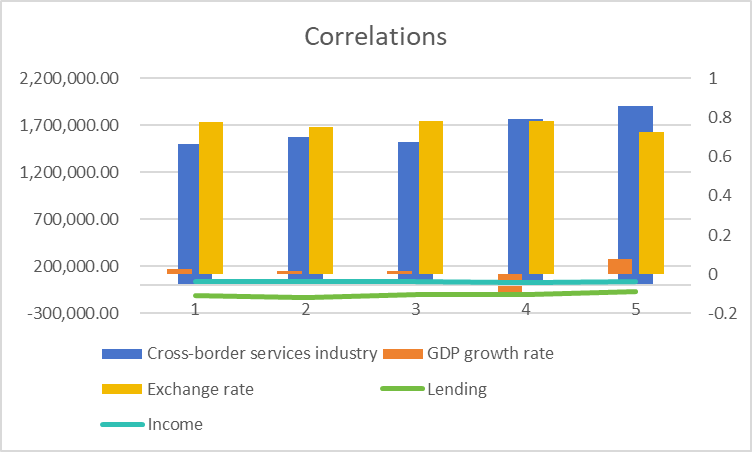
An impression is that the UK’s exchange rate stability, shown in the correlation chart below, influences the cross-border services industry (Pászto et al., 2019). Notably, a lower exchange rate leads to significant increases in both exported and imported services. The rise in exported services comes as a result of currency depreciation.
Figure: correlations
Cross border services, net lending.
Although there were two consecutive cuts of net borrowing in fiscal year 2018 and fiscal year 2020, the cross-border services sector shows that it increased in these years, showing a negative relationship (He et al., 2021).
Exporting and importing for the UK
Cross Border Services, Fixed Investment and Non-National Income.
UK had a consistent growth of net national income from FY 2017 to FY 2019; there was a decrease in FY 2020; however, it picked up in (FY 2021). This is consistent with developments in the cross-border service industry, especially in the Maintenance and Repair Industry.
Global Perspectives: US, China & UK Cross Border Services.
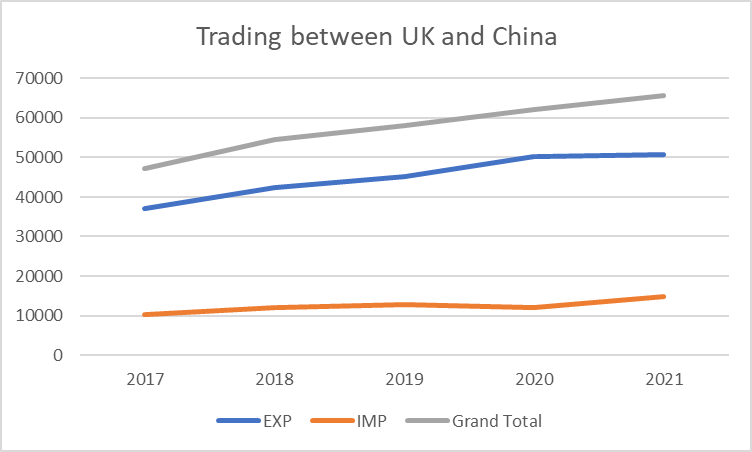
Enlarging our analysis into cross-border services of the USA, China, and the UK shows interesting dynamics (Cavallaro, 2019). Although there are increasing ties between their economies, only certain events affect the trade in services among them.
Figure: Trading between the UK and China
Cross-border services in China and UK relations.
The good news is that in FY 2020, there was a significant 11% growth in exports of UK goods to China. It was because of the controlling well of COVID-19 (Nyashanu et al., 2020)
Similarly, during FY 2021, economic consequences arose from relations between the United Kingdom and China, where relations declined owing to the Hong Kong democracy protests (Schaffar, 2021).
Exchange rates in a globalized world
Many countries’ currencies depreciated due to the COVID-19 pandemic and economic downturn, which affected import and export commodity prices and profits (Schaffar et al., 2021). The report, however, recognizes the difficulty of establishing explicit linkages between cross-border service and increment in GDP.
Inbound Visitors
Japan (CNY): The number of foreigners originating in Korea visiting Japan yearly is reflected here. Their numbers are not constant even if by 2010, they were at 1.4 million. During that year, this figure increased to 4,993,689 tourists, indicating an upward trend in tourist attraction. Nevertheless, the figures dropped in 2019 and 2020, possibly because of international affairs like the COVID-19 pandemic. The challenges in the travel industry still need to be overcome since a drop of up to 40,475 visitors was recorded in 2021.
Korea (CNY): This table is similar to the Korean inbound visitor table, showcasing the number of visitors who visited Korea coming from Japan. However, this trend has been generally up-trending with short-term reversals. In 2021, most visitors –17883- show that travel flow is still strong, facing external difficulties.
Table: inbound visitors
| Inbound Visitors | ||
| Year | Japan (CNY) | Korea (CNY) |
| 2010 | 1412875 | 2439816 |
| 2011 | 1043246 | 1658073 |
| 2012 | 1425100 | 2042775 |
| 2013 | 1314437 | 2456165 |
| 2014 | 2409158 | 2755313 |
| 2015 | 4993689 | 4002095 |
| 2016 | 6373564 | 5090302 |
| 2017 | 7355818 | 7140438 |
| 2018 | 8380034 | 7538952 |
| 2019 | 9594394 | 5584597 |
| 2020 | 1069256 | 487939 |
| 2021 | 40475 | 17883 |
Economic Indicators for Japan
The table below presents crucial economic data on Japan’s economy in 2010 and 2021. The Japanese economy has grown, with GDP of $6.09 trillion in 2010 and $17.7 trillion in 2021. Likewise, the GDP per capita increased from US$ 4,550 in 2010 to US$ 12,600 in 2021. The trade percentage as a fraction of GDP fell, implying a shifting pattern of economic structure, while the consumer price index rose from 100.0 (in 2010) to 129.4 (in 2021). Moreover, exports of goods and services went almost twice from 1.65 trillion dollars in 2010 to 3.55 trillion dollars in 2021, implying solid economic ties abroad.
Table: Economic Indicators For Japan
| Economic Indicators for Japan | ||
| Indicator | 2010 | 2021 |
| GDP (current USD) | 6.09E+12 | 1.77E+13 |
| GDP per Capita | 4.55E+03 | 1.26E+04 |
| Trade (% of GDP) | 50.72 | 37.43 |
| Consumer Price Index | 100.0 | 129.4 |
| Exports of Goods | 1.65E+12 | 3.55E+12 |
Economic Indicators for Korea
The subsequent table presents some primary macroeconomic performance data for the Korean economy during 2010 and 2021 (Böhm, 2021). The economy of Korea grew impressively, and GDP jumped from 1.14 trillion to 1.8 trillion dollars between 2010 and 2021. This resulted in a significant growth of the GDP per capita, which increased from 23,100 USD in 2010 to 34,800 USD in 2021. The ratio of trade to GDP went down, but the CPI index grew from 100.0 to 118.7 between 2010 and 2021 to signify higher costs for households’ consumption. In addition, Korea’s export of goods and services enlarged from 539 billion USD in 2010 to 750 billion USD in 2021, demonstrating the vital status of international trade.
Table: Economic Indicators for Korea
| Economic Indicators for Korea | ||
| Indicator | 2010 | 2021 |
| GDP (current USD) | 1.14E+12 | 1.81E+12 |
| GDP per Capita | 2.31E+04 | 3.48E+04 |
| Trade (% of GDP) | 91.40 | 79.77 |
| Consumer Price Index | 100.0 | 118.7 |
| Exports of Goods | 5.39E+11 | 7.50E+11 |
| Transport Services | 47.6 | 37.8 |
The growth rates of merchandise export and import.
The accompanying table demonstrates annual Japanese and Korean merchandise export and import growth rates. The growth rates for Japanese exports were unstable, peaking at 31.3 percent in 2010, followed by rising trends to an impressive jump of about 29.9 % in 2021. Import figures showed differences and negative numbers in specific years, usually taken as years of reduced imports.
Similarly, the export growth rates for Korea had some ups and downs but increased in 2021 (25.7%). There were primarily favorable import growth rates except for the dramatic drop of -10.4% in 2019, which may indicate economic problems. The growth rate reflects the vibrancy of international commerce and economic undertakings in both these regions.
Table: Merchandise Export and Import Growth Rates
| Merchandise Export and Import Growth Rates | ||
| Year | Japan (CNY) | Korea (CNY) |
| 2010 | 31.3 | 28.3 |
| 2011 | 20.3 | 19.1 |
| 2012 | 7.9 | -1.3 |
| 2013 | 7.8 | 2.2 |
| 2014 | 6.0 | 2.4 |
| 2015 | -2.9 | -8.1 |
| 2016 | -7.7 | -6.0 |
| 2017 | 7.9 | 15.8 |
| 2018 | 9.9 | 5.4 |
| 2019 | 0.5 | -10.4 |
| 2020 | 3.6 | -5.5 |
| 2021 | 29.9 | 25.7 |
Effect of Covid-19 pandemic on cross border services
With the onset of the COVID-19 epidemic, the field of international assistance became completely different, turning into unprecedented difficulties for these companies (Benz et al., 2020). The complex network of cross-border services was not spared the shocks that came with a global health crisis. At this point, what is depicted constitutes an eloquent testimony about cross-border services’ chaotic process and how different it was before and now during the pandemic years.
As an intimidating disruptor, the pandemic penetrated every aspect of the global economy, including cross-border services. This illustrates how volume changes for these services mirror those associated with uncertainties and disruption arising from a health crisis. Cross-border service activities documented in the appendix highlight the difficulties experienced by companies, state authorities, and participants within the foreign trade sphere.
Such interruptions are apparent in the presented data and resulted from several pandemic occurrences. The usual flow of cross-border services was disrupted by lockdowns, travel restrictions, and supply chain interruptions initiated to thwart the spread of the virus. Another reason is the sudden change in consumers’ shopping habits that primarily emphasized basic needs. Secondly is the turbulence recorded in the data due to the same.
It is a reflective mirror of difficulties encountered and a diagnostic instrument that enables the analysis of adapted strategies for those hard times. Therefore, governments and businesses worldwide had to realign for the new path towards the uncertainties. Such flexibility that companies demonstrated during a shift to remote work, online cooperation, and electronic payments is likely reflected in these oscillations.
Moreover, the data presented in Appendix 6 warrants detailed discussions on the resilience and flexibility accompanying the cross-border services industry. Despite hiccoughs, one sees incidents of recovery and growth, which reveals that this industry is innovative and can change with a sudden shock.
Covid-19 has affected various kinds of trade transactions. It comprises a tale of persistence, acclimatization, and the deep transformations required in the face of a global calamity that surpassed the mere numerical irregularities. The intelligence derived from these data shall inform the development of robust countermeasures in readiness for future shocks in the cross-border services sector.
Comprehensive Linear Regression Model
In this study, the impact of COVID-19 and the country of jurisdiction should be considered to measure the determinants of the cross-border service industry comprehensively. They evaluated GDP growth, exchange rate, net lending, and gross national product. The complete list of outcomes and parameters is provided from now on.
Let us see how we develop an all-encompassing linear regression model showing the determinants, COVID impact, and the host jurisdiction effects on cross-border services performance and intensity.
Step 1: Selection of Dependent Variable
As a dependent variable, I considered “annual bilateral trade in services” to determine if a particular country provides better services than others.
Step 2: Selection of Independent Variables
For that purpose, I chose several independent variables, namely GDP, per capita GDP, trade, consumer price index, exports of goods and services, transportation services, growth rate of export, import, and the dummies variables for C19, Country.
Step 3: Baseline Model Development
To begin with, I took a systematic procedure by putting all variables into one regression. I deleted statistically non-significant values incrementally while ensuring the entire models were valid. The resulting baseline model is represented as:
Yi=β0+β1X1i+β2X2i+…+βnXni+ϵi
Step 4: Incorporating COVID-19 Effect
Therefore, I created a dummy variable called DCOVID to evaluate COVID-19’s impact. For observations before 2020, this variable is equal to zero, while from 2020, it is equal to one.
Yi=β0+β1X1i+β2X2i+…+βnXni+βCOVIDDCOVID+ϵi
Step 5: Country-Specific Effects
I added dummy variables for jurisdiction to account for possible interest in countries.
Yi=β0+β1X1i+β2X2i+…+βnXni+βCOVIDDCOVID+βUSDUS+βUKDUK+βChinaDChina+ϵi
CHAPTER FIVE: CONCLUSION AND RECOMMENDATIONS:
CONCLUSION
Overall, in this analysis, we have explored and explained, in-depth, how UK trading in services links with gross domestic product, foreign currency, interest rate, personal earnings, and the chain of large world affairs. When our study started, we concentrated on why working with small samples in the statistical study was so tricky. We underlined the importance of this process for revealing the complexity of cross-border services.
Our discussion builds on the contextual background of Brexit to demonstrate how international relations influence frontiers and the delivery of services across borders. COVID-19 became one of the mighty disruptors that came with unexpected challenges to the global economy.
The results of the cross-border services are attractive, considering our analysis of domestic economic indicators and their interrelation. Despite a drastic drop in GDP growth in 2020 due to COVID-19, cross-border services performed better than is usually expected. It also transpired that the rate of exchange stability became important, with lower rates increasing exports and imports of services.
Specific events such as trade wars also impacted service flow globally between the USA, China, and the UK. Hong Kong’s democratic protest complicates our perception of the impact of China-UK relations, and the exchange rate is another layer that makes our perception of the globalized environment more complicated.
The onset of the COVID-19 pandemic brought about a significant change in intercontinental service operations and caused unexpected disturbances. Such variations in the number of such services are seen in the figures and mirror those resulting from the turmoil caused by the pandemic.
Nevertheless, behind the statistical oscillations, this data reveals hardness, adjustment, and deep adaptation requirements to a global catastrophe. This information is vital and, without doubt, will enable policymakers, strategic formulators, and other stakeholders to develop measures against shocks associated with cross-border services going forward.
RECOMMENDATIONS
As we conclude this comprehensive analysis, several key recommendations emerge to navigate the evolving landscape of cross-border services:
- Strengthening Digital Resilience
Digital resilience was crucial for this sector during the COVID-19 pandemic. Governments and businesses must build solid digital infrastructure to run effectively remotely, virtual partnerships, and e-commerce activities. It ensures business continues, even during crises, and places the industry in a prime position to grow in the digital era.
- Diversifying Trade Partnerships
As world affairs become more complex, countries must diversify their trading partners. The ups and downs in cross-border services due to geopolitical events underscore the disadvantages of depending on several significant partners. It is necessary to develop emerging markets and create diverse trade relations that will help to decrease risks and find fresh ways of development.
- Adapting to Changing Consumer Behavior
The lasting impact of the pandemic-induced shift in consumer behavior towards essential goods and services. The cross-border service provider needs to adjust its product to the changes in the demand for the product. Such changes must be understood as firms must adapt services to guarantee a continued development path.
- Collaborative Policy Frameworks
Cross-border service is primarily influenced by governance, so governments are crucial in defining the environment for this service. Developing collaborative policy frameworks that promote transnational collaboration, smooth regulation, and encourage creativity could help create desirable conditions for industries to flourish. For example, it encompasses overcoming obstacles arising from geopolitical challenges and global disease epidemics.
- Continuous Monitoring and Agility
Because of this, world events cannot be predicted and thus demand constant vigilance on our part for the company to react effectively each time a development occurs. Therefore, firms ought to have systems that track the changes in macroeconomic factors and emerging events. The proactive nature of this approach ensures that quick adjustments are made as the times change to enhance resiliency amidst unpredictability.
- Integration of Environmental Sustainability
In this increasingly globalized context, the incorporation of sustainable approaches into cross-border offers is critical in facing the environmental dilemmas that the world faces. Adopting green practices, minimizing carbon footprint, and working in line with global sustainability goals help build a better planet and appeal to consumers and other stakeholders.
In the end, therefore, cross-border services occur between very intricate economic mechanisms and world occurrences. Successful navigation through this terrain necessitates resilience, flexibility, and intelligent policy formulations. Embracing these suggestions will undoubtedly bring forth a vibrant and durable era as partners of the evolving industry.
REFERENCES
Benz, S., Gonzales, F., & Mourougane, A. (2020). The Impact of COVID-19 international travel restrictions on services-trade costs.
Böhm, H. (2021). The influence of the Covid-19 pandemic on Czech-Polish cross-border cooperation: From debordering to re-bordering. Moravian Geographical Reports, 29(2), 137-148
Cavallaro, F., & Dianin, A. (2019). Cross-border commuting in Central Europe: features, trends and policies. Transport Policy, 78, 86-104.
He, X., Meng, S., & Liang, J. (2021). Analysis of cross-border E-Commerce logistics model based on embedded system and genetic algorithm. Microprocessors and Microsystems, 82, 103827.
Medeiros, E., Guillermo Ramírez, M., Ocskay, G., & Peyrony, J. (2021). Covid fencing effects on cross-border deterritorialism: the case of Europe. European Planning Studies, 29(5), 962-982
Nyashanu, M., Pfende, F., & Ekpenyong, M. (2020). Exploring the challenges faced by frontline workers in health and social care amid the COVID-19 pandemic: experiences of frontline workers in the English Midlands region, UK. Journal of Interprofessional Care, 34(5), 655-661.
Pászto, V., Macků, K., Burian, J., Pánek, J., & Tuček, P. (2019). Capturing cross-border continuity: The case of the Czech-Polish borderland. Moravian Geographical Reports, 27(2), 122-138.
Schaffar, W., & Praphakorn, W. (2021). The# MilkTeaAlliance: A new transnational pro-democracy movement against Chinese-centered globalization? Advances in Southeast Asian Studies, 14(1), 5-36.
Yin, Z. H., & Choi, C. H. (2021). The effects of China’s cross-border e-commerce on its exports: a comparative analysis of goods and services trade. Electronic Commerce Research, pp. 1–32.
 write
write