Introduction
Business quality tools are essential in maintaining the efficiency of the manufacturing process. The reason is that they help the companies identify the problem in their products and work towards solving them. It is some of the quality control tools that aid the companies in increasing the opportunities of finding a career in quality assurance and hence enhance their production. Today’s most common quality tools include control charts, histograms, check sheets and flow charts. Choosing the quality tool to adopt requires the consideration of some factors. These factors include choosing the tool that best fits the quality control issue and considering the tool that can help analyze the issue. Moreover, one can consider the tool that helps prioritize the quality issues effectively and a tool that helps improve the quality as time goes by. The paper identifies one quality tool an organization implements and determines its benefits within the business.
The Tool
The quality tool that is selected for the discussion is a histogram. A histogram is a business quality tool that is among the most used graphs that usually show the distribution of frequencies (Castello, De Castro, and Marimon, 2019 70). The above-stated frequencies are determined based on the data that is collected. A simple illustration of a histogram is having on the x-axis the errors that are likely to arise in a day and their frequencies on the y-axis. However, the histograms are of different forms and can be used based on the nature of the business that you are aiming to improve their quality. Some of the most common types of histograms include normal distribution, right-skewed, left-skewed, and random distributions. The standard distribution points are on the side of the average, and the rest are likely to occur on the sides. On the right side, also known as the positive skews, most of the data tends to be on the left side, and little data is on the right side. The left skewed is also known as the negative distribution, and most of the data values are on the right side, with very few being on the right side.
On the other hand, the random distribution lacks apparent patterns and usually has several peaks. The intersection of these lines helps come up with bars of different sizes and heights beneath them. It is the shape of the distribution that helps in analyzing the histograms—as a result, enabling the business to determine and understand better the frequency of quality control issues.
Nature Of the Business
Nature businesses that use histograms as quality tools usually display statistics in the business and other disciplines. The selected business for the discussion is the banking business. It is the banks that engage in marketing campaigns that are more likely to use histograms to aid them in coming up with the most effective pricing plans (Takeuchi and Quelch, 2019 para.8). Banks display an extensive range of data that are homogenous such businesses on most occasions tend to be studying the income of their customers. Most of the bank that uses histograms as analysis tools are the ones that analyze both data and trends. The reason is that the population of the customers falls under a large bracket of homogeneous distribution. Moreover, banks that engage in various activities are more likely to use histograms since they can offer insightful looks at the frequency distribution. The other way in which banks use histograms as quality assessment tools is by the businesses that require feedback from their customers.
Why Quality Is Important to Banks
Quality is essential to most banks since it helps them to improve their products and business operations. As a result, they are in a stronger market position hence beating the competitors. Moreover, besides improving the brand, the quality of products helps protect the business from risks, increasing their efficiency and resulting in high profits. It also makes the customers to be loyal and the staff to be happy. Quality products make the marketing of the product easy, confirming that it is essential and not only in production. Quality makes companies aware that they are offering the products that the customers require.
Objectives Of Using a Histogram
Histograms are used in a business to represent a summary of data in a way that is easily understood and of any type. Histograms help improve the decision-making process in a business since they are easy to construct and analyze (Canonico et al. 2021 1080). For example, on the issue of the waiting time to be served in a bank. Banks can improve their services by increasing staff or even automating their services. Histograms visually represent the bank data and help identify gaps within the collected data. The use of histograms makes it easier to obtain the median of the business data that is represented graphically. The solutions provided by the histograms are more effective in solving most of the bank issues despite being simple.
What Is to Be Achieved or Prevented?
Banks are using histograms to try and achieve practical solutions for their problems. The bank is also trying to visualize the data collected to visualize its frequency distribution and identify the outlier gaps in the data. The bank is trying to offer a solution by identifying and quantifying the quality issues in the production process. The bank will achieve efficient service delivery to its customers. The reason is that their customers will no longer have to wait in lines for longer duration to obtain the services they desire. Histograms offer a solution to bank marketing by making it easier to determine the market prices suitable for their products. The other achievement that can be obtained through the use of histograms as quality assessment tools is the comparison of groups of data and coming up with accurate trends. The use of histograms is trying to prevent the use of an ineffective solution likely to bring down the bank, for instance, in the case of waiting time in the banks or the bank is trying to minimize the duration of time that the customers take to receive a particular service to improve the quality of services.
How Did They Make the Tool Work?
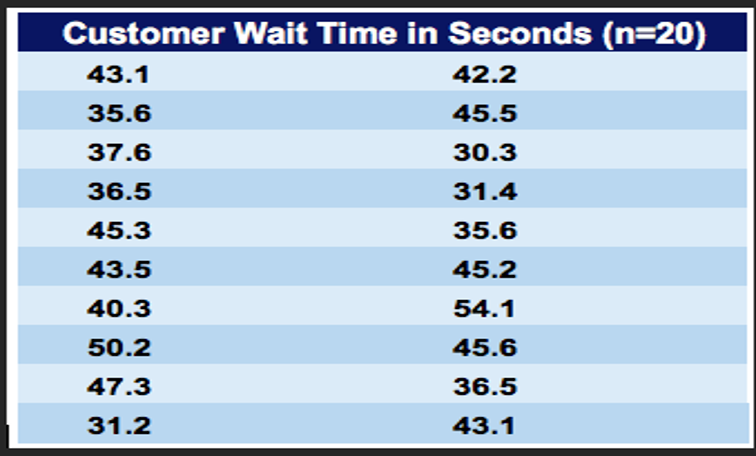
Regarding waiting in queues at banks, the histograms as quality tools helped obtain the maximum and minimum duration of time spent in waiting lines. As a result, they can increase their staff or even improve their systems to ensure they are faster. The tool was made to work by considering a similar case involving a bank manager at a local bank. The bank manager had received feedback that the waiting duration to receive services was quite long (CFL team, 2022 para.8). As a result, he then decided to collect data by observing and writing down the duration that 20 customers spent. The data below represents the waiting time recorded by the manager.
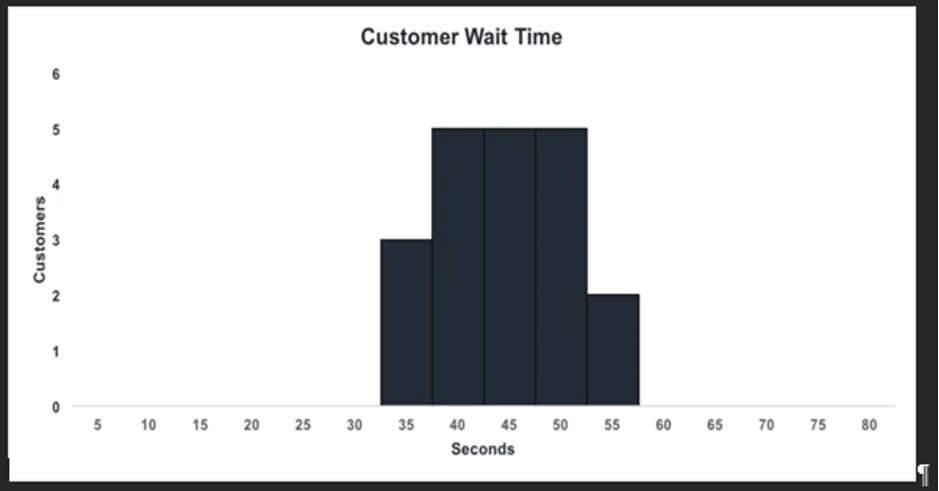
A Histogram Representing Waiting Time in Bank
What Can Be Done to Improve the Problem Further?
Since histograms are essential quality tools, especially in decision-making, they can improve the issue further by determining whether to open up other branches. The reason is that the histogram will be able to identify the limitation resulting in waiting for long periods at the bank or supermarkets. Therefore, the main issue is the space available for the bank to conduct its operations. They may relocate or open other branches. Such an approach will help further improve the services rendered to the customers. This is because some of these customers will be helped to avoid worrying about reaching the bank since the branches will be closed.
Regarding relocation, their building will be able to accommodate more tellers to cater to their customers on the issue of marketing their products to different age groups. The bank will be eased the burden of worrying about their significant consumers. The reason is that the histogram as a quality assessment tool will have identified the age that consumes their products more often.
Conclusion
Business quality tools are essential in maintaining the efficiency of the manufacturing process. It is some of the quality control tools that aid the companies in increasing the opportunities of finding a career in quality assurance and hence enhance their production. The quality tool that is selected for the discussion is a histogram. A histogram is a business quality tool that is among the most used graphs that usually show the distribution of frequencies. It is the shape of the distribution that helps in analyzing the histograms. Banks that engage in marketing campaigns are more likely to use histograms to aid them in coming up with the most effective pricing plans. Most of the banks that uses histograms as analysis tools are the ones that analyze both data and trends. The other bank es that can use histograms as quality assessment tools is the bank es that requires feedback from their customers. Histograms help improve a bank’s decision-making process since they are easy to construct and analyze. The bank will achieve efficient service delivery to its customers. Quality is important to the most banks since it helps them to improve their products and bank operations. Histograms help improve a bank ‘s decision-making process since they are easy to construct and analyze. The bank is trying to minimize the duration of time that the customers take to receive a certain service to improve the quality of services. The reason is that the histogram will be able to identify the limitation resulting in waiting for long periods at the bank or supermarkets.
References
Canonico, P., De Nito, E., Esposito, V., Fattoruso, G., Iacono, M.P. and Mangia, G., 2021. Visualizing knowledge for decision-making in Lean Production Development settings. Insights from the automotive industry. Management Decision, 60(4), pp.1076-1094.
Castello, J., De Castro, R. and Marimon, F., 2019. Use of quality tools and techniques and their integration into ISO 9001: A wind power supply chain case. International Journal of Quality & Reliability Management.
Takeuchi, H. and Quelch, J. (2019). Quality Is More Than Making a Good Product. [online] Harvard Business Review. Available at: https://hbr.org/1983/07/quality-is-more-than-making-a-good-product.
CFL team (2022). Histogram. [online] Corporate Finance Institute. Available at: https://corporatefinanceinstitute.com/resources/excel/histogram/.
 write
write