Introduction
Two firms have controlled the U.S. soft drink market for over a century. These two businesses hold around 70% of the market dominance for the industry. Coca-Cola and PepsiCo. The two businesses have economies of scale that allow them to charge low prices, preventing smaller businesses from entering the market. They have also developed strong brand names that have attracted devoted customers who are challenging to persuade to switch even though switching costs are nonexistent. As a result, the two businesses have created a duopoly that enables them to be extremely successful while minimizing manufacturing costs and competition (Zhang, 2019, pp.1).
Market Analysis
The primary economic parameters taken into account in the study of the consumer soft drink business are the market size, growth rate, and profitability of soft drink makers. Changes in supply and demand often have an impact on price and output levels in the majority of businesses. Several aspects of the soft drink business, such as customer preferences and health concerns, directly impact the market’s level of soft drink product consumption. Because of the availability of health-related information through public campaigns and social media platforms, Americans are more aware of the advantages they would receive from the items they buy and eat (Santana-Mayor et al., 2021, pp.1).
Due to the shift in customer desire towards healthier beverages, the demand for carbonated soft drinks has been decreasing over the past several years. The change to healthy beverages is promoted to raise consumer awareness of the negative consequences of soft drinks on their health. Limitations on the number of sugary beverages offered to customers also reduce demand for such goods. Health professionals, communities, and governments are criticizing soda drinks for the negative impacts of the beverage components, excessive sugar content, and artificial additives. The increased public awareness of the health risks connected with sodas and other carbonated beverages due to obesity and sedentary lifestyles poses a severe challenge to the soft drink industry. Soft drink manufacturers must distinguish their offerings and maintain high sales volumes to counter the drop in consumption.
By incorporating nutritional value into their products and creating healthier brands, Pepsi, Coca-Cola, and other large beverage firms are now creating new healthy beverages. For instance, beverage firms make mid-calorie sodas that consumers who want to eat fewer calories and avoid health hazards from obesity and other nutritional deficits seek out. Regular sodas often contain more sugar than the daily limit of 25 grams for healthy persons suggested by the World Health Organization (Santana-Mayor et al., 2021, pp.1). To encourage people to lead better lifestyles, health experts are worried that such sugar content levels should be reduced. By spreading awareness of healthier options, creating smaller portion packing containers, and increasing the selection of low-calorie goods, the soda industry would lower the number of calories in soft drinks.
The soft drink sector has a trend of rising customer demand for unique goods. Instead of buying simple or ordinary things, buyers are frequently interested in obtaining new products. Customers would find the items more enticing and would be more aware of the company if it had a distinctive brand or image. The unique items also provide the soft drink firms with a competitive edge. For instance, the success of the Coca-Cola Corporation is credited to the range of flavours offered in addition to the standard Coca-Cola beverage, such as Vanilla Coke and Diet Coke.
Price Elasticity of Demand
The degree to which the quantity desired of an item responds to a change in price is known as price elasticity of demand in microeconomics. According to Blake (2019, pp.1), this is computed by dividing the percentage change in the amount required of an item by the percentage change in the price of the good. When a product’s demand changes in reaction to a price adjustment, this is called elastic demand. Sales frequently decrease as prices rise and increase when prices fall. As customer demand for Coca-Cola and PepsiCo products swings dramatically due to price changes, these products are said to have an elastic demand if Coke’s price rises from one point five U.S. dollars to two U.S. dollars per bottle and the price of a Twenty oz.
Only USA citizens are used in this demographic profile research. The Food and Drug Administration 2020 provided the statistics (Ling, 2017, pp.1). If the demographic group is divided according to age, the average cost of soft drink consumption during the previous three years (from 2018 through 2020). The demographic pattern will be addressed based on area, household size, income, and age. Figure 1 shows the demographic composition broken down by age.
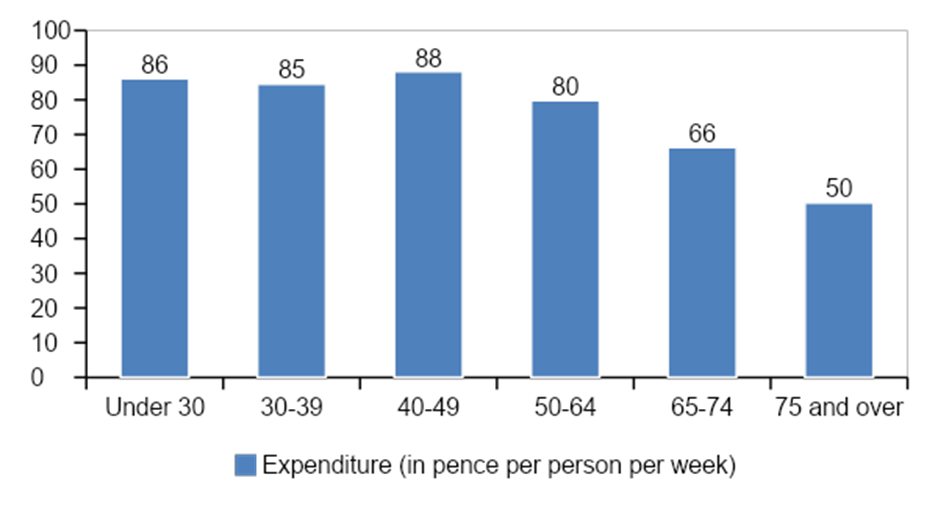
Figure 1 displays consumer spending and soft drink purchases by age. According to the research, those between the ages of 40 and 49 buy the softest drinks overall. The age group under 50 spends the most money on soft drink purchases and consumption overall, averaging more than a pound per person every week.
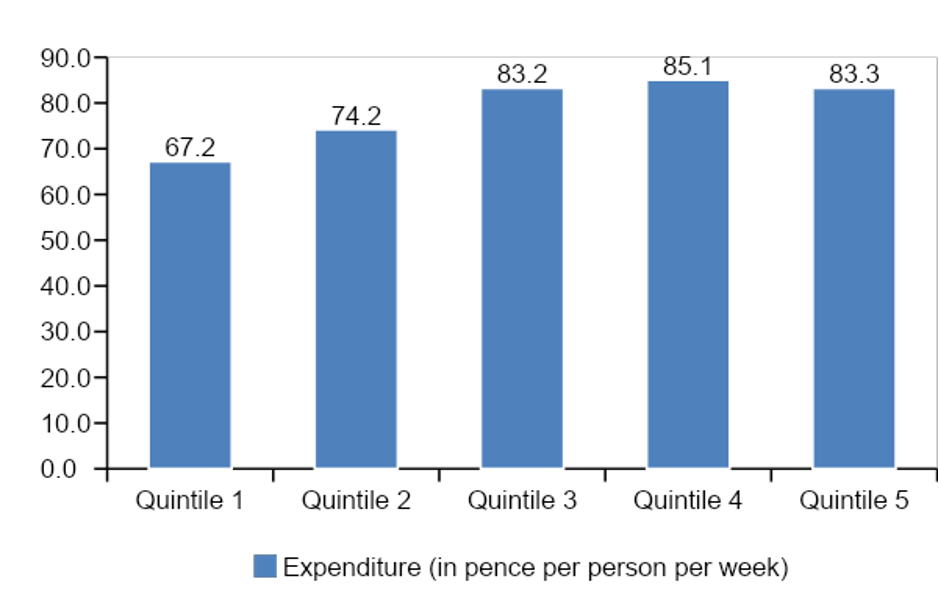
Figure 2 displays the household spending based on income and how much they spend each week in pence. The highest income level is represented by quintile 5, and the lowest by quintile 1. This demonstrates that those in quintiles 3 and 4, or medium and upper-middle-class income groups, spend the most money on soft drinks. Overall, the largest three quintiles spend the most money per person each week on soft drinks.
The average weekly household income for our target demographic was determined to be £550. The typical household that Coca-Cola is truly targeting spends 0.15 per cent of its income on soft drink consumption, given that the household spends so much on soft drinks, whether they are a luxury item or a need emerges. It is clear from Figure 2 that the income elasticity of soft drinks varies with household income. Soft drink consumption rises with income when the household’s income is below quintile 4.
Nevertheless, when income levels climb, consumption decreases, suggesting negative income elasticity at higher income levels. The crucial metric for this is the income elasticity of demand. The ratio between the percentage change in consumption expenditure and consumption can be used to determine this. When the income elasticity of soft drinks in the U.S. was calculated, it was discovered that the average income level for quintiles 1 and 5 was £5200, £3200, and £14,300, respectively (Teng et al.,2019, pp.1).
When analyzing the income elasticity at lower quintiles, it was discovered that soft drinks fall into the usual category since their income elasticity for quintiles below four is 0.21. On the other hand, the income elasticity changes to -0.04 for income above quintile 4, indicating that soft drinks are now a lower-quality commodity for households with higher income levels. This suggests that the product will be consumed more when the target market consists of people who earn less than the fourth quintile of income.
The Soft Drink Industry’s Economics and Organizational Structure
Luco and Marshall(2020, pp. 2042) assert that because the concentrate recipe is a trade secret zealously protected by trademarks and patents, the soft drink industry has historically been difficult for new entrants. In actuality, only PepsiCo has been able to perfect its special formula to the point that it can compete with Coca-Cola. In addition to being expensive, setting up a bottling facility has low-profit margins, which deters many investors. Franchise agreements between bottlers and concentrated manufacturers grant them a monopoly in their respective markets, making it difficult for new competitors. Also, the agreement forbids them from working with rival goods; thus newly formed concentrate companies must find their bottlers.
According to Thakkar (2019, pp.1041), the competition between the two has, over the years, played a significant role in fostering success for both businesses. They have been able to lock out any rival businesses because of their expansion and better market dominance, making the industry incredibly profitable. Bottled water, tea, milk, coffee, packaged juice, and energy drinks are just a few alternatives. The businesses are broadening their offerings in various markets despite the serious threat posed by them. Suppliers have little negotiating leverage in this business because all materials are easily accessible. In a similar vein, there are a large number of product purchasers, which limits their ability to negotiate prices significantly.
Summary
The U.S. economy’s GDP has significantly increased as a result of the rise of the soft drink business. The big soft drink corporations have expanded their global footprint due to globalization. Increasingly customers worldwide are looking for information on the soft drink products sold by rival companies in both home and foreign marketplaces. The country can enhance its earnings by entering overseas markets or exporting soft drink goods to global markets. The income level of Americans would grow with an increase in the country’s GDP, which would translate into more disposable income for consumers to spend on non-durable goods. The market for non-durable soft drinks would thus grow due to the rise in demand. The market need for the current goods would change when other significant soft drink businesses entered the market. Major corporations coming together would boost revenue growth and enhance their market shares.
Bibliography
Blake, M.R., Lancsar, E., Peeters, A. and Backholer, K., 2019. Sugar-sweetened beverage price elasticities in a hypothetical convenience store. Social Science & Medicine, 225, pp.98-107.
Ling, X., 2017. Customer Relationship Management: Case study Coca-Cola Company.
Luco, F. and Marshall, G., 2020. The competitive impact of vertical integration by multiproduct firms. American Economic Review, 110(7), pp.2041-64.
Santana-Mayor, A., Herrera-Herrera, A.V., Rodriguez-Ramos, R., Socas-Rodriguez, B. and Rodriguez-Delgado, M.A., 2021. Development of an alternative green vortex-Dispersive liquid-liquid microextraction based on natural hydrophobic deep eutectic solvents for the analysis of phthalate esters in soft drinks. ACS Sustainable Chemistry & Engineering, 9(5), pp.2161-2170.
Thakkar, A., Darji, N. and Vaishnav, K., an Online Comparative Study on Pepsico and Coca Cola. Journal homepage: www. jr. Com ISSN, 2582, p.7421.
Teng, A.M., Jones, A.C., Mizdrak, A., Signal, L., Genç, M. and Wilson, N., 2019. Impact Sugar‐sweetened beverage taxes on purchases and dietary intake: a systematic review and meta‐analysis. Obesity Reviews, 20(9), pp.1187-1204.
Zhang, Z., 2019. Risk Analysis of Two Leader Drink Companies: PepsiCo and Coca-Cola. Asian Business Research, 4(3), p.42.
 write
write