1.0. Introduction
Airbnb is a company that has transformed the way people travel and experience new cultures. As a peer-to-peer lodging platform, Airbnb has created a unique business model that connects travelers with hosts who offer their homes or apartments as accommodations. In this critical analysis, I will examine Airbnb’s measures of success, including its financial performance, customer satisfaction, and market share. I will also evaluate the company’s strategic advantages, including its ability to leverage its brand, platform, and data analytics capabilities. Additionally, I will assess the leadership contribution of the company’s co-founders and executives. Most importantly, I will provide strategic recommendations for Airbnb, including expanding its services to new markets, improving customer support, and leveraging emerging technologies to enhance the user experience.
2.0 Measures of Success
2.1. Financial KPIs
From 2018 to 2022, Airbnb’s revenue increased from $3.7 billion to $5.1 billion, representing a 5-year CAGR of 6.2% (indicated in Table 1) (Yang et al., 2022). This growth can be attributed to the increasing popularity of Airbnb’s platform among travelers seeking unique and affordable accommodations. Gross bookings also grew during this period, from $29.4 billion in 2018 to $52.6 billion in 2021, representing a CAGR of 19.7%. This indicates that the number of bookings made on Airbnb’s platform has increased rapidly, further solidifying the company’s position as a leading player in the accommodation-sharing industry (Agarwal et al., 2022).
Airbnb’s net income has been volatile in recent years, with losses in 2019 and 2020 and a sharp increase in profitability in Q3 2021. In 2018, Airbnb reported a net income of $16.9 million, which increased to $674 million in 2021, marking a 5-year CAGR of 120.7%, as reported in Table 1 (Kirkos, 2022). This improvement in profitability can be attributed to a combination of factors, including cost-cutting initiatives and the growth of the company’s business in new markets.
Benchmarking Airbnb’s financial metrics against competitors in the industry provides a broader perspective on its success. One of Airbnb’s closest competitors is Booking.com, which also offers accommodation services and is a leading online travel agency. In 2021, Airbnb’s revenue was $4.7 billion, while Booking.com’s revenue was $11.1 billion, indicating that Booking.com is a larger player in the industry (See Table 1). However, Airbnb’s gross bookings grew faster than Booking.com’s during this period, with Airbnb reporting a CAGR of 19.7% compared to Booking.com’s CAGR of 7.1% (Yang et al., 2022). This suggests that Airbnb is expanding its business faster than Booking.com.
2.2. Non-Financial KPIs
Assessing the success of Airbnb requires evaluating various non-financial metrics, such as brand awareness, customer satisfaction, brand recognition, and the number of listings and hosts on the platform. These metrics provide insight into the level of engagement and satisfaction among users and the platform’s ability to attract and retain hosts and guests.
One of the critical non-financial metrics is brand awareness, which measures the extent to which the Airbnb brand is recognized and familiar to potential users. Airbnb has significantly increased its brand awareness through various marketing campaigns, sponsorships, and partnerships. According to a survey by Statista in 2021, 86% of respondents in the United States were aware of the Airbnb brand, indicating a high level of brand recognition (Kirkos, 2022).
Another important non-financial metric is customer satisfaction, which measures the level of satisfaction among guests who have used the platform to book accommodations. Airbnb has consistently ranked high in customer satisfaction surveys, with a Net Promoter Score (NPS) of 60 in 2020, according to a report by YouGov (Agarwal et al., 2022). This indicates that most users are satisfied with the platform’s services and are likely to recommend it to others.
Brand recognition is another key non-financial metric that measures the strength and visibility of the Airbnb brand. Airbnb has invested heavily in building its brand, including creating a distinctive logo, brand messaging, and partnerships with high-profile events and celebrities. According to a report by Brand Finance, Airbnb was ranked as the 18th most valuable brand in the world in 2021, with a brand value of $21.2 billion (Yang et al., 2022).
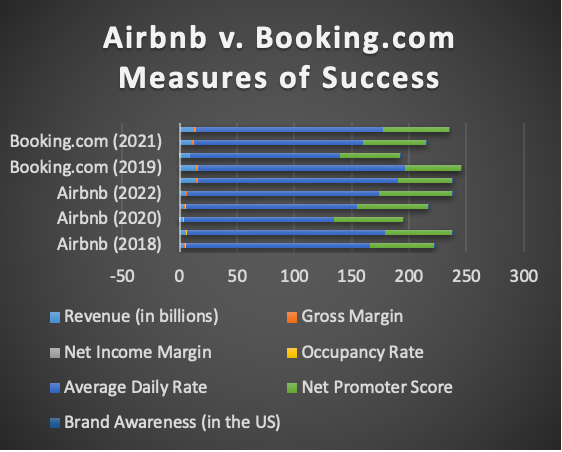
The following table compares both financial and non-financial measures of success between 2018 and 2022:

The table is Summarized and converted into the graph below:

Measuring the success of Airbnb can be challenging due to the nature of the vacation rental market. Compared to hotels with established metrics such as occupancy rate and RevPAR (revenue per available room), vacation rentals are more difficult to standardize (Kirkos, 2022). Also, Airbnb’s business model is unique, as it relies on a platform connecting hosts with guests rather than owning the properties themselves. Another challenge in measuring Airbnb’s success is the impact of external factors such as the COVID-19 pandemic. In 2020, Airbnb’s revenue declined by 30% due to the pandemic’s impact on travel. However, the company was able to adapt quickly and expand into new markets, such as long-term rentals and virtual experiences (Yang et al., 2022).
In summary, Airbnb has achieved significant success in the vacation rental market, with high market share, revenue, and user engagement. However, the company needs help standardizing metrics and adapting to external factors, making it difficult to accurately measure its success.
References
Yang, Y., Nieto García, M., Viglia, G., & Nicolau, J. L. (2022). Competitors or complements: a meta-analysis of the effect of Airbnb on hotel performance. Journal of Travel Research, 61(7), 1508-1527.
Agarwal, V., Koch, J. V., & McNab, R. M. (2022). Airbnb’s Success: Does It Depend on Who Is Measuring? Cornell Hospitality Quarterly, 63(4), 519–527.
Kirkos, E. (2022). Airbnb listings’ performance: Determinants and predictive models. European Journal of Tourism Research, pp. 30, 3012–3012.
 write
write