For the longest time, unemployment and inflation have had an inverse relationship. It is well demonstrated in the Phillips curve. When the rate of unemployment decreases, inflation is high, and when the rate of unemployment increases, it reduces the inflation rate. This explanation makes sense because when there is a low unemployment rates, consumers have more money to spend on goods and therefore, the demand for goods rises, and so does the prices. When the unemployment rate is high, consumers have less money to spend. Hence, there is a low demand for products, which causes downward pressure on prices. Low product prices and decreased demand reduce inflation, while increased demand for a product and increased prices cause inflation. We will discuss the correlation that exists within the unemployment rate and inflations rate in the curve, in detail. We will also determine why the relationship is different in the long and short run. We shall Study the US “unemployment and inflation” on current application of the curve in the emerging issues.
The unemployment rate and inflation rate are related to the “Phillips curve.” It denotes the matters concerning “unemployment and inflation” is inverse in that inflation increases with the decrease in unemployment (Ho & Iyke, 2018). However, the relationship is not linear; when it is represented graphically; it takes an L-shape with inflation on the x-axis and unemployment on the Y-axis according to the short-run relations on the curve.
Figure1.1:
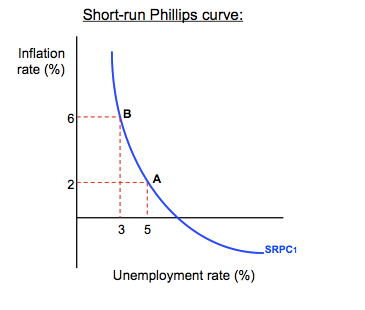
We notice an opposite relation when it comes to “inflation and unemployment” on the curve above. With the increase of one factor, the other factor decreases simultaneously.
The idea of the Phillips curve came into realization in 1958, and A.W. Phillips proposed it. His original work was on unemployment and change of wages in Britain. He confirmed an opposite relationship between unemployment and wages. This connection was helpful in Great Britain it was to other countries. Robert Solow and Paul Samuelson further explained Phillips theory to show the connection between unemployment and inflation. Since wages are directly involved with inflation changes, there must be a correlation between inflation and unemployment, just as there was a connection between salaries and unemployment (Ho & Iyke, 2018). Phillips theory was said to be predictable and workable. The Phillips curve predicted economic outcomes and the “fiscal and monetary policy” would be helpful in ensuring complete employment on high prices or reduce inflation in cases of low employment. When the government tried to use the information from this theory to control redundancy and inflation, it did not work.
In the actual sense, inflation and unemployment rates were greater than what the Phillips curve projected. This made the Phillips curve not to be reliable in some instances. The Phillips curve instead predicted stagnation, therefore not useful for policymaking. Stagnation means recession, unemployment and stagnant growth.
Figure1.2: U.S Phillips curve: Inflation versus unemployment rate
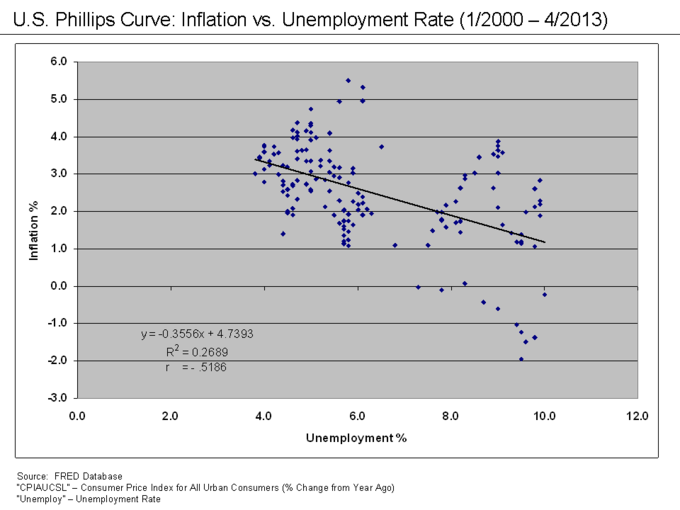
The above curve does not form an L-shape like Phillips curve would predict in the short run. This makes the Phillips curve not reliable in making policies.
When all the other factors are held constant, change in collective demand causes shifts on the Phillips curve. Aggregate demand is the demand for services and products at a particular time in the economy. The Phillips curve shares the same concepts with aggregate demand as with the relationship between unemployment and inflation. The effect on inflation is directly impacted by the rise or fall of prices, thereby affecting the aspect of aggregate demand. For this reason, the aggregate demand and the Phillips curve are related.
Figure1.3: Aggregate demand and supply curve versus the Phillips curve
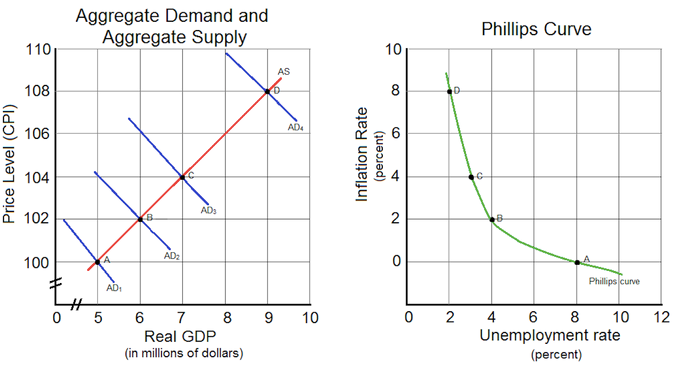
The price and the GDP, increases with increase in demand which is aggregated. It’s similar to the curve increase in inflation and decrease in unemployment.
“The long-run Phillips curve”
The curve is a straight up line on the natural rate of redundancy in the curve. On the long run, the “redundancy and inflation” rates are not in relation. “The natural rate theory” is basically the unchanging rate of redundancy. The study denotes that redundancy is only steady when the “natural unemployment rate” is equivalent when it comes to unemployment. If the unemployment rate is either high and a times low, the inflation rate will change accordingly. In case of any actions are taken to drop redundancy lower than the natural rate, it will lead to inflation. The employees will, in turn, regulate their incomes to meet their future prospects. This cause action, in turn, causes a movement on curve. “The natural rate theory” is applied in understanding stagnation, a theory that Phillips curve did not fully explain (Hazell et al., 2020). The natural unemployment rate is termed as the rate of unemployment that is consistent with the aggregate demand on the long-run. Steady inflation rate on redundancy is also called the NAIRU theory. It explains the shift of the short-run curve in the long run with the changes of expectations. According to economists, there is no correlation between redundancy and inflation in the long run. The relationship can only exist in “the short run”. When the information is represented graphically, the curve is perpendicular on “the natural rate of unemployment”. Actions to adjusting redundancy rates might cause a shift either upwards or downwards on the vertical line. Milton Friedman created the natural range of unemployment theory, and in consideration of the finding, economic guidelines formulated will only cause a provisional decline in unemployment, and the economy will, in turn, change when redundancy is “under the natural rate, inflation increases and decreases when the redundancy rate is beyond the natural rate.” However, if the redundancy rates are equivalent on “the natural rate, it stabilizes inflation.”
Figure1.4: The relationship “between the short-run and long-run Phillips curve”
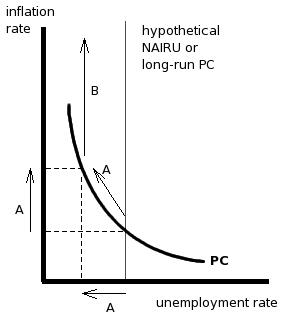
“The short run curve” shows that the relationship existing on unemployment and inflation. “The long run curve” shows that unemployment rate is unchanged with change in inflation.
In the recent 20 years, the Phillips curve has been flattened. This was according to a study that was conducted in 2018. The Phillips curve is said to have been disapproved by the government. In the last 20 years, the government has been much concerned about inflation. This cause of action has decreased the inflation rate in the US, disregarding the relationship between unemployment and inflation. Federal Reserve Chair Jerome talked about the Phillips curve during an interview, saying that the theory was valuable more than 40 years ago. However, it has become weaker in recent years because the government is trying to manage inflation which is the main component in the Phillips curve. It is essential to understand the usefulness of the Phillips curve because it offers different monetary policies to achieve sustainable employment and stability of prices. Powel also said that the policymakers have to look for other sources to determine the direction that inflation is said to take (Hindrayanto et al., 2019). He also denotes that the economy can handle much low rates of unemployment than what we expected without considering inflation. Some of the policymakers have suggested that there has been reduced price inflation in recent years, and in this case, the Philips short-run curve appears to have flattened. This shows a change in the correlation between unemployment and inflation. The real problem with the Phillips curve is not that it emphasizes the relationship between inflation and unemployment, but there is a discontinuity to this relationship with the changes in aggregate demand. However, some policymakers have not entirely disregarded the theory despite its proven not workable in today’s economy. The Phillips curve is not really dead; it can be used as an alternative in making monetary policies. Instead of concentrating on Phillips theory, policymakers should focus on the impacts of the monetary policy. By doing this, the government ensures stable employment and not maximum employment. We can achieve stable employment by creating a functional labor market.
There is a correlation that occurs when it comes to the matters related to unemployment, and the inflation rate, whereby we see that it is usually correlational. When we look at the issue at a glance, we know that it appears there is more complication that has occurred in the past 20 years. The rates of inflation and unemployment are among the most monitored indicators in the economy; here is where we look at the relationship that has been affecting the economy overall. When the unemployment rate is high, we see that the number of people looking for work increases at an exceeding rate, since there are a large number of available jobs (Picardo, 2021). The speed at which the supply is more is equal to the rate at which the demand is. When we look at the inflation in wages and the changes in salaries, we see a proxy for inflation when it comes to the rate of inflation in the economy. There is usually a high rate of available workers, but we know the need for employers to get a chance to bid for services. When the unemployment rates are high, we see that the wages remain stagnant, and it is nonexistent.
When the rates of unemployment are low, and the rate at which the employers are demanding, and as a result, it increases the supply. We see that the market has a fast rate of labor, and the employers are usually in need of paying high wages so that they may be able to attract the employers, and as a result, this leads to a high inflation rate (Picardo, 2021). Over this year’s we see that economists have made a study on the difference between the unemployment rates and the rates of inflation in the wages and the overall rate of inflation (Washington & Chen, 2019). When we conjunct this to the Phillips curve, we see that the initial economists that were present were compelling and had evidence showing that the unemployment rates and the changes being expected in the wages have lasted for an extended period. We that Phillip is making a hypothesis that explains the demand for labor and how few unemployed workers are. As a result, we see that the employers are then forced to ensure that they increase the rates at which they pay the wages of the employers.
On the other hand, we see that when the demand is low and the rate of unemployment is high, then generally, the workers present are usually very reluctant when it comes to accepting low wages. The second thing that has become a factor affecting the rates of wages is the changes that occur in the unemployment rates. When the economy is booming, employers are more vigorous while bidding for the workers (Picardo, 2021). It signifies that the demand they have for the labor can be either an increase or decrease of the same. In most companies, wages and salaries are key inputs (Washington & Chen, 2019). As a result, we see that as the salaries rise, they increase the price of the products and the services present in the economy, and as a result, the rate of inflation is usually higher. The conclusion is drawn from this relation is that the relationship existing on unemployment rates and this is instead of the inflation rates.
The Philips curve has been seen to be the first economists’ curve, which has helped compelling the evidence for the inverse form of relationship between the inflation of wage and unemployment. Philips has allowed the study of the relationship between unemployment rates and how wages change in the states. The implications of this curve have shown that the inflation rates that have the total employment rates have become the cornerstones of the monetary policies, which is in the central bank (Washington & Chen, 2019). The reserves in the U.S Federal have made objectives that ensure that there is a stable price that is medium and long term and leads to maximum employment, and the interest rates are high.
Some tradeoffs are present between the unemployment and the inflation rates caused by the economists, and they use the curve to tune to the fiscal policy or the monetary. The curve shows a specific curve that shows the levels of inflation and at unemployment rate and vice versa is also true (Picardo, 2021). It shows the possibility of aiming to achieve the desired balance regarding the desired levels in unemployment and inflation rates. If the unemployment rates were at 6%, which is through the fiscal and monetary stimulus, “the rates would be decreasing by 5%, and the impact on the inflation rates would be more negligible.” We also see that when the unemployment has fallen to a 4% which was from 6%, and the inflation rates correspond from a rise of 3% from that which was 1%.
Figure1.5: U.S. Inflation and unemployment rate
In this scenario, we see that the policies adopted here are a result of the unemployment rate is lower than “the natural rate,” which is termed as the long term unemployment rate, which is usually observed and has resulted in an increase in the rate of demand that will be encouraging the businesses and the manufacturers to increase the prices quicker. When the inflation rate quickens, the workers tend to source labor. As there are long-term wages, the high inflation rates accelerate. We see that the workers can provide the necessary work over a short-term basis. This is due to the wages that are causing a drop in the rates of unemployment.
On the other hand, we see that in the “long term, workers are completely conscious of the loss of purchasing power.” The willingness they have to the supply of labor diminishes, and the rates of unemployment rise to a natural pace. On the other hand, we see that inflation in wages and average prices continues to rise when it comes to inflation.
Over a long time, we see that the way inflation increases, there would be no benefit in lowering the unemployment rates. In the same token, we see a lower rate when it comes to inflation and shouldn’t inflict costs when it comes to the economy from a high rate of unemployment. As a result of the inflation, we see minimal impact on “unemployment rates in the long run.” We see an inverse correlation when it comes to the “inflation and the unemployment rates depicted in the Phillips work curve,” and this is in the short run; this is mainly experienced when the inflation rates are constant. Usually, it doesn’t hold onto the long terms due to the economy that is seen to revert to natural rates in which unemployment rates are adjusted to any inflation rate. This is because it is complicated more than it appears to be at first peek.
The relationship that is present on the matters relating to unemployment and inflation has been seen to have broken down over specific periods. In recent years, we see that the economy has been seen to experience low rates of unemployment, waging of gains, and low inflations (Is the Phillips Curve Still a Useful Guide for Policymakers? n.d.). We, however, notice that the Federal Reserve has ensured that it has engaged currently on the tightening of the monetary policy. They have also hiked the interest rates necessary for combating the possible inflation rates. There is also a lot to see on how these policies will aid in the moving of the policies and resulting in the impact of the prices, economy, and wages.
In conclusion, we see that from the research made from the study, for both the inflation in the inflation and consumer wages, is on how their test on this data, on this curve, has helped used the curve when it comes to the use of data when it comes to the annual data costs of the goods and services and for the wage while using data earnings that are hourly. They are necessary for helping the relationship on the differences between unemployment and inflation in the slack and tight labor markets. We, however, see that when they allow the different forms of effects on the unemployment, then they find the various forms of impact on the estimated outcome that is usually 1% of the decline in the unemployment rate and there is a natural rate that on a -0.12 is 1% point percent above it.
References
Hindrayanto, I., Samarina, A., & Stanga, I. M. (2019). Is the Phillips curve still alive? Evidence from the euro area. Economics Letters, 174, 149–152. https://doi.org/10.1016/j.econlet.2018.11.021
Hazell, J., Herreño, J., Nakamura, E., & Steinsson, J. (2020, October 26). The Slope of the Phillips Curve: Evidence from U.S. States. Www.nber.org. https://www.nber.org/papers/w28005
Ho, S.-Y., & Iyke, B. N. (2018). Unemployment And Inflation: Evidence Of A Nonlinear Phillips Curve In The Eurozone. The Journal of Developing Areas, 53(4). https://doi.org/10.1353/jda.2018.0077
Is the Phillips Curve Still a Useful Guide for Policymakers? (n.d.). NBER. https://www.nber.org/digest/sep19/phillips-curve-still-useful-guide-policymakers
Picardo, E. (2021, March 3). How Inflation and Unemployment are Related. Investopedia. https://www.investopedia.com/articles/markets/081515/how-inflation-and-unemployment-are-related.asp
Washington, D., & Chen, Y. (2019). Working Paper Series Congressional Budget Office Inflation, Inflation Expectations, and the Phillips Curve. https://www.cbo.gov/system/files/2019-08/55501-CBO-working-paper-inflation-expectations-and-phillips-curve.pdf
 write
write