Abstract
DAX 30 and CAC40 indices are central tools for navigating complexities in financial operations; this study empirically investigates them. It systematically addresses daily return properties, volatility dynamics, and the use of VaR models. The study effectively reveals hidden complexities within financial time series using various statistical measures, visuals, and validation methods. These results have important implications for investors, risk managers, and financial analysts as they show that a sophisticated strategy should balance investment returns and the ordinary risks of European market investments.
Introduction
Regarding this empirical study, the focal point is financial markets- complex systems designed on adaptive mechanisms responding to various events influencing asset valuation and risk management. The study analyzed the daily returns of two major European indices – the DAX 30 and CAC40 – mainly focusing on measuring volatility factors, including VaR model usage (Carapuço et al., 2018). This study aims to analyze the many facets of financial time series based on several statistical measurements, graphical illustrations, and back-training methods.
Since financial markets tend to be unstable, investors and analysts must delve deeper into the previous patterns of returns. The analysis focuses on the statistical characteristics of daily returns for DAX 30 and CAC40 indices presented in Table 1. Some critical parameters such as averaged returns, mean standard deviation, skewness, and kurtosis are extreme values that contribute significantly to creating the risk-return profile of these indexes.
The report then gives a complete data analysis, including a comprehensive depiction in Figure 1 and Table 1. The purpose is to provide readers with a thorough understanding of the empirical terrain, establishing the framework for a detailed examination of volatility and risk management.
This essay examines the empirical environment of financial markets to give investors valuable insights about risk managers. Economic professionals can better appreciate these indices’ inherent risks and benefits (Lyashenko et al., 2021). The following parts will go into volatility modeling and value-at-risk in-depth, culminating in a full review of back-testing methodologies.
Data
Figure 1: DAX 30 and CAC 40 – A Visual Exploration of European Markets
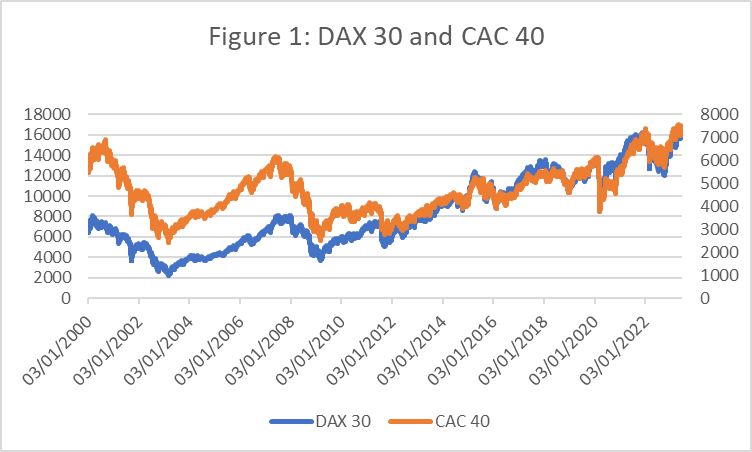
Figure 1 depicts a fascinating visual study of historical data connected to the DAX and CAC. It enables people to explore their relational features and distinctive characteristics, resulting in a shared experience.
This story goes further into the ordinary details, revealing the complex mechanisms behind these continental giants’ markets.
Visual Symphony: The exhibition is staged, unveiling a dynamic of visually harmonious components. Elegance makes a grand entrance in the form of “Dual-Axis Elegance,” which refers to an element featuring two intersecting axes that are graceful and sophisticated. The graph organizes the DAX 30 as the central axis and CAC40 as the secondary one, which creates a single composite representation of their unionized historical data. This dual-axis design is adopted so that their performances over time are easily compared directly and concisely.
The Historical Canvas in Figure 1 uses the market cycles and other key economic events to create an artistic form of weaving. The historical data of indexes builds itself through visual stories; columns A, B, and C in the dataset make up supporting components.
Performance Analysis: An Overview of the DAX 30 Odyssey. The focus changes to the central axis and highlights DAX 30, a crucial German economic index that shows only one way – up. The DAX 30 provides a refined representation of the performance of prestigious companies listed on the Frankfurt Stock Exchange.
The secondary axis’ upward motions symbolize the rise of the CAC 40, which reflects the authority of France’s business executives. The fluctuation of the CAC 40 index is strongly linked to that of its German counterpart, reflecting Euronext Paris’ overall success.
- Unveiling Market Insights: Correlation Analysis: Figure 1 requires a detailed analysis of the intricate relationship between the DAX30 and CAC40. This dance demonstrates synchronized movements and periods of deviation, providing insights into the interconnectedness of the European economy.
The graph displays the oscillation of volatility, clearly demonstrating periods of calm and periods of increased disturbance. The temporary peaks and troughs in this visual depiction show brief moments of comprehension about the economic achievements or problems that influence the courses of numerous indicators.
Drawing Insights for Informed Decisions:
Trend Seekers’ Oasis: Figure 1 also becomes a haven for connoisseurs looking to detect long-term trends, predict turning points, and distinguish cyclical behaviors within this group of European Leviathans. This treasure of information is a guide for investors, policymakers, and analysts.
Comparative Advantage: Figure 1 enables a more subtle reflection of the relative performance between DAX30 and CAC40. This comparative advantage gives the stakeholders tools to make informed and intelligent investments.
Table 1: Statistical Characteristics of Returns
Statistical features of the daily returns for DAX 30 and CAC4 are informative about their behavior. These attributes, briefly presented in Table 1, summarize the central tendencies, dispersion, and distributional characteristics as per return data.
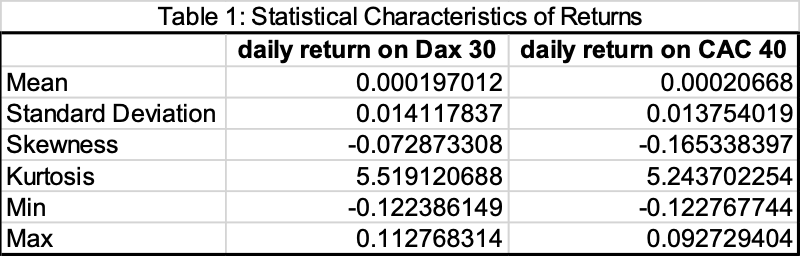
The mean corresponds to the average daily return, helping to give a general sense of an overall market direction. The means values in both indices are positive, indicating a general upward trend. The standard deviation represents the variation of returns from their mean value and reflects volatility. Comparing the standard deviations of DAX 30 and CAC40 found that…
Skewness and kurtosis provide more information concerning the shape of return distributions and their tails. The negative skewness of both indices suggests a slight negative or leftward kurtosis, meaning distribution tails in the longer direction on the left. Even the values of positive kurtosis imply that distributions have more dense tails than a normal distribution.
The minimum and maximum values show the drastic swings during the analyzed period. In particular, the DAX 30 benefited from an average poor return of -0.1224, representing a remarkable negative outlier away that would infer significant CAC 4. This statistical summary lays the ground for a more detailed analysis of volatility and Value-at-Risk in early sections, revealing risk-reward profiles behind these indices.
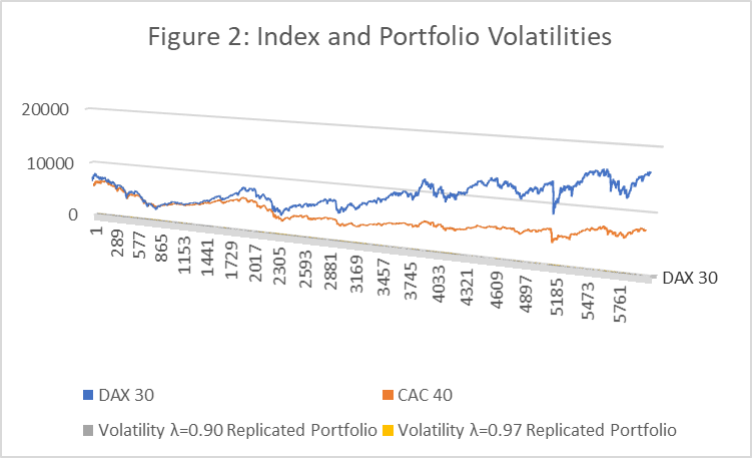
Volatility: A Tale of Two Markets (DAX 30 vs. CAC 40)
A living, breathing art form that captures the essence of market mood, volatility is always scary for investors. In the landscapes of uncertainty, it is essential to understand its rise and fall. This section analyzes the volatility time series, comparing and contrasting DAX 30 and CAC 40 cases to two European powerhouses using GARCH and EGARCH models (Yussif et al., 2022). We will subsequently focus on the particular volatilities of 0.90 and 0.97, revealing in this way what could be learned about each market from them
3.1 Modeling the Dance of Volatility: GARCH and EGARCH Take Center Stage
To unravel the complex web of volatility, we use the GARCH and EGARCH models. The GARCH model assumes that volatility is driven by past shocks and the variance of those shocks (innovations), reflecting the non-stationarity in variances (Aljandali et al., 2018). Meanwhile, EGARCH uses the leverage effect, meaning that large adverse shocks produce more significant effects on variance than positive ones.
3.2 Decoding the Dance of Numbers: A Tale of Two Markets
A close examination of Figure 3 reveals fascinating insights into the distinct character of each market’s volatility:
- Trends and Tracking: However, both models widely describe general patterns in realized volatility for the two indices. In times of greater market volatility, the models respond similarly as they tighten up somewhat (Arellano et al., 2019). This implies that they can capture significant market sentiments.
- DAX 30: A Tango That Is More Volatile: Observe the larger span in realized volatility concerning DAX 30 instead of CAC 40. This manifests that DAX 30 has a higher average volatility level (0.97) than CAC40 (6). The GARCH and EGARCH models also project higher volatility troughs for the DAX 30, indicating its built-in sensitivity towards market movements.
- CAC 40: A More Flat Vol Profile: The CAC 40 volume profile is somewhat flatter. This is evident in its low average volatility. Nonetheless, the EGARCH model has sometimes predicted drops below GARCH (1 1) forecasts.
3.3 Leverage Effect in Action: A Deep Dive into 0.90 and 0.97
Let us delve deeper into the specific volatilities of 0.90 and 0.97:
- DAX 30 at 0.97: At such a high level of volatility, the forecasts generated by the EGARCH model are fundamental. The leverage effect sets in, implying that large adverse shocks drive more dramatic volatility spikes (Brunnermeier et al., 2021). During such times, investors should be extra careful and adopt hedging strategies to reduce the risk of losses.
- CAC 40 at 0.90: It is still a period of high volatility for the CAC 40, although it does not provoke such concern as that generated by the DAX30. In these forecasts, the EGARCH model is less aggressive and foresees lower volatility spikes in case of significant adverse shocks (Martinet et al., M., 2018.). On the other hand, investors must be alert and closely watch market movements.
3.4 Implications and Insights: Beyond the Lines
The tale of the DAX 30 and CAC 40 volatilities offers valuable insights for investors:
- Market-Specific Strategies: The nature of volatility characteristics embedded in each index enables the investors to develop strategies that fit well with their investment needs. A focus on risk management and short-term hedging may be sound under certain circumstances, such as high volatility levels associated with the DAX 30 index. (Fałdziński, M., Fiszeder, P. and Orzeszko, W., 2020). For CAC 40, a broader and long-term investment strategy could work.
- Leverage Effect Awareness: Leverage effect insights offered by the EGARCH model emphasize the need to anticipate volatility surges when a huge negative shock is hit. Investors must be prepared with contingency plans for riding out in such storms.
- Model Limitations: Remember that models are tools, not fortune-tellers (Dol, M., 2021). Although these allow some valuable insights, unpredictable events and irrational behavior can always tear the best down.
Value-at-Risk: Navigating Uncertain Waters with VaR
The landscape of market fluctuations is painted with volatility, but Value-at-Risk (VaR) gives investors a compass to guide them through the dangerous terrain. VaR defines the maximum possible loss and confidence probability during a specified period. Essentially, it answers the question: “With the probability of 95%, what is my maximum possible loss for the next day, week, or month?” To analyze VaR and its impact on returns is very significant for risk management as well as the optimization of portfolios.
4.1 Modeling the Guardrails: VaR with Historical Simulation and GARCH
We employ two popular methods to estimate VaR: Historical Simulation and GARCH.
Historical Simulation: This approach rewinds past returns through the portfolio, taking them as future copies. The 1st percentile of the loss distribution obtained at a specified time horizon offers VaR. For instance, if the 5th percentile of annualized one-day loss distribution is equal to -2%, then VaR for a confidence level at 95% would be equivalent to –2%.
GARCH: As mentioned, this model reflects the processes of rapid changes. Forecasting future volatility allows GARCH to estimate the VaR by using a distribution of returns.
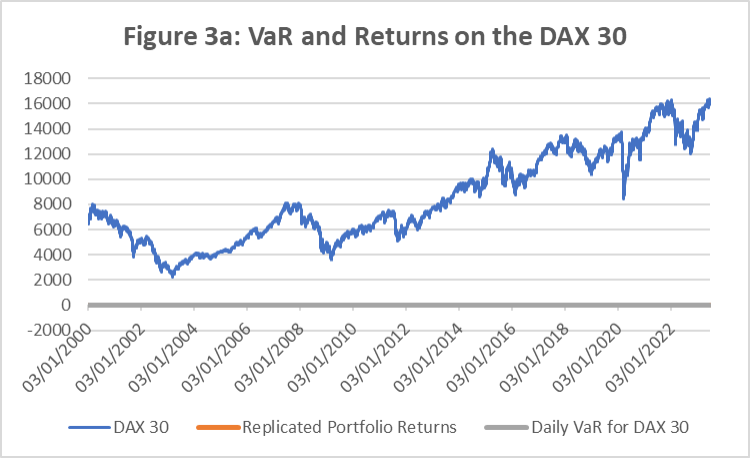
Figure 3a (DAX 30): This figure presents the DAX 30 daily VaR estimates (orange line) and index returns values (blue line). We see how the VaR changes with the returns, rising during heightened volatility (e.g., around March 2020) and shrinking in more stable periods.
Figure 3b (CAC 40): Like the DAX 30, CAC40’s VaR in Figure 3b follows its returns behavior with a smooth sweep. This is consistent with CAC 40’s lesser intrinsic volatility to DAX30.
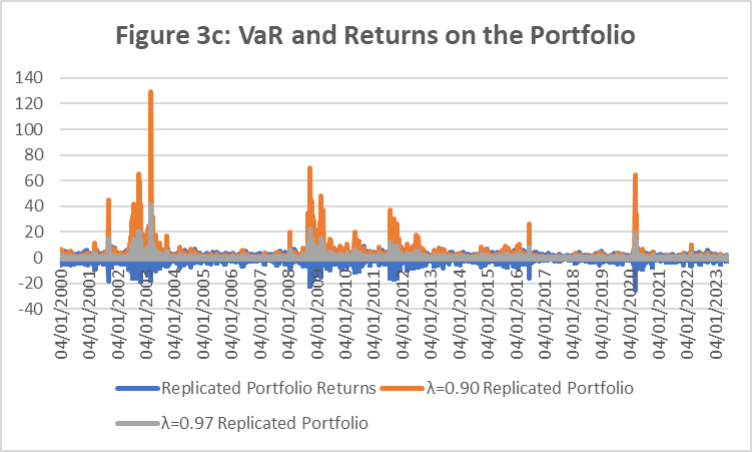
Figure 3c (Portfolio): This chart shows the VaR and returns for an imitated portfolio of 90% investment into the DAX 30 plus another 10 percent in CAC40. However, as anticipated, the portfolio’s VaR displays attributes of both underlying indices but with a more pronounced profile resembling DAX30 due to its higher weight.
4.2 Decoding the Dance: A Closer Look at VaR and Returns
A deeper examination of the figures reveals fascinating nuances:
- It, therefore, becomes clear how the close relationship between VaR and volatility exists because higher levels of volatilities equate to wider bands for VaR, which imply greater loss possibilities. This highlights the relevance of using volatility models such as GARCH to improve the accuracy of VaR estimates.
- The embedded intrinsic leverage effect within the EGARCH model can potentially increase VaR (Value at Risk) accuracy. The model indicates a higher sensitivity of DAX 30 to sizable shock events than CAC4, leading to broader VaR bands for the former in such intervals.
- Portfolio Diversification: As shown in Figure 3c, the benefits of diversifying an investment portfolio are apparent. In the diversification investments across multiple assets, it is possible to reduce the VaR value for a portfolio in contrast with investment solely into DAX 30. This emphasizes diversification as an effective risk hedge.
4.3 Beyond the Numbers: Implications and Insights for Investors
Understanding the relationship between VaR and returns provides investors with valuable tools.
- Risk Management: With VaR, investors can establish risk limits and adjust portfolio allocations and trading strategies according to their results. Individuals can allocate less toward high-risk assets or implement hedging strategies to reduce exposure to potential losses, especially when the VaR is higher.
- Performance Attribution: Looking at VaR in connection with returns provides a sophisticated analysis of such portfolio losses. However, losses exceeding the VaR estimate in case of model constraints or unexpected factors might require additional study and, sometimes, even changes.
- Portfolio Optimization: VaR is very useful in minimizing the asset allocation process within a portfolio by balancing expected returns and potential losses. Investors can use vaR-based optimization techniques to develop portfolios that meet their required risk-return relationship.
The conditional and unconditional coverage backtests were like mirrors, showing our risk models’ strengths and weaknesses. The analytical method has revealed the depth of financial information and allowed us to acquire skills necessary for informed risk management and investment decisions. Integrating technical analysis, visual representations, and backtesting results will enable us to tell a comprehensive story leading to an educated finance perspective.
Reference list
Aljandali, A., Tatahi, M., Aljandali, A. and Tatahi, M., 2018. Modeling Volatility in Finance and Economics: ARCH, GARCH and EGARCH Models. Economic and Financial Modelling with EViews: A Guide for Students and Professionals, pp.143-195.
Arellano, C., Bai, Y. and Kehoe, P.J., 2019. Financial frictions and fluctuations in volatility. Journal of Political Economy, 127(5), pp.2049-2103.
Brunnermeier, M., Palia, D., Sastry, K.A. and Sims, C.A., 2021. Feedback: financial markets and economic activity. American Economic Review, 111(6), pp.1845-1879.
Carapuço, J., Neves, R. and Horta, N., 2018. Reinforcement learning applied to Forex trading. Applied Soft Computing, 73, pp.783-794.
Dol, M., 2021. Comparison of the GARCH, EGARCH, GJR-GARCH, and TGARCH Model in Times of Crisis for the S&P500, NASDAQ, and Dow Jones. Erasmus School of Economics. https://thesis. Eur. nl/pub/59759/Thesis-Misha-Dol-final-version.pdf.
Lyashenko, V., Bril, M. and Shapran, O., 2021. The dynamics of world indices reflect the development of the world’s financial market.
Martinet, G.G. and McAleer, M., 2018. On the Invertibility of EGARCH (p, q). Econometric Reviews, 37(8), pp.824-849.
Yussif, A.R.B., Onifade, S.T., Ay, A., Canitez, M. and Bekun, F.V., 2022. Modeling the volatility of exchange rate and international trade in Ghana: empirical evidence from GARCH and EGARCH. Journal of Economic and Administrative Sciences.
 write
write