Introduction
There were many negative consequences to our drinking. One or repeated episodes of binge drinking can devastate our bodies. Everybody who drinks alcohol has probably felt the consequences of it in the short term, whether it be a hangover or a restless night. There are numerous immediate and future dangers associated with alcohol use. Adolescent alcohol use impairs cognitive and motor skills, making sound decision-making and coordinated movement more difficult. When a person’s blood alcohol content (BAC) reaches an unsafe level, the brain’s ability to govern basic activities like breathing is impaired.
Injuries and accidents were more common among alcoholics compared to non-drinkers. Even more concerning is that they are more likely to be a passenger in an event involving a drunk driver. Adolescents who partake in excessive alcohol consumption are more likely to engage in high-risk behaviors, such as unprotected sexual activity. It can cause unwanted pregnancies and STDs. Adolescent binge drinking is a serious issue in and of itself, but it’s also been connected to other risky behaviors like drug use. Getting drunk is a certain way to make yourself feel and look awful. Health problems, like rapid weight gain or loss, poor skin, disrupted sleep, and headaches, are more common among underage drinkers. The brain continues to mature during early adulthood, with many changes occurring during early infancy and adolescence. Including booze in that would be a bad idea. It can impair cognitive processes crucial to success in school, including memory, reaction time, learning capacity, and focus. A child’s potential and success in school could be stunted if they drink to excess. Overdrinking youth may be at increased risk for emotional and behavioral problems, including suicidal thoughts and behavior. Every parent wants their child to succeed in life, and one major factor in doing so is academic success. Statistical evidence suggests that young people’s drinking reduces the likelihood of this happening. Youngsters who begin drinking before age 13 are more likely to struggle academically, miss class, and even be expelled. They cannot restrain their impulses and have trouble spotting potential dangers. Violence and hostility are possible outcomes.
The more they drink, the more likely they will get into violent or destructive acts, which could result in their arrest and the start of a criminal record. They are more likely to try new things and take chances. Adding alcohol is not recommended, as it might lead to unsafe or precarious situations. As part of this project, we’ll look at current data from two secondary institutions in Portugal. Reports on student grades and surveys were used. It allowed for gathering information on various demographic, social, and academic factors. We’ll compare two DM algorithms (Decision Trees and Random Forests, for example). In addition, the best models will undergo a descriptive analysis to isolate the most telling characteristics.
Objective
The information was gleaned from secondary school pupils’ responses in mathematics and Portuguese language classes. It reveals intriguing information on students’ social lives, gender dynamics, and academic pursuits. You might use it for some form of EDA, or you could try to anticipate the final grade that students will receive. The data set was collected by a survey given to a sample of secondary school pupils. Age, gender, family size, educational background, alcohol usage, health, absenteeism, and grades are among the many categories covered by the data.
Data set.
We utilize a data set prepared by Paulo Cortez and Alice Silva of the University of Minho in Portugal that focuses on the experiences of Portuguese students. After nine years of elementary schooling, or “primary education,” students in Portugal can continue their education at the secondary level for another three years. The majority of kids choose the free public school system. The academic year of 2005-2006 provides the data for this analysis, based on two public schools in Portugal’s Alentejo region. As a result, the database was pieced together using data from two distinct places: traditional paper-based school reports with little detail; and questionnaires. The latter was created using closed-ended questions about a variety of factors thought to have an impact on student’s academic success. To receive input, the questionnaire was evaluated by educators and piloted with 15 students. Seven hundred eighty pupils completed the final version, which consisted of 37 questions on a single A4 page, during class. Of the latter, 111 responses were disregarded because they needed to include sufficient personal information. At last, it was all combined into two datasets: one for the Mathematics discipline (395 examples) and another for the Portuguese language (649 records) classes.
Classification Model
A decision tree is used to categorize the data. As a method of data analysis, classification is used to derive models that characterize meaningful data categories. Classifiers are models used to make inferences about categorical class labels (Kiu, 2018); there are two stages to the data classification process: the learning stage, when a classification model is built, and the classification stage, where the model is used to predict class labels for supplied data. A classifier is constructed to describe a fixed-in-advance schema of data categories or ideas. The classification algorithm “learns” from a training set consisting of database tuples and their associated class labels during this stage, also known as the training phase.
Several DM algorithms have been proposed for different categorization problems, each with unique goals and abilities. As a hierarchical, branching structure, the Decision Tree (DT) represents a collection of rules for classifying data in a hierarchical fashion. This representation can be converted into an IF-THEN set of rules for human comprehension. As a T unpruned DT collection, the Random Forest (RF) is a DT ensemble. The RF forecasts are constructed by averaging the T trees’ results, each based on a random feature selection from the bootstrap training samples. Although the RF is more (complicated) to understand than a single DT, explanatory knowledge can still be provided regarding the significance of its input variables.
KNIME Analytics Platform is a tool we utilize regularly. KNIME, or Konstanz Information Miner, is an open-source, modular software environment for mining, analyzing, and exploring data. As a result of the analytical phases being graphically represented, the full knowledge-discovery procedure may be modeled and documented in an approachable and thorough way. Create workflows with KNIME. Nodes in a workflow process data, and connections carry that data from one node to the next (Satyanarayana & Nuckowski, 2016). Data sources, typically databases that can be searched by specialised nodes, are the first step in a workflow. Imported data are saved in a tabular format with an indefinite number of rows that adhere to the column specifications and columns that are of a certain data type. These data tables are then transmitted along the connections to other nodes, which perform various forms of pre-processing on the data before constructing predictive models using various machine learning algorithms. It is possible to inspect the outcomes of an analysis workflow using a number of view nodes, each of which presents the data or trained models in a different way.
Data Preprocessing
Due to their massive size and likely origin from various, heterogeneous sources, databases in the real world are particularly vulnerable to noisy, missing, and inconsistent data. The quality of mining findings will also reflect the quality of the data used. Many methods of pre-processing the data are used by us: Data integration allows you to join two separate data sets by removing duplicates, clearing up errors, and removing noise.
Many factors may contribute to the presentation of false information. It’s possible that the tools utilised to acquire the data are flawed. We cannot rule out the possibility of data entry mistakes, both human and technological (Roy & Garg, 2017. Those who do not desire to provide personal information may intentionally enter invalid data for required fields. Hidden information. We employ a dataset that was collected and stored by a Portuguese professor, subject it to a test designed to identify any blanks in the data, and determine that there are none.
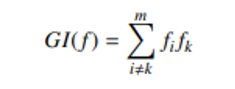
To determine if and how much alcohol is consumed by secondary school students. There are two alcohol-related characteristics in this dataset. The former refers to drinking on the job (Dalc), whereas the latter describes drinking on the weekend (walc). The amount of alcohol consumed by a single student over the course of a week is the only predictible attribute, therefore we created that. The following equation 1 combines the two characteristics.
![]()
The range of this new feature is similarly varying, somewhere between 1 and 5. To determine if a student is an alcoholic. If your BAC is below 3, you are not an alcoholic, and if it is above 3, you are. Using the Weka suite of tools allowed for a significant advancement to be made. Figure 1.1 shows that
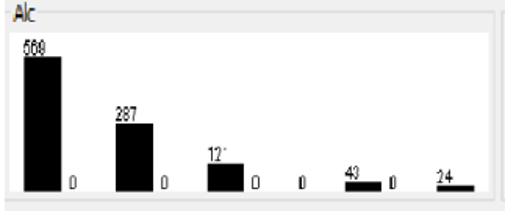
So, it is possible to determine which aspects are most intriguing. This interface allows us to easily alter data and obtain a statistical distribution.
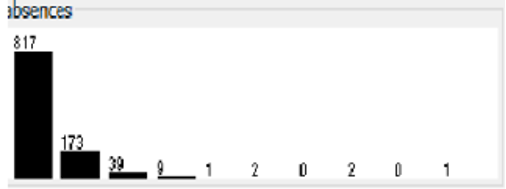
The rate of students absent from class is something we’re investigating. A student who misses class regularly is more likely to drink heavily. As a result, if his absences are chronic (more than 10 days), the value of this characteristic will be 0, and otherwise it will be 1 as shown in figure 2.
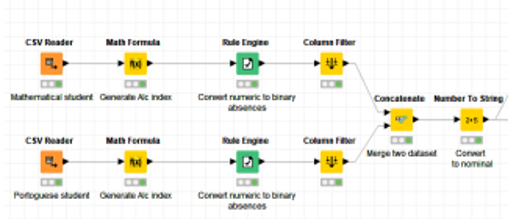
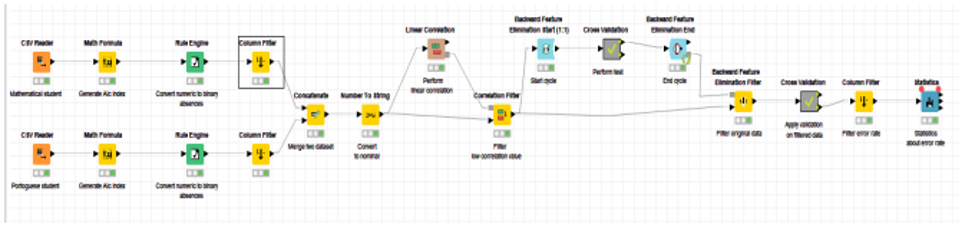
To accomplish this data reduction, we utilise the rule engine in KNIME’s workflow, the Concatenate component to merge the student-mat and student-por datasets into a single one, and the Nominalize component to transform the binary values of Alc and Fabs into nominal values for use in correlations.As shown in figure 3.
the correlation value is less than 0.35, it is filtered out using linear correlation. There were four columns of attributes (Fedu,G1,G2,G2) discarded since they had no bearing on the Alc score. We also get rid of the reverse function. Refer to Fig. 4. For this purpose, we employ a loop with cross validation. Data quality is examined by means of cross-validation.
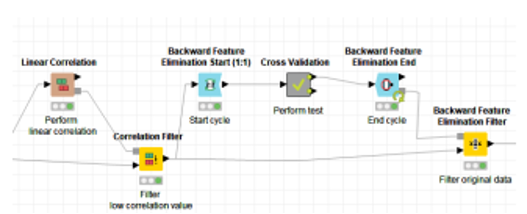
Employing a Random Forest technique. This process was used once again to make a forecast and check that prediction. In order to salvage the original data, the preprocessing step concludes with a filtering of backward elimination features. In this case, 11 columns of non-Alc attributes are removed.
Prediction analysis
The foundation of this work is made up of decision trees. As we saw before, they were put to use in the process of pre-processing the data set in order to improve the quality of the prediction, discover correlations between features, and so on. Cascaded IF-THEN statements provide the basis of a decision tree. The algorithm must determine which attributes will be used during the splitting process when it generates a decision tree. For such a task, the Split Criteria Index was developed. KNIME suggests using the Gini impureness measure and the Information benefit. The Gini impurity and the Information gain are both entropy-based measures that assess how frequently a randomly selected element from the set would be erroneously classified if it were randomly labeled according to the distribution of labels in the subset. After trying both, we settled on the Gini index because it produced the most statistically significant decision trees.
First testing was at C4.5. During development, the decision tree classifier goes through two stages: expansion and refinement.
The former method employs a recursive division of the data until each partition is either “pure” (all members belong to the same class) or sufficiently small (a parameter provided by the user), at which point the tree is constructed. The property the algorithm chooses to split on is what determines the partition. If the attribute being divided is continuous, then a threshold is used to make the division. However, it generates n sets for nominal attributes, where n is the total number of values that can be assigned to them. In the next step, we’ll perform some little pruning on the artificial tree. Statistical noise or variation that is unique to the training set is removed due to this pruning. In this example, we attempted both pruning and unpruning. The overall error rate was too high, so we gave up on it. Thus, we gave the Random forest technique a shot. An ensemble approach, in other words. To accomplish this, it employs a plethora of tree classifiers to produce a thicket of decision trees. The classifier is executed on a randomly chosen partition every time the method is run. We conclude that the 25 partition is an acceptable compromise between accuracy and performance. We opted for this classifier because of its excellent accuracy. The prediction then makes educated guesses about the alcohol characteristic once the learner builds the tree models. This strategy, also known as bagging, leverages the consensus of all decision trees to make a guess.
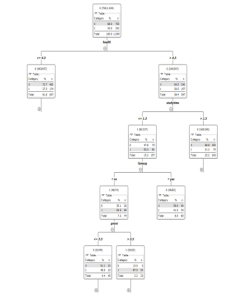
To evaluate the precision of our model, we apply a column filter to the cross-validation data we obtain (Error rate). The statistical value is located and viewed with the help of statistics. Figure 6 depicts the results of our model’s experimental validation.
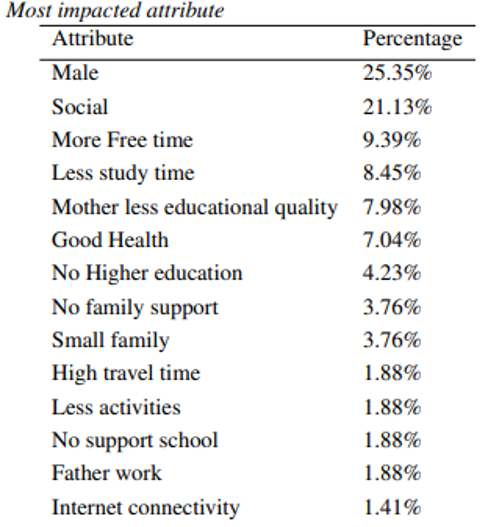
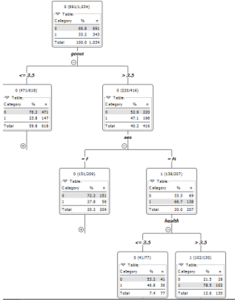
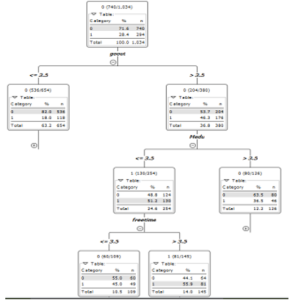
Following the completion of the data preprocessing, we selected Random Forest in order to get the highest accuracy and obtain our results. Twenty-five (additional) trees were used to symbolize our drinking identikit. Only trees with high values in relation to our forecast are selected. We identified many patterns among those trees, clustered their properties, and investigated their potential effects (we ignore some trees for significant value). Figure 7 and Graph 8 both depict the proportion of impact value.
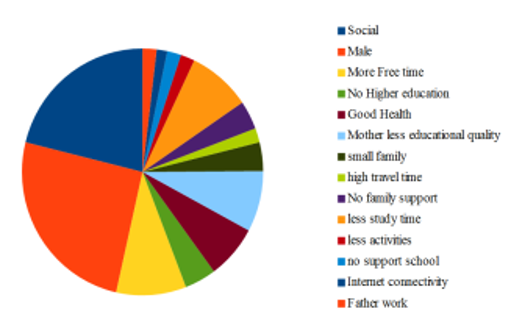
The formula for determining the exact percentage is as follows:
Conclusion
To put it simply, education is essential in today’s world. The field of education could benefit from the application of business intelligence (BI) and data mining (DM) tools, which enable the sophisticated extraction of insights from data. In particular, BI/DM strategies have been utilized in a number of studies to successfully reduce adolescent alcohol dependence and improve child lifestyle.
We’ve tackled the problem of foreseeing adolescent alcoholism by analyzing students’ historical academic performance alongside demographic, familial, and other information. Several DM targets and approaches were examined.
But, there are constraints here, such as the fact that we could only employ 10 folds. Because processing data for high numbers of folds requires more time and a more robust machine. Because some models have such low value, we limit our testing to just 25. That’s why we discount them to get the most accurate results. The findings suggest that it is possible to prevent the teen from ever trying alcohol.
This supports the idea that peer pressure has a significant impact on children’s conduct. However, research into the information offered by the most accurate prediction models has revealed that, in some instances, there are other qualities that are relevant, including those associated with the educational setting, demographics, and social context.
References
Satyanarayana, A., & Nuckowski, M. (2016). Data mining using ensemble classifiers for improved prediction of student academic performance.
Roy, S., & Garg, A. (2017, October). Analyzing performance of students by using data mining techniques a literature survey. In 2017 4th IEEE Uttar Pradesh Section International Conference on Electrical, Computer and Electronics (UPCON) (pp. 130-133). IEEE.
Kiu, C. C. (2018, October). Data mining analysis on student’s academic performance through exploration of student’s background and social activities. In 2018 Fourth International Conference on Advances in Computing, Communication & Automation (ICACCA) (pp. 1-5). IEEE.
 write
write