Abstract
With the increase in the vast volumes of data worldwide, data mining has been an interesting topic of discussion. Data mining involves the process where data engineers apply various techniques in getting insights into large volumes of data through analysis and visualization. This report involves a discussion of various data mining tasks for different datasets. The data mining projects in this report are performed through the use of both R and SAS software. The first data mining task includes the Association rule mining, then Classification, K-means clustering, and the last task will be Sentimental Analysis. Various models have been implemented for these tasks, such as random forest, Apriori model, and Clustering models.
Introduction
This report’s main objective is to gain insights and understand the various techniques that are utilized for data mining through the implementation of both SAS and R programming by the use of different data sets. The report covers the process that is implemented during the data mining process, which include creating models for predictions and visualization and measure of performance as well as working with different datasets trying to understand their pattern (Ray & Saeed, 2018). Information can be extracted from data and built some business insights from it such as purchase behaviour of consumers, text analysis from customer’s feedback either positive or negative, and many more. Therefore, this project presents the different techniques that businesses are implementing in their daily to day activities. This includes classification in terms of decision trees, association rules and k-means clustering to identify the occurrence of certain activities together and in groups, respectively, and lastly, the sentimental analysis for visual text analytics for the hotel reviews. The project the dashboard for this task in R shiny approach.
Task 1: Classification
Classification in R
For the classification task, I decided to work with the Random Forest Classifier. I used the bike-sharing dataset, which has both nine categorical data features and seven numerical data features. It contains the bikes’ registrations in terms of hourly count, which is between 2011 and 2012, by considering the available seasonal and weather condition information. There are 16 attributes for the dataset and approximate 17 379 records. For data preparation, I decided to label the categorical data in terms of scale variables. For example, for the weather conditions, one was coded to indicate good weather and 4 to indicate very bad weather. For the modelling preparation, the data is split into train tests and test tests. For train test, it takes 80% of the total data, and the test takes 20% of the total data available. Then I used the random forest library to create the Random Forest Model, as shown below.
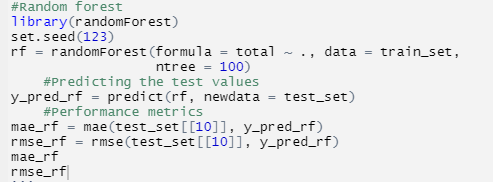
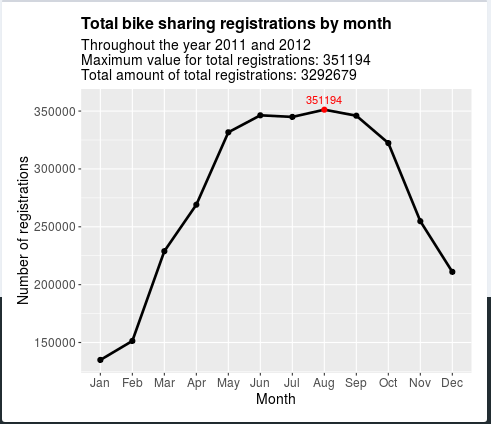
From the Random model, it can be visualized that August had the highest number of registrations of 351194.
Classification in SAS
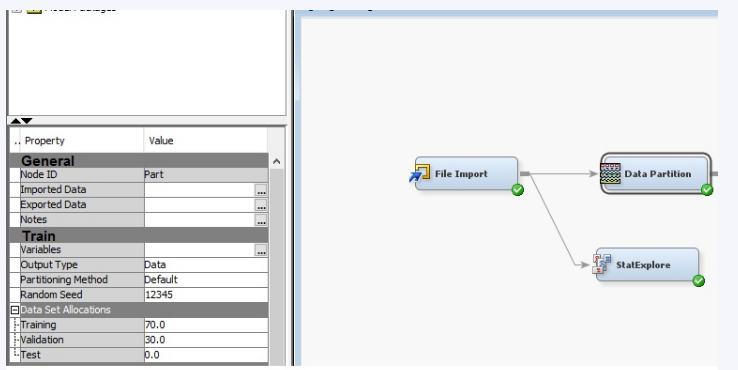
To perform the modelling and classification in R, the same dataset used in R and which was cleaned was imported into the SAS Enterprise Miner. The dataset was split into two, 70% for the training data set and 30% for the validation dataset.
Next, I used the statExplore option to check the skewness, as illustrated below.
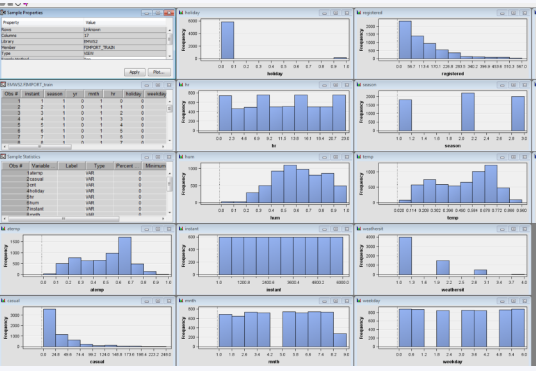
From the Figure above, it is clear that the registered bikers, the hour of the day, casual bikers, and temperature were the essential variables to look at in model predictions.
Task 2: Association Rules Mining
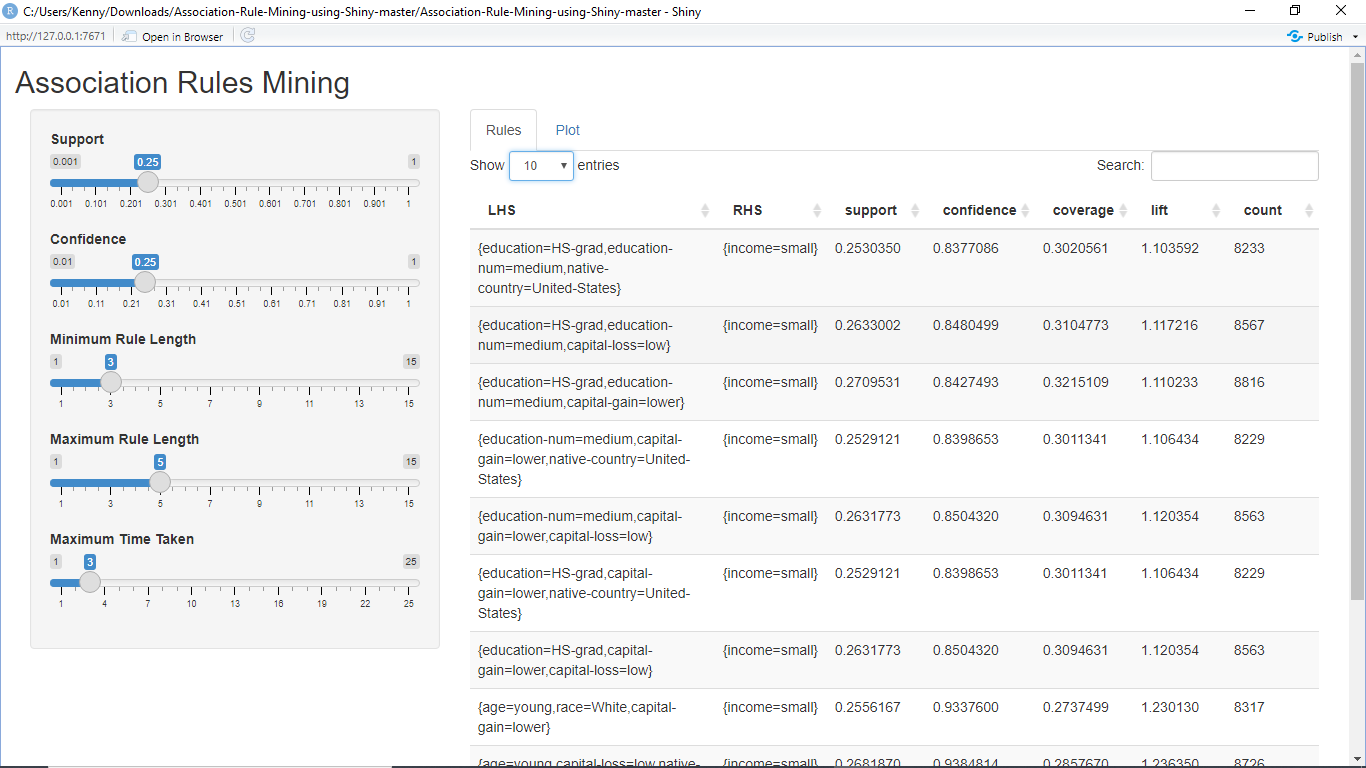
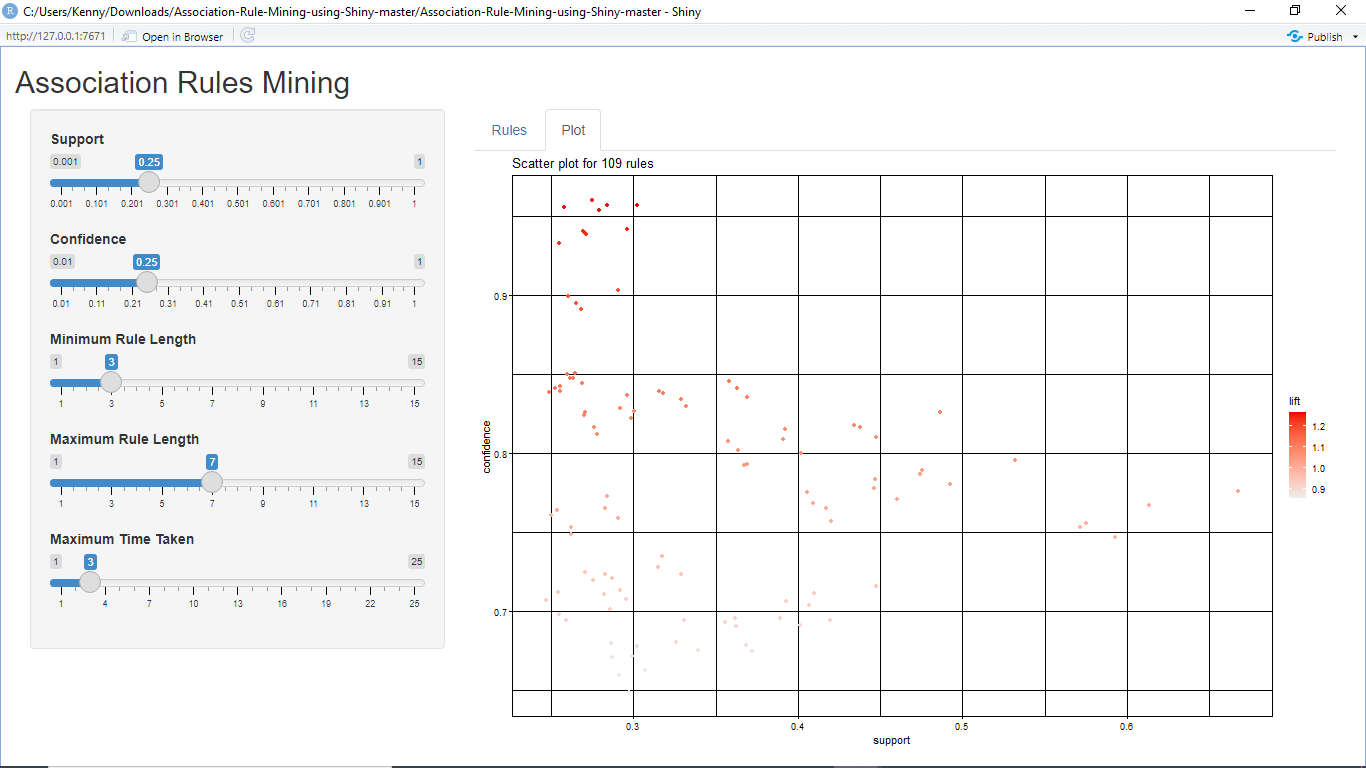
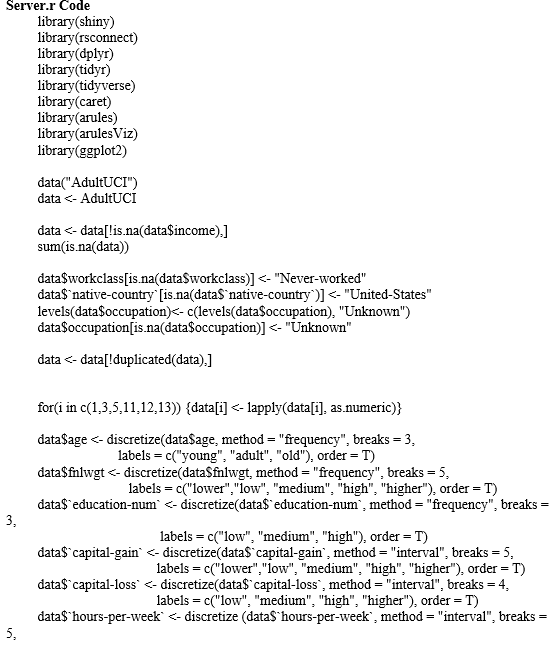
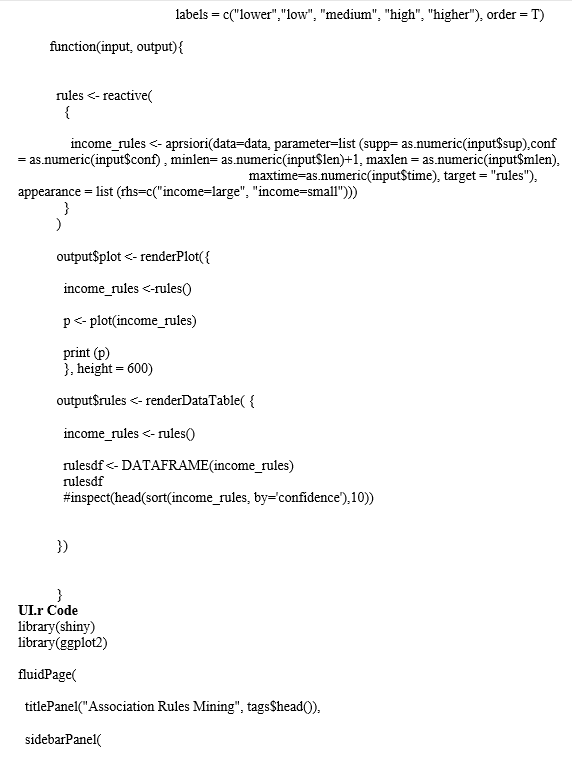
This task will involve the analysis of the AdultUCI dataset through the utilization of the rules package and provide a presentation of the findings through the R Shiny App. With the use of the AdultUCI dataset, the report will present the findings on the predictions of the income range and the associating factors that cause the outcome. Change of parameters through the R Shiny App will be helpful for experimenting with the outcomes in different cases, as shown in the Figure below.
SAS Association Rules Mining
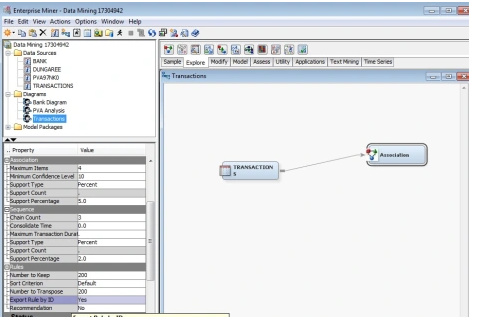
To perform the associations rule mining, I implemented a transactions.csv dataset in SAS Enterprise Miner. I imported the transactions dataset into the SAS miner to perform the Market Basket Analysis. First, I created a new Diagram and dragged the Transactions data source as shown in the Figure below.
Then I generated a Rule Description table as illustrated below.
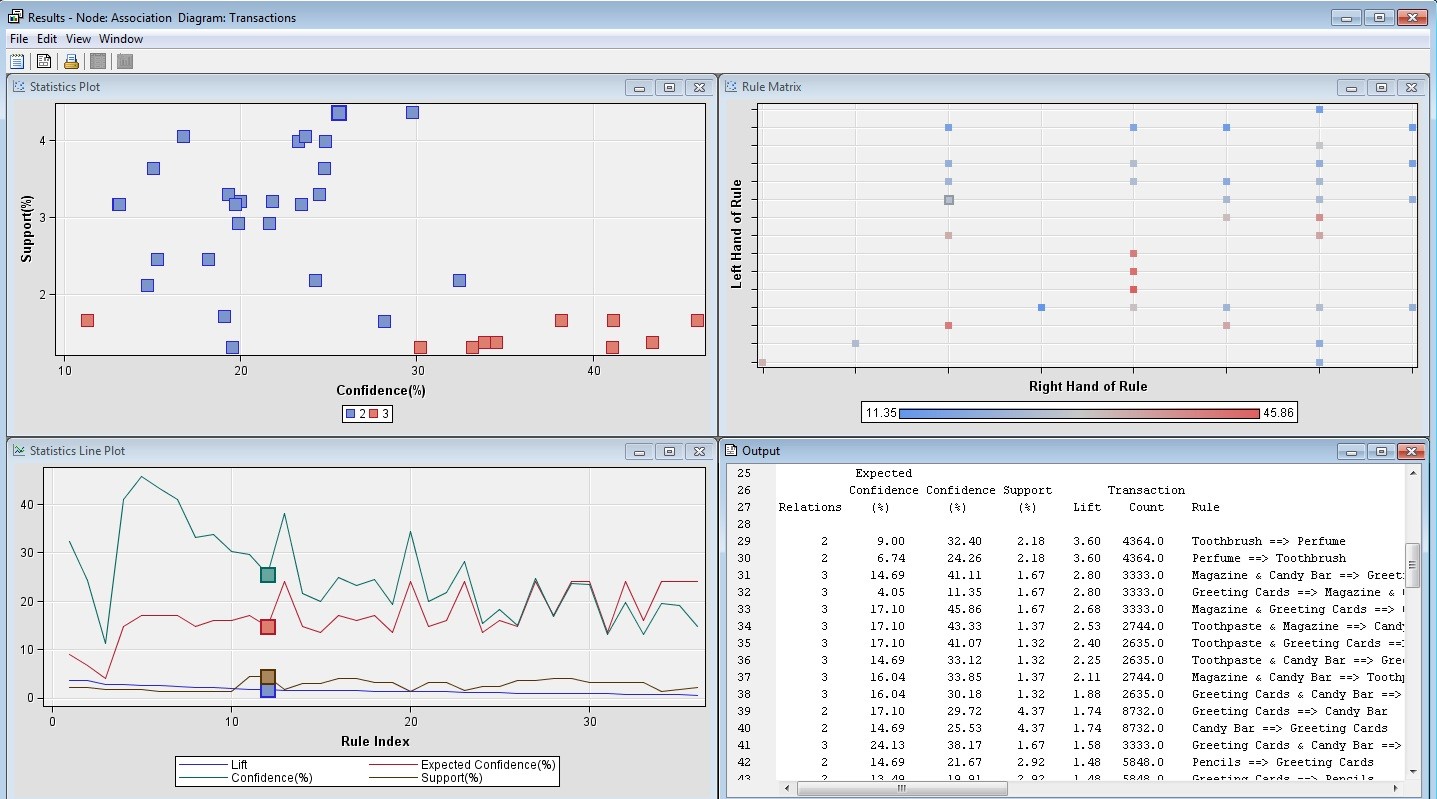
From the Figure above, it is clear that there is no relatively high support and confidence of buying particular items per transaction since the highest support is at 4.5% and the highest confidence is at 45%. However, many variables seem to have a very high lift of up to 3.60 and they are very positively correlated, which means that they are more likely to buy each other.
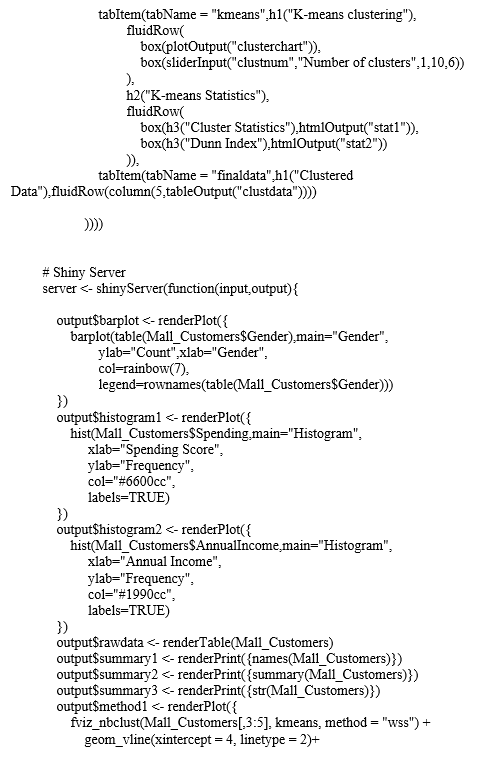
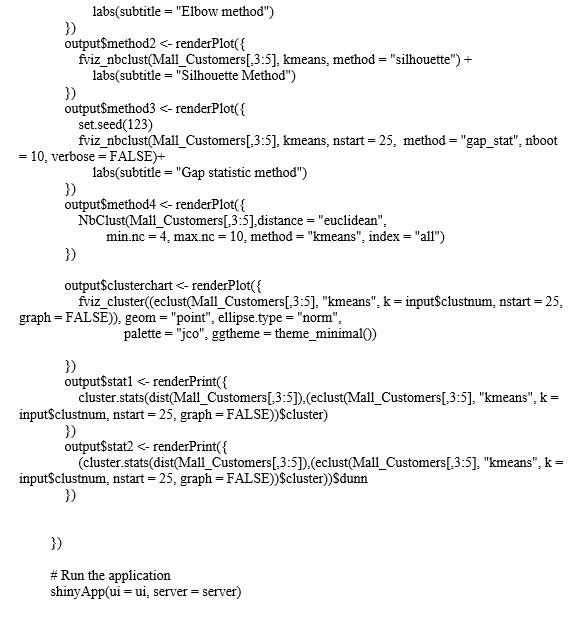
Task 3: K-Means Clustering
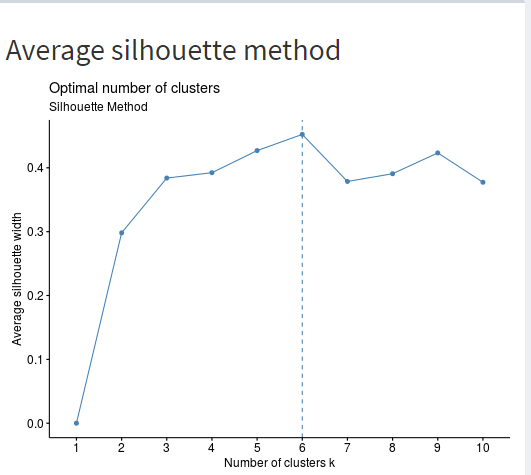
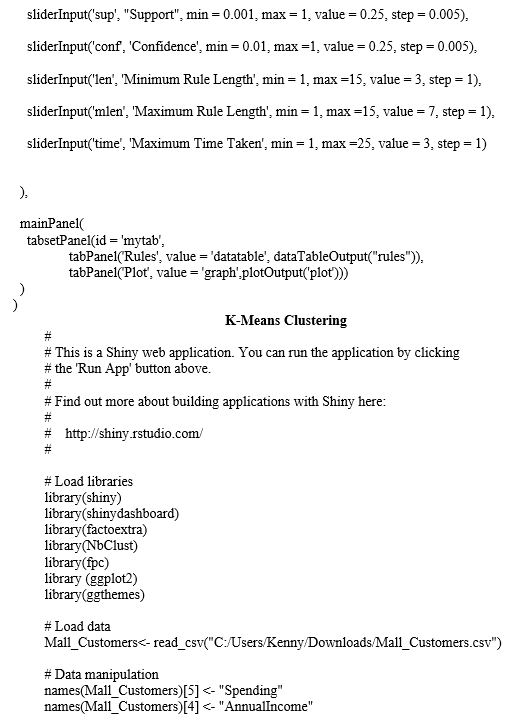
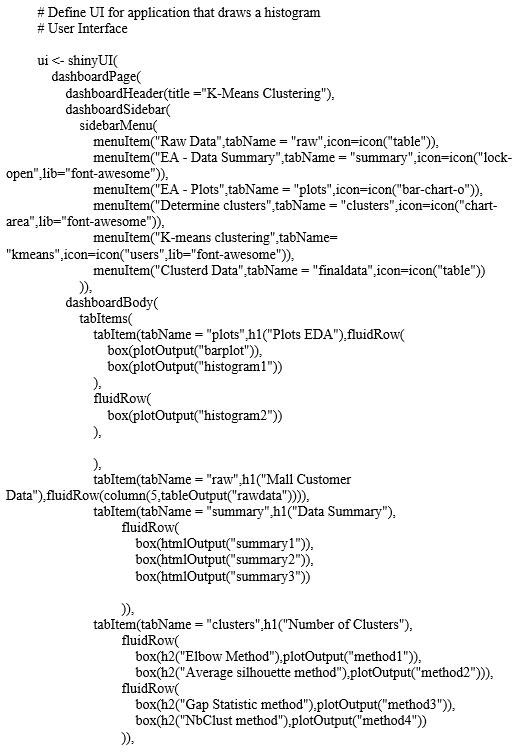
For this task, I used the Mall_Customer dataset with the aim of creating clusters that help in classifying the customers in terms of their income and spending. The K-means clustering for the mall customer dataset has been presented on the R Shiny Dashboard. First, to identify the optimal clusters for the model, I created the elbow curve plots through the use of the average silhouette method, where the optimal number of clusters is 6, as shown in the Figure below.
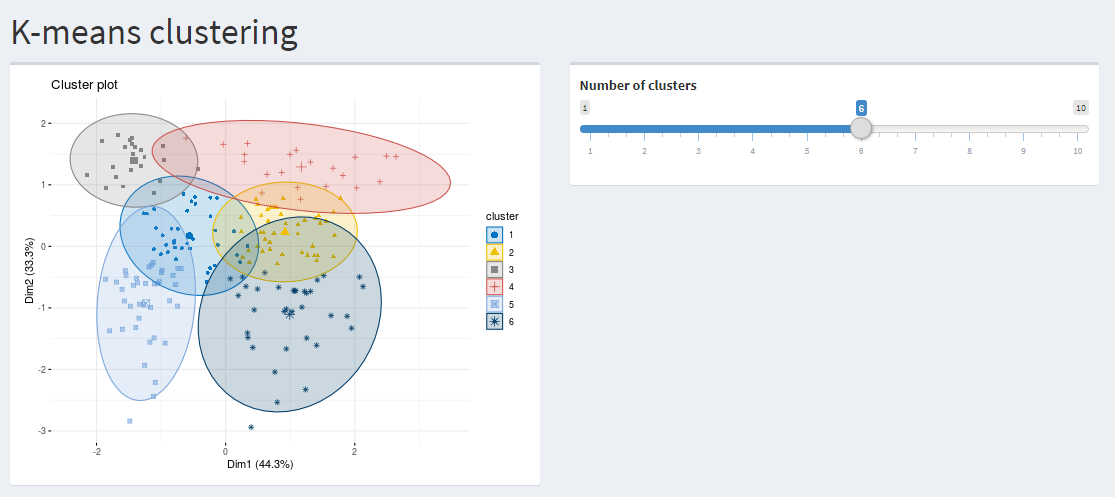
I import and instantiate the stats library to fit the K-means model to specify the number of clusters for the dataset in this task. For the annual income and spending variables and with the clusters being six, the below plot has been visualized using the ggplot.
SAS K means Clustering
To perform the K-means clustering in SAS Enterprise Miner, the first step involved exporting the dataset Mall_customer into SAS which I labelled Aggregation.
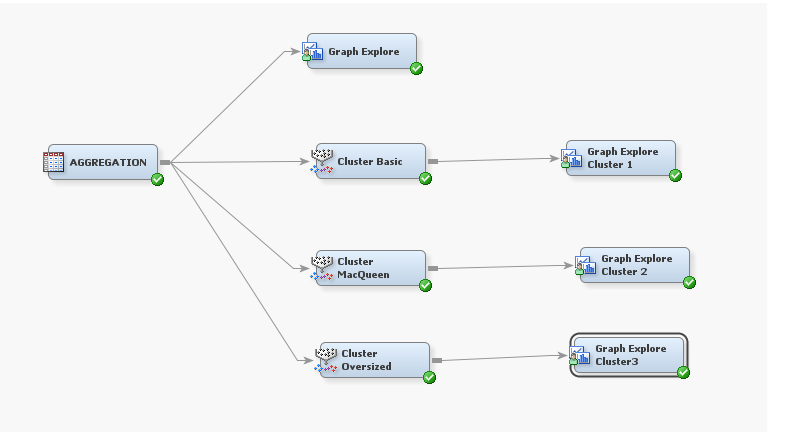
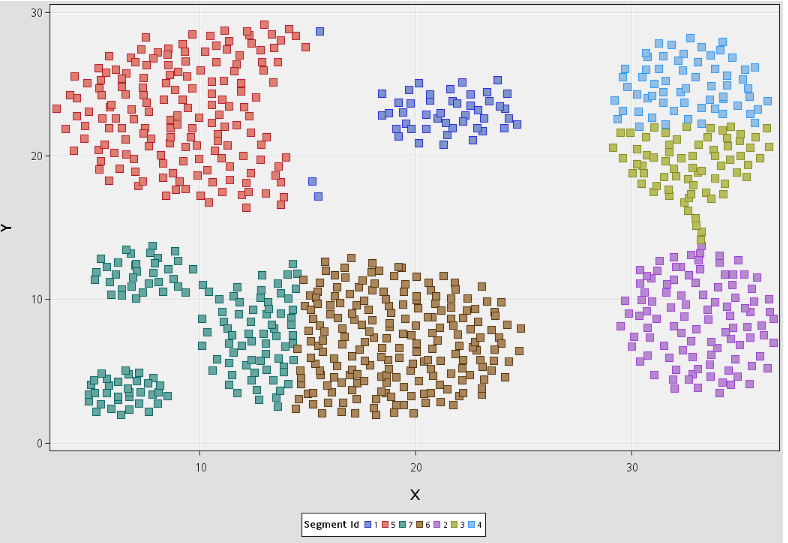
The second step involved data exploration where the dataset was explored in terms of finding the descriptive statistics and finding the missing values if any from the dataset. The third step involved data preprocessing where I standardized all the analysis variables to a mean of zero and standard deviation of one. Lastly, I performed the K-means clustering analysis process for with K=7 to have the output as shown below.
Task 4: Sentiment Analysis Hotel Reviews in R and SAS
Sentiment analysis is the data mining technique that is used to extract text analysis and classifies them either to be positive, neutral, or negative (Kauffmann et al., 2019). Sentimental analysis is mostly used by businesses to get an understanding from their customers on how they view the services or products that the business provides them with. It is more concerned with better understanding their feedback. In this task, I conducted sentimental analysis on the tourist accommodation reviews dataset. The dataset is made up of ID, Review_Date, Hotel_Restaurant_Name, and Reviews variables. First, the data needs to be imported into the R studio for analysis. After import, the main interest variable for the case is the Review column, where I will be able to do the sentimental analysis and gain some interesting insights. Second, a corpus that involves the variable Review text collection is created. Third, data cleaning is performed to remove numbers, punctuation marks and make sure all the text is presented in lowercase letters. Fourth, it includes the text stemming activity which involves converting text into its root form. Lastly, to have a visual of the text in reviews, a world cloud plot is created, as illustrated below.
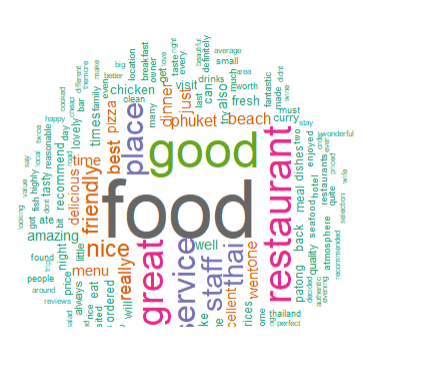
From the word cloud, it is clear that the word food is highly used, then good, then great, and lastly, restaurant.
In SAS, the full process of the sentiment analysis is illustrated in the Figure below.
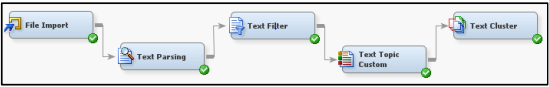
The cleaned data from R was imported to the SAS enterprise miner for analysis.
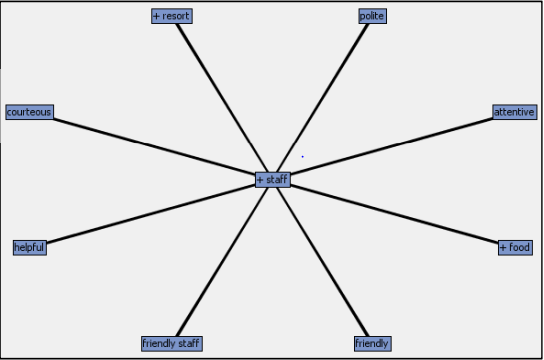
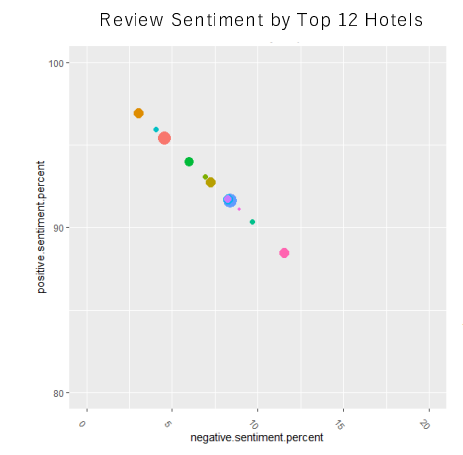
In SAS, various concept links to specific words were illustrated, as shown in the case of staff above. The reviews by month were also visualized as in the Figure below. As clearly illustrated, the positive sentiments between 2017 to 2018 remained at an approximate value of 90%
Conclusion
With the fast change in the digital world where businesses are collecting vast volumes of data each day, it is clear that data mining is essential to give them some business insights in terms of their products and services and help them in making decisions. There are several data mining applications available to perform the analysis, as illustrated in this project where both SAS and R has been used. It is possible for businesses now to be able to survive in a competitive environment through the implementation of the right techniques of data mining, either by association rules mining, clustering, classification, or sentimental analysis.
References
Kauffmann, E., Peral, J., Gil, D., Ferrández, A., Sellers, R., & Mora, H. (2019). Managing marketing decision-making with sentiment analysis: An evaluation of the main product features using text data mining. Sustainability, 11(15), 4235.
Ray, S., & Saeed, M. (2018). Applications of educational data mining and learning analytics tools in handling big data in higher education. In Applications of big data analytics (pp. 135-160). Springer, Cham.
Appendix
Classification
 write
write