A relatively narrow product in the market means it is available only to a single specialty audience. It might be because the product is so specific that it does not apply to anyone outside the target niche or because the item itself is expensive. In either case, this product has no real value for any broader audience. The most famous example is specialized cars like Ferrari and Lamborghini. The use of smartphones is applicable in this situation. For example, the iPhone is an alternative to other, more traditional phones. The idea and concept were to create an easy-to-use device that individuals could enjoy regardless of how tech-savvy they were. However, it is only used by a few people, or rather it does have a broad product mix as it is expensive and not all people can afford it. The study aims to evaluate the sales performance of smartphones before and during the COVID-19 period examining the sales and prices of smartphones, their marginal cost and marginal revenue, transaction cost, opportunity cost, usage, scarcity, consumer theory, demand and supply shifters and make future predictions on the same.
Smartphone Usage
Smartphones have changed how people live and do business today. Accessing information at people’s fingers has made everything much more convenient. Early models were plagued with poor battery life, slow processors, and limited storage capacity. Over time, the major players in the market have addressed these issues and made significant improvements in what makes them appealing to consumers. Smartphones are mobile phones that are larger, more advanced, and more powerful than standard feature phones. Since the launch of the iPhone by Apple in 2007, there has been a shift from traditional computers to smartphones and tablets as more efficient tools for everyday tasks. It can be used for communication via email, short messaging service (SMS), text messaging, or social networking services. They are distinct from feature phones, designed for only voice calls and text messages. Smartphones generally include both traditional mobile telephone capabilities and an operating system capable of running general-purpose applications as it functions as a camera, video recorder/player/editor, GPS navigator, and even a notebook computer.
The American smartphone market is dominated by two major companies, Apple Inc. and Samsung. These companies have been able to entice customers with various smartphones under price ranges to retain their customer base and increase revenue. The market of smartphones has been proven to have a more significant presence in business than other sectors. The sales volume of smartphones in the U.S. has had an upward trend for the last 20 years. It can be attributed to its multiple utilities that allow individuals to store and retrieve data, exchange information via email, use social media sites including Facebook and Twitter, surf the Internet with ease, play games, and listen to music at their convenience as it comes with excellent battery life (Flaten et al., 2018). Therefore, the significant revenue drivers are: 1) increasing smartphone penetration in the developing world, 2) increasing average selling prices (ASPs), which have increased significantly over the last five years because of premium phones with higher processing capabilities and high-resolution displays, and 3) the growing popularity of apps as a source of revenue.
Trends in Smartphone Sales Before and During COVID 19
Before COVID-19
The COVID-19 pandemic outbreak is a positive supply shock that has affected the growing smartphone business. Before COVID-19, most consumers were familiar with the global adoption of smartphones, tablets, and other connected devices. Manufacturers started to sell mobile phones in 2001, and since then, global use has been on a steady incline (Purwanto & Sudargini, 2021). Mobile devices have become essential for many people worldwide. The sale of smartphones in the United States before COVID-19 resulted in mass consumption of mobile devices, with many consumers upgrading from basic phones. It led to a shift in demand for smartphones with features that would allow mobile computing and video watching (Purwanto & Sudargini, 2021). The increased demand for smartphones sent their prices from low-cost devices to premium phones costing $1,000 or more (Purwanto & Sudargini, 2021). When the COVID-19 pandemic swept the world, several manufacturers reduced their phone supply and redirected their efforts to producing antiviral medication. Besides, restrictive measures resulted in the shutdown of the retail supply chains, causing a reduction in sales.
Figure 1 and Table 1 illustrate how the sales revenue of smartphones has increased rapidly in the last 20 years (Statista, 2022a). The first smartphone, launched in 2005, had $3.8 billion in sales. The sales have been on an upward trend up to 2018, when a sale revenue of $79.1 Billion was recorded (Statista, 2022a). The sales revenue remained constant from 2018 to 2020, with a slight decline in 2019 due to the COVID-19 pandemic. Also, the sales revenue declined in 2021 to $73 Billion, with a slight recovery in 2022 (Statista, 2022a). The data on the sales of smartphones in the period 2005 to 2016 shows a steady increase in sales. It is because millions more people in different parts of the world are now connected to the Internet than before, and firms have to provide them with a product or service they want and need (Statista, 2022a). Since COVID-19 started in 2019, the sales of smartphones have dropped drastically, as shown in the first few months of 2020 and 2021, by a total of 6 billion us dollars (Statista, 2022a). However, this number has risen significantly since then. Similarly, figure 2 indicates an exponential growth rate of sales revenue between 2005 and 2018, with a high of 67% in 2007 and 53% in 2010 and 2011 (Statista, 2022a). Also, due to the onset of the COVID-19 pandemic, the growth rate declined by 2% in 2019 and 8% in 2021 and recovered by 2% in 2020. Nevertheless, the growth rate has since recovered, as a rise of 2% was recorded in 2022 (Statista, 2022a).
| Year | Smartphone sales (in Billion $) | % Change |
| 2005 | 3.8 | |
| 2006 | 5.19 | 37% |
| 2007 | 8.65 | 67% |
| 2008 | 11.39 | 32% |
| 2009 | 11.73 | 3% |
| 2010 | 18 | 53% |
| 2011 | 27.5 | 53% |
| 2012 | 33.7 | 23% |
| 2013 | 42.96 | 27% |
| 2014 | 48.87 | 14% |
| 2015 | 52.92 | 8% |
| 2016 | 55 | 4% |
| 2017 | 69 | 25% |
| 2018 | 79.1 | 15% |
| 2019 | 77.5 | -2% |
| 2020 | 79 | 2% |
| 2021 | 73 | -8% |
| 2022 | 74.7 | 2% |
Table 1: source; Statista (2022a) Smartphone sales in Billion U.S. Dollars 2005-2022
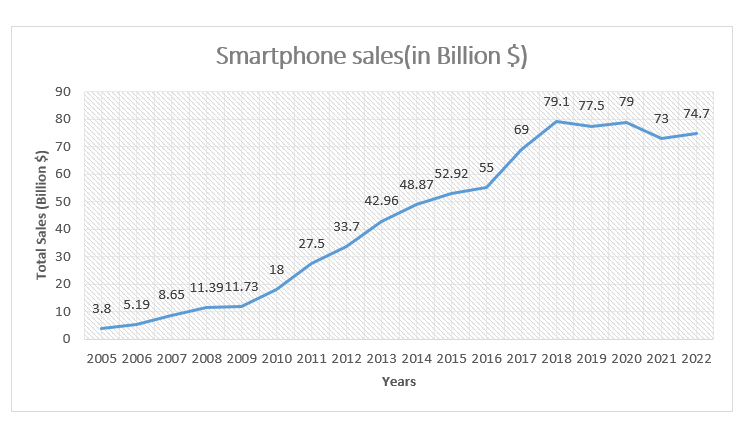
Figure 1: source; Statista (2022a) Smartphone sales in Billion U.S. Dollars 2005-2022
During Covid-19
As the pandemic continued, the sales of smartphones were significantly low after the closure of schools and government offices. Multiple setbacks have hit companies like Apple and Samsung due to the COVID-19 pandemic outbreak. The restrictive measures ensured people spent more time at home and not much time going out, so they consumed food, drinks, snacks, and non-electronic items to stock up on indoors (Xu et al., 2020). Nonetheless, people are slowly recovering from the deadly virus and beginning to invest in their businesses again. Smartphone sales during this time will likely increase once COVID-19 is gone, which is a sign of positive sign for future recovery. Thus, the negative change in sales is due to the unknown fate of the COVID-19 virus and people’s social behavior changes during this time.
Figure 2 explores how the sale of smartphones has evolved in (%). In 2006, 37% of people bought smartphones (Statista, 2022a). By 2011, this number had increased to 53%. However, mobile computing devices had begun taking over the market; they experienced a fall ass from 2013, when only 27% of consumers purchased smartphones, till 2017, when the sales increased to 25% (Statista, 2022a). Due to covid 19, there was an adverse change in the sale of smartphones as people opted to buy essential commodities over smartphones (Statista, 2022a). As the pandemic was controlled, the sales of smartphones are slowly coming up. Currently, 2% of consumers are purchasing smartphones, and the sales are expected to keep rising as the years go by.
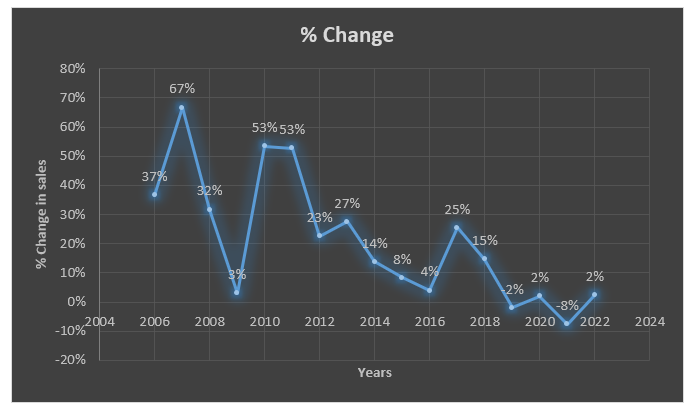
Figure 2: Source Statista. (2022a)- % change in smartphone sales
Price of smartphones
For the past decade, smartphones have been getting far more affordable, with average selling prices (ASPs) coming down both in the entry-level and upper mid-tier categories. However, in the wake of the increasing cost of manufacturing amid the post-Covid-19 scenario, prices of smartphones have seen a sharp spike. This trend has led to a change in the market dynamics as players shift toward higher-value products and target customers willing to spend more on their devices. The impact of the COVID-19 pandemic on the electronics supply chain has resulted in a massive jump of 27% in the price of smartphones (Dutta, 2022). With COVID-19 bringing down the supply chain and sending ripples through markets, customers here have seen the prices of smartphones double. The average selling price of smartphones in India has increased steadily for over a year and is currently at its peak. Data from International Data Corporation (IDC) indicates that, at the end of the March 2022 quarter, the average selling price of smartphones in India stood at Rs 19,000 – up from Rs 15,100 at the same time two years ago when the pandemic constraints were implemented.
The industry is facing increasing pressure from various external factors like lower demand, currency devaluation, and supply chain disruptions due to a shortage of semiconductors, jacked-up prices of chipsets, disruptions in ocean freight, and lockdowns which have led to the increase of production cost by 20% thus forcing them to increase their prices(Dutta, 2022). The inflation resulting from the Covid-19 epidemic has affected the smartphone market by forcing domestic brands like Xiaomi, Samsung, Realme, and Oppo to hike prices and stalling sales growth in phones between Rs 10,000 and 15,000 (Dutta, 2022). As a result, the worldwide smartphone market has seen an overall slowdown as consumers cannot afford expensive smartphones due to the economic slowdown and less income.
When it comes to smartphones nowadays, the price tag can be more than a small fortune. It can put much pressure on consumers looking for affordable devices while remaining loyal to their longtime favorite brands. The demand for affordable devices is rising as vendors try to capture the market share. The high demand for smartphones, especially in sub-Rs 18,000 price segment, resulted in a drop of shipments by 16 percent in January-March over the same quarter last year. While the mid-range segment of Rs 18,000 – 27,000 increased in the overall smartphone market to 18 percent from 14 percent in the last year(Dutta, 2022). The mid-premium segment that comes under Rs 27,000 – 45,000 increased by 75 percent year on year, while the premium segment that comes under Rs 45,000 all smartphones by 5% with 60 percent of shipments coming from Apple (iPhone) (Dutta, 2022). Therefore, higher prices of smartphones have affected the average buying cycles in recent years.
Theory of a Firm
The theory of the firm is an economic theory that states a firm’s goal is to maximize its profits. The key to understanding the theory of the firm is that it considers transaction costs and assumes they are unavoidable (Jensen & Meckling, 2019). The smartphone industry has the structure of a dense oligopoly, and there are five leading manufacturers: Apple, Samsung, Huawei, L.G., and BYD. The market can be divided into high-end, mid-range, and low-end segments, each with a different price range. Compared with other competitors, there is only one Apple and Samsung in terms of scale and quality, while the rest are very similar in terms of performance. Apple’s iPhone series is still the best seller worldwide, while Samsung started at a very late period when it comes to smartphones, and now they are up to second place in sales (Zhou & Gupta, 2020). The two firms have managed to capture markets by vertically integrating their businesses, controlling all four stages in the production chain: technology platforms, design, production, and distribution. Therefore, it can be argued that the smartphone industry is highly competitive and has witnessed considerable changes in the past decades. While most people have smartphones in their pockets, there is a continuous rise and fall in companies in this sector (Argyres et al., 2019). Many firms are competing to grab a larger market share by launching new devices or improving their existing products to remain competitive. Companies have always looked out for ways to improve the functionality of their devices at a cheap rate to maintain the balance between profitability and cost-effectiveness. Along with the introduction of advanced technologies, innovative offerings have also helped companies stay ahead of the competition and improve their market conditions.
The cost structure of the smartphone industry is highly complex and has undergone considerable change in recent years. The decrease in smartphone price per unit of smartphones has been supported by decreasing production costs and competition. The latter has led to more significant product differentiation and improved specifications (Fan & Yang, 2020). As a result, consumers are willing to pay more for certain features, such as large screens, long battery life, or high-end processors. For example, the direct costs of iPhones include research and development (R&D), component production, assembly, and distribution. An iPhone manufacturer’s top three significant costs that come directly from money spent on R&D are semiconductors, memory chips, and sensors; each costs $1 billion (Zhou & Gupta, 2020). Other significant costs come primarily from component production by Foxconn, including labor and materials ($1 billion); assembly at Foxconn ($3 billion); and royalties paid to Qualcomm and Samsung Electronics Co., which also produce chipsets for Apple products.
Marginal cost and marginal revenue
The marginal cost of smartphones has been declining considerably over the past decade. This is especially true for Apple, which holds the top position in the industry by selling iPhone products with an extremely high price tag. This position gives Apple several advantages over its competitors, including access to more resources and a broader customer base that generates more profit per sale (Zhou & Gupta, 2020). However, Apple is not immune to changes from outside its organization. Marginal revenue is also significant because it helps companies determine how much they can charge customers for each product sold. The supply curve slows upward because the marginal revenue also increases as the price increases. For example, when Apple introduced the iPhone 10, it had an initial demand of 800 million units, and every time Apple decreased the price by $ 100, it received 1 million more orders (Zhou & Gupta, 2020). The reverse relationship between demand and supply determines consumer surplus, which is equal to the area of the triangle under the demand curve and above the market price. While the quantity demanded may remain constant or even increase at higher prices as consumers are willing to pay more for a product with increased functionality and quality, it could potentially decrease should maintenance costs rise (Alam & Islam, 2020). Thus, consumers with high disposable income often have different needs to those with low income and may be less interested in paying for maintenance plans if their device breaks down compared to poorer consumers who need more costly equipment replacement plans.
Transaction Costs
The transaction costs involved in the smartphone industry are the cost of changing a product or service. The higher the transaction costs are, the more it prevents businesses from innovating to meet customer demands (Argyres et al., 2019). The challenges in the transaction costs include lack of uniformity, transparency, and conflict of interest. The critical success factors in controlling these costs are using the Internet as a global trade platform, verifying suppliers’ credibility before entering into a relationship with them, and keeping your cost under control (Argyres et al., 2019). The Transaction Cost of the smartphone industry mainly depends on the evolution of technology. The first iPhone was released in 2007, and since then, the technology has been constantly being upgraded, making it a sort of transition between generations, as one generation ends and another takes over (Zhou & Gupta, 2020). While this might be no big deal for other industries, it can be pretty significant for smartphone companies to miss out on an entire generation of customers who might not have any inclination to upgrade their devices so that they can use their favorite apps or check out their favorite websites.
Scarcity
The pandemic has limited access to finished products and critical factors of production, such as labor (Nayak et al., 2022). The advent of the COVID-19 pandemic has caused significant disruptions to the global supply chain, leading to a decline in the supply of essential products, including food, water, and smartphones. Labour supply was also disrupted as the stay-at-home measures were implemented. The sale of smartphones was significantly reduced during COVID-19 due to constrained production. Besides, the closure of retail outlets Hemi-damped or completely stopped sales. As a result, it led to a scarcity of smartphones during the period. The shortage led to price hikes on smartphones that are currently available; whether it is old models or new ones, businesses had previously cut the cost of smartphones by implementing low prices throughout their retail outlets hoping that this would motivate people to buy electronic goods (Nayak et al., 2022). Few of the many smartphones used in the United States were sold during COVID-19 due to the shrinking market and less production.
The recession saw the technology sector sharply decline, coupled with declining consumer spending during the 2019 and 2020 periods. However, many retailers reported lower sales levels and are using this as an opportunity to restructure their business models and streamline inventory control. Figure 3 depicts the number of smartphones sold from 2007 to 2021. The highest sale was in 2018, with a total sale of 1556.27M units, and the lowest was in 2007, with 122.32M units. Before the pandemic, smartphones sold increased from 2007 to 2018. It is also due to limited stocks available in the market. The first year of COVID-19 has decreased the demand for smartphones, but in 2020, the sales fell drastically. It can be attributed to the panic, diminishing confidence, and despair associated with people’s economic activities since 2020. Nonetheless, there was a slight recovery in 2021 with a sale of 1433 units. Therefore, there is an expected recovery in 2022 since most businesses have recovered from the COVID-19 pandemic.
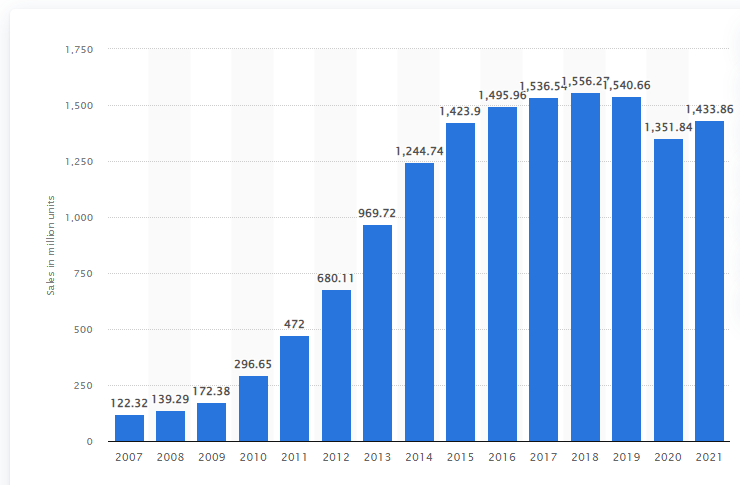
Figure 3: Number of smartphones Sold 2007-2021
Opportunity Cost
Opportunity costs are resources that must be committed to mitigating market imperfections that could have been used elsewhere to produce economic value. When a company makes a decision, they have to give up something to have the desired goal of that decision. They have to weigh alternatives. This is true for all firms, even apple. We talked about the resolutions for our phones, but apple company a few years ago came out with the iPhone 12. That was pretty big news. They did not come out with the iPad that year because they lacked the resources to do both; otherwise, they would have. So they chose to come out with the iPhone 12 at that time. Because they faced a choice, they could have the development of a product but not both at the same time. The opportunity cost of releasing the iPhone 12 was foregoing the opportunity to release a higher generation of iPad with new bells and whistles.
Demand and Supply Shifters
The demand for smartphones is affected by several factors, such as the development of technology, increasing penetration of mobile phones in emerging markets, and improving incomes in these economies. Other significant factors influencing the demand for smartphones include increased use of apps and content through better internet connectivity, the steady growth of smartphone manufacturing capacity (in terms of volume), and the launch of new models in the market (Yusuf Saleh & Halim, 2019). The demand shifters are the external factors that can cause a change in the sales of smartphones. For example, price change by competitors and changes in income shifts a product’s demand curve. The supply shifters are the internal factors that can cause a change in the sales of smartphones. For example, unemployment due to business shit down reduced the household’s disposable income, reducing their purchasing power. The reduced purchasing power reduces the number of smartphones demanded as the demand curve shift to the left. Besides, the shutdown of businesses has reduced the production of smartphones, causing a reduction in the supply of smartphones (Alam & Islam, 2020). The limited supply increased prices, limiting the number of people who could afford it. The demand shifters include people’s desire to be safe from COVID-19; more people will buy a smartphone since they need one to connect with family members, doctors, and even employers. Therefore, the pandemic impacted the factors affecting the demand and supply, which in turn affected the sales of smartphones.
The supply and demand shifters of the sales of smartphones during COVID-19 in the United States were due to a disrupted supply chain. For instance, consumer goods and services movement, lower consumer confidence, and decreased business travel (Alam, 2021). It has had two main effects. First, it has hurt demand for intelligent devices, particularly high-end ones such as phones and tablets, computers, and televisions. Second, there has been very little innovation since COVID-19 began. Companies had to allocate resources toward getting the most important things done (such as ensuring people had access to antivirus software). Many companies suspended their operations in certain regions, and there were delays in shipments due to extra safety precautions being taken by manufacturers, which led to fewer devices being produced, resulting in lower shipment volumes for smartphone manufacturers.
Consumer Choice Theory
Consumer choice theory assumes buyers have well-defined tastes, stable preferences, and rational expectations (Browning & Zupan, 2020). Consumers make choices based on their preferences, which are influenced by relative prices and income. The model also assumes that consumers have unrestricted access to goods; firms may not sell all of their products at a given price because some consumers will be unwilling to pay for them (Browning & Zupan, 2020). During the COVID-19 pandemic, people had to choose which products and services to consume. The choices were guided by how much consumers would pay for the product or service or the benefits offered. However, people were forced to purchase less because of the shortage of goods and services. Besides, some chose their purchases much more carefully than during regular times. As a result, consumers had to consider not only what they wanted but also how much they would afford, who would pay for it, and other people’s requirements.
While choosing products or services during the pandemic, consumers would be influenced by their preferences and economic constraints. In addition, government intervention can affect economic factors such as price controls or scarcity of goods and services due to demand rationing. The sales of smartphones took a hit during the COVID-19 pandemic because of the fear among consumers and limited knowledge of the safety of using mobile devices. People are afraid to leave their homes for fear of contracting the virus. The consumer choice theory of the sales of smartphones during COVID-19 in the United States has been shaped by multiple factors, including data, reputation, and customer service (Purwanto & Sudargini, 2021). Since COVID-19, people have become more aware of their connectedness via social media, which has created a new way to communicate outside of face-to-face interaction. All forms of communication are now considered public domain unless stated otherwise by the sender. Because of these changes in communication norms, there have been an increase in online transactions and trust among shoppers.
Prediction of the Future of Smartphones
The impact of COVID-19 on the global smartphone market can be divided into two parts. First, COVID-19 directly reduced the total U.S. population and indirectly impacted the smartphone market by slowing the replacement cycle of existing devices, reducing industry revenues and profits (Yamamoto et al., 2022). Second, as the pandemic passes, the latest smartphone penetration rate will resume over time. Based on this evaluation, it is believed that with a decline in U.S. sales due to COVID-19 and new launches in late 2020, most companies with significant global market share should still increase profitability over time relative to 2021 or continue to maintain profitability while benefiting from economies of scale after they have expanded their global market share (Brem et al., 2021). Thus, the prediction of the future of the sale of smartphones after COVID-19 is that they will increase because of their unique features and compatibility with most applications and also because many manufacturers in this sector are working hard to create new technologies that are highly efficient and active (Brem et al., 2021). Most people use their smartphones as a medium to access information, entertainment, and social life. People can keep themselves in a safe zone using these smartphones by watching movies, playing games, listening to music, and chatting with friends online. These new gen mobiles also help them to live an easy life after this pandemic. Therefore, it is only clear that smartphone manufacturers will continue to develop their technology so that people can enjoy it better.
In the United States, smartphone users increased from 61.49 million U.S. dollars in 2009 to 165.8 million in 2016, reaching 274.1 million in 2019 (Statista, 2022b). By 2021, smartphone users were 302 million, and it is expected that by 2040 there will be 364.2 million smartphone users (Statista, 2022b). Therefore, the sales of our products will increase during the following years and become more profitable. Companies must improve their product design by making them with less expensive materials while retaining quality. They should start marketing their product to different regions to ensure they reach everyone who needs their product for their phone.
Prediction of Smartphone Users from 2009 to 2040
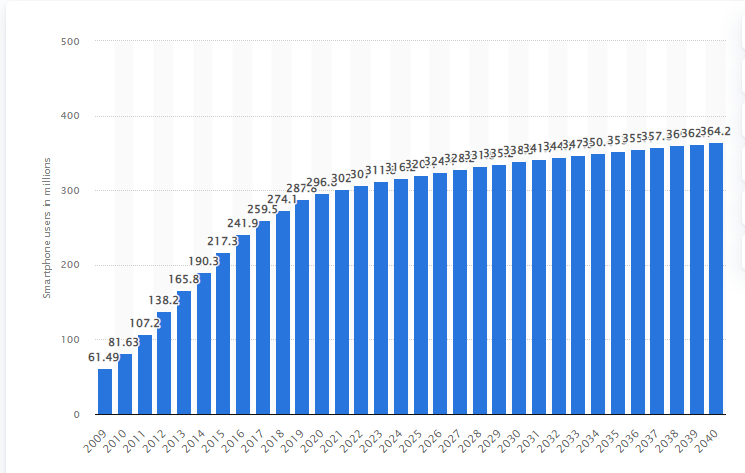
Figure 4: Source Statista 2022b: Smartphone users in millions 2009 2040
Overall, it is evident that smartphone sales were on an upward trend before the pandemic disruption and have since recovered. Given how technology and consumer behavior (for example, new gadgets) are changing rapidly and constantly, one should expect a much higher increase in sales. The global growth of the smartphone market has been impressive, and the expectation is continuous growth in the future, along with the increasing economic activity. Therefore, with the introduction of COVID-19 and its devastating impact on society, it is evident that large corporations need to implement measures to help alleviate consumers’ fears.
References
Alam, S. (2021). Reviewing the global smartphone industry strategic implication in response to the COVID-19 situation. International Journal of Interactive Mobile Technologies (iJIM).
Alam, S. I., & Islam, M. (2020). Price for Quality in Vertically Differentiated Smartphone Markets. Jahangirnagar University Social Science Review, Part II. XLVI.(PDF) Price for Quality in Vertically Differentiated Smartphone Markets (research gate. net).
Argyres, N., Mahoney, J. T., & Nickerson, J. (2019). Strategic responses to shocks: Comparative adjustment costs, transaction costs, and opportunity costs. Strategic Management Journal, 40(3), 357–376.
Brem, A., Viardot, E., & Nylund, P. A. (2021). Implications of the coronavirus (COVID-19) outbreak for innovation: Which technologies will improve our lives? Technological Forecasting and Social Change, 163, 120451.
Browning, E. K., & Zupan, M. A. (2020). Microeconomics: Theory and applications. John Wiley & Sons.
Dutta, A. (2022, May 25). Smartphone prices jumped 27% since COVID began in 2020: IDC. Business Today. https://www.businesstoday.in/latest/economy/story/smartphone-prices-jumped-27-since-covid-began-in-2020-idc-335036-2022-05-25
Fan, Y., & Yang, C. (2020). Competition, product proliferation, and welfare: A study of the U.S. smartphone market. American Economic Journal: Microeconomics, 12(2), 99-134.
Flaten, H. K., St Claire, C., Schlager, E., Dunnick, C. A., & Dellavalle, R. P. (2018). Growth of mobile applications in the dermatology-2017 update. Dermatology Online Journal, 24(2).
Jensen, M. C., & Meckling, W. H. (2019). Theory of the firm: Managerial behavior, agency costs, and ownership structure. In Corporate Governance (pp. 77-132). Gower.
Nayak, J., Mishra, M., Naik, B., Swapnarekha, H., Cengiz, K., & Shanmuganathan, V. (2022). An impact study of COVID‐19 on six different industries: Automobile, energy and power, agriculture, education, travel and tourism, and consumer electronics. Expert Systems, 39(3), e12677.
Purwanto, A., & Sudargini, Y. (2021). Exploring factors affecting buying interest in smartphones during the COVID-19 pandemic. Journal of Industrial Engineering & Management Research, 2(4), 124-130.
Statista. (2022a, October 18). Smartphone sales value in the United States 2005-2022. https://www.statista.com/statistics/191985/sales-of-smartphones-in-the-us-since-2005/
Statista. (2022b, October 18). Smartphone users in the United States 2009-2040. https://www.statista.com/statistics/201182/forecast-of-smartphone-users-in-the-us/
Xu, Z., Elomri, A., Kerbache, L., & El Omri, A. (2020). Impacts of COVID-19 on global supply chains: Facts and perspectives. IEEE Engineering Management Review, 48(3), 153-166.
Yamamoto, G. T., Aydin, S., Duzgun, F., & Telli, E. (2022). Consumers’ smartphone preferences in Turkey during the COVID-19 pandemic. Middle East Journal of Management, 9(5), 483-503.
Yusuf Saleh, M., & Halim Perdana Kusuma PUTRA, A. (2019). The Impact of Product Quality, Price, and Distribution on Satisfaction and Loyalty.
Zhou, L., & Gupta, S. M. (2020). Value depreciation factors for new and remanufactured high-technology products: a case study on iPhones and iPads. International Journal of Production Research, 58(23), 7218–7249.
 write
write