The data provided contains a thorough summary of all cases associated with the outbreak. This data was recorded in different American cities throughout February, March, and April. Analyzing the patterns and numbers of cases in various places is essential to determining the risk levels related to these outbreaks (Sadeghian, F. et al., 2020).
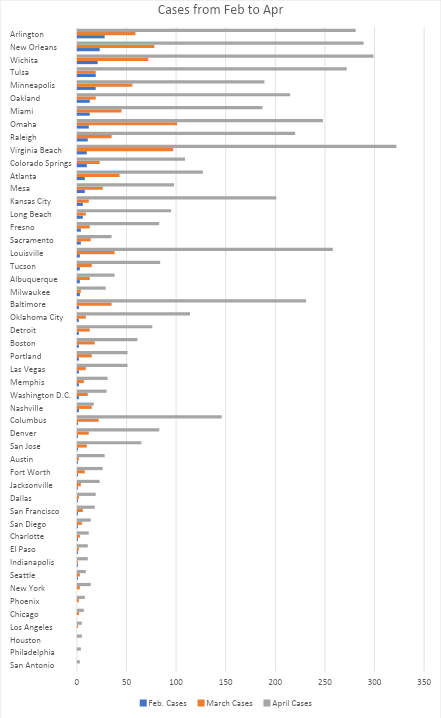
First of all, places like New York, Los Angeles, Houston, Phoenix, and Miami that had a constant high number of cases over the three months may be regarded as high-risk zones. Between February and April, there was a notable spike in cases in these cities, suggesting that the outbreak could have expanded further. On the other hand, throughout the three months, the case numbers in places such as Chicago, Philadelphia, and Indianapolis were comparatively low, indicating a decreased likelihood of widespread transmission in these regions. The distribution of instances is seen in the graph below.
Expanding the analysis to regional levels, certain areas of the country demonstrate higher risk When the research is extended to regional levels, it becomes clear that some parts of the nation are more risky than others. For example, states in the South and Southwest, such as Texas, Arizona, and Florida, have a large concentration of high-risk cities, such as Miami, Houston, and Phoenix. On the other hand, based on recorded case numbers, areas such as the Midwest and some portions of the Northeast, highlighted by cities like Chicago and Philadelphia, seem to have lower overall risk levels. The unequal distribution of outbreaks across the nation is shown by this geographical difference.
In addition, tracking the development of cases over time provides information on the course and intensity of epidemics (Feng, T. et al., 2020). Cases increased exponentially in cities like New York and Los Angeles, especially between March and April, suggesting that there might be a quick community spread and increased danger. On the other hand, places like Philadelphia and Chicago, where the number of cases is generally steady or dropping, could have put in place efficient mitigation strategies or had fewer severe outbreaks.
Digging deeper into the analysis we can also visualize that;
- Trends Over Time- Many cities experience a steady increase in cases from February to April, indicating a widespread escalation of the pandemic during that period.
- Urban vs. Rural Impact: Urban centers tend to have higher case counts compared to rural areas, likely due to population density and higher levels of interaction.
- Regional Disparities: Certain regions, such as the Midwest, exhibit lower case counts overall compared to regions like the Northeast and Southwest.
- Seasonal Variations: While not explicitly stated, the increase in cases from February to April could indicate a combination of factors, including increased testing, easing of restrictions, and potentially seasonal influences on virus transmission.
All things considered, our research highlights how the risk of an outbreak is dynamic in the US and is impacted by a variety of factors, including community compliance with preventative public health activities, and population density. By identifying high-risk locations, resources may be allocated and focused measures can be made to successfully slow the spread of epidemics. In addition, continuous monitoring and analysis of epidemic data are necessary to identify new patterns and modify response plans to successfully handle public health emergencies.
Part II: Information Analysis
We carefully examined data related to the outbreak, paying particular attention to how cases spread throughout various cities. This thorough investigation not only helped us identify high-risk and low-risk regions, but it also revealed patterns over time and highlighted possible triggers that may have an impact on the outbreak’s development. Making use of this information can help strengthen a particular healthcare facility’s operational resilience.
Benefits to the Hospital
The comprehensive data gathered and analyzed in earlier evaluations will be extremely beneficial to the institution. By obtaining a detailed awareness of the cities and areas experiencing increased outbreak activity, the hospital may prepare ahead of time for an expected increase in the number of patients. Especially if it is located close to a high-risk metropolis like New York or Los Angeles, the hospital might anticipate needs and adjust staffing levels in advance to match the increased number of patients. A preventive strategy is encouraged by strategically allocating resources in high-risk areas and thus enhances the hospital’s capacity to promptly and effectively treat patients afflicted with diseases associated with outbreaks.
Conflicts of Interest and Ethical Considerations
Despite the obvious advantages, the hospital still has to deal with possible conflicts of interest and ethical challenges. For example, if the hospital has a cooperation with a high-risk city but is located in a low-risk location, there may be pressure to reallocate resources to assist the affiliated facility. A careful balancing act is required to navigate these obstacles, as the hospital must respect its legal obligation to the community while keeping wider public health demands in mind (Rothman, M. J. et al., 2021). Thoroughly evaluating the hospital’s broader goal, values, and obligations to its immediate constituency as well as the larger public health ecosystem is necessary to resolve these conflicts and ethical problems. Stakeholder collaboration relationships and open communication channels can help organizations skillfully negotiate these complexities.
Community Health Effects
Additionally, the way the hospital handles the epidemic might have a significant impact on public health. Through effective management of outbreaks inside its boundaries and the implementation of preventive measures, the hospital may effectively reduce the spread of sickness among the surrounding population. On the other hand, any shortcomings in readiness or action could accidentally boost the rate of transmission, which might lead to unfavorable health consequences for residents of the community. The community is consequently affected by the hospital’s activities during an epidemic, underscoring the necessity of giving preventive measures like vaccination drives, public awareness campaigns, and strict infection control practices priority. These kinds of actions are essential for preserving community well-being and reducing the harmful effects of the outbreak on public health.
Points for Further Research
Even with the abundance of information obtained from previous evaluations, several gaps remain, necessitating more study efforts. For example, carrying out a thorough analysis of patient demographics and conditions might provide crucial information on the factors impacting the likelihood of contracting the epidemic and the course of therapy. Furthermore, researching the effectiveness of various intervention tactics from the public- health advocacy campaigns to quarantine laws—can provide empirical information that guides the development of new epidemic response plans. Improving patient profiles, treatment results, and intervention effectiveness is necessary for improving evidence-based strategies for public health response and preparation.
Conclusion
To sum up, the careful examination of data on outbreak activity is essential to strengthening a hospital’s readiness and response plans. Through a thorough analysis and interpretation of this data, hospitals can recognize patterns, spot new trends, and strategically invest resources to contain the epidemic. Furthermore, by using an analytical approach, hospitals may prudently negotiate difficult ethical judgments and make sure that the best interests of their patients and the community are served. However, the path to resilience requires more than analysis; it also requires a constant commitment to continuous research projects. Adopting a culture of ongoing research and creativity enables hospitals to improve their tactics, adjust to changing circumstances, and stay at the forefront of public health response initiatives. Therefore, hospitals may create a path toward strong readiness and resilience by combining data-driven insights with a constant dedication to academic inquiry, protecting both individual patients and the larger community from the hardships of public health emergencies.
References
Pourghasemi, H. R., Pouyan, S., Heidari, B., Farajzadeh, Z., Shamsi, S. R. F., Babaei, S., … & Sadeghian, F. (2020). Spatial modeling, risk mapping, change detection, and outbreak trend analysis of coronavirus (COVID-19) in Iran (days between February 19 and June 14, 2020). International Journal of Infectious Diseases, 98, 90-108.
Bi, Q., Wu, Y., Mei, S., Ye, C., Zou, X., Zhang, Z., … & Feng, T. (2020). Epidemiology and Transmission of COVID-19 in Shenzhen China: Analysis of 391 cases and 1,286 of their close contacts. medrxiv, 2020-03.
Beals IV, J., Barnes, J. J., Durand, D. J., Rimar, J. M., Donohue, T. J., Hoq, S. M., … & Rothman, M. J. (2021). Stratifying deterioration risk by acuity at admission offers triage insights for coronavirus disease 2019 patients. Critical Care Explorations, 3(4).
 write
write