Introduction
Solvency ratios are essential to evaluate a company’s long-term financial stability and health. These ratios assess a government’s capacity to fulfill its long-term commitments, which are typically sizeable and can have serious repercussions. They gauge a company’s ability to satisfy its long-term financial responsibilities, including debt repayment, funding pension commitments, and other upcoming costs (Chasanah & Sucipto, 2019). Businesses must ensure they have the resources necessary to fulfill these commitments because failing to do so could negatively affect the economy, society, and politics. A high debt-to-GDP ratio or a low-interest ratio may indicate to investors that a company is in danger of defaulting on its financial obligations. Solvency ratios can also shed light on a company’s or government’s credibility. This may result in increased borrowing rates, dwindling investor confidence, and slower economic growth.
| Bay City, Texas FY 2022 | |||
| Current, Operating, and Net Asset Ratio | |||
| Dollar Amount | Ratio | ||
| Current Ratio | Current Assets | $ 15,429,273 | |
| Current Liabilites | $ 5,863,375 | ||
| Ratio | 2.63 | ||
| Operating Ratio | Total Revenue | 30,990,500 | |
| Total Expenses | 30,990,500 | ||
| Ratio | 1.00 | ||
| Net Asset Rato | Total Assets | $ 65,815,497 | |
| Restricted + Unrestricted Assets | $ 34,718,039 | ||
| Ratio | 1.90 | ||
Analysis
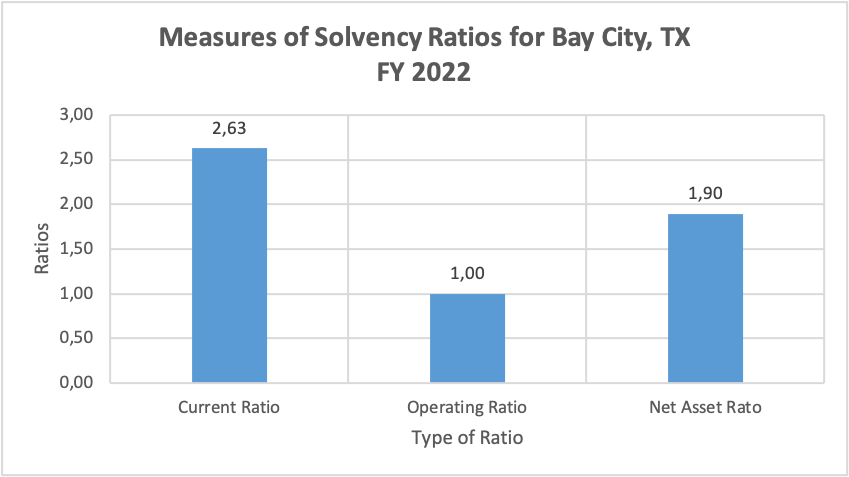
Solvency ratios are used to evaluate Bay City, Texas’s financial health and capacity to pay long-term financial obligations because it is a governmental organization. In this instance, by looking at the three ratios supplied in the table—the current ratio, the operational ratio, and the net asset ratio—we may examine the level of solvency of Bay City, Texas.
The current ratio is arrived at by dividing current assets by current liabilities, giving Bay City, Texas, a current ratio of 2.63. This shows that the government entity has $2.63 in current assets for every dollar of current liabilities. This ratio exceeds the desired cutoff threshold of 1.5, demonstrating Bay City, Texas’ superior capacity to satisfy its immediate financial responsibilities.
Bay City, Texas, has an operating ratio of 1, which is determined by dividing total expenses by total revenue. In other words, the government body is breaking even when its total expenses equal its earnings. That is not a cause for alarm, even though an operating ratio of precisely one is not always desirable.
Bay City, Texas, has a net asset ratio of 1.90, determined by dividing total assets by restricted plus unrestricted assets. Compared to restricted and unrestricted assets, this ratio shows that the government entity owns 1.9 times the total assets. This is higher than the optimal cutoff value of 1.5 and shows that Bay City, Texas, can satisfy its long-term financial responsibilities.
It is evident from comparing the three ratios that Bay City, Texas, has a high capacity to fulfill its financial commitments throughout the short and long term. The government body has a stable financial condition, as seen by the current ratio, and the net asset ratio is higher than the optimal cutoff values. However, the operating ratio is exactly 1, indicating that the government entity is breaking even.
Bay City, Texas, can handle its level of solvency. The government body is well-positioned to fulfill its immediate and long-term financial commitments. The precise one operational ratio, however, signals that the company needs to make a profit, which may restrict its capacity to fund new initiatives and projects. The entity may consider boosting its revenue or cutting costs to improve its financial situation. The government body might look at potential new revenue streams or cost-cutting measures. Comparing Bay City, Texas’s financial ratios to those of comparable companies may also help identify potential improvement areas.
Solvency Methods and Techniques and Why They Are Important for Government
Governments must use solvency methodologies and approaches because they offer a tool to evaluate their capacity to fulfill their long-term obligations. Governments have a variety of long-term responsibilities, including finance for infrastructure, pension payments, and public debt. To ensure that the government can fulfill its financial responsibilities in the future, it is necessary to understand its solvency situation.
Financial ratios are one of the main techniques used to assess a government’s solvency. Financial ratios are helpful in the analysis of financial statements, which give a picture of the financial situation of a government at a certain period. Debt-to-equity ratios are often used in financial statistics to gauge solvency. This ratio calculates a government’s debt to equity and serves as a gauge of that government’s capacity to pay down its obligations. A high debt-to-equity ratio shows that the government is heavily leveraged, which could result in financial problems if it cannot earn enough money to service its debts (Mutiara et al., 2018).
The interest coverage ratio is a different solvency ratio that is frequently employed. This ratio gauges the ability of the government to deduct interest payments from operational revenue. A high-interest coverage ratio implies that the government will likely be able to cover its interest costs. In contrast, a low ratio suggests that it may be challenging to do so.
The current ratio, which gauges the government’s capacity to settle its short-term debts, is also a crucial solvency ratio. A high current ratio suggests the government has enough assets to cover its short-term obligations. In contrast, a low ratio suggests that the government may struggle to settle its short-term obligations.
These ratios help give a quick, unbiased assessment of a government’s solvency status. However, they must be used with other financial ratios and analyses to give a complete picture of the government’s financial situation. A government’s solvency condition can also be assessed using other financial ratios such as the debt-to-revenue ratio, the debt-to-GDP ratio, and the cash flow coverage ratio.
Solvency ratios offer a quick and easy tool to evaluate a government’s financial situation. The financial statements of the government, which are easily accessible, can be used to calculate these ratios. Moreover, solvency ratios can aid in the early detection of possible issues with the government’s financial condition, allowing for implementing corrective actions.
Moreover, solvability ratios offer a reliable foundation for contrasting the fiscal standings of various administrations. Making useful comparisons between the fiscal positions of various governments is made possible using the same ratios (Dahiyat et al., 2021). Investors, lenders, and other stakeholders who might be curious about the government’s financial health will find this especially helpful.
The limitations of solvency ratios are backward-looking and may not be a reliable indicator of a government’s financial status going forward, which is one of their key drawbacks. Solvency ratios also do not take all significant aspects that might impact a government’s financial situation into account and give a snapshot of that situation. For instance, the impact of changing policies or the state of the economy may not be reflected in solvency ratios. Some governments’ assets that are not disclosed in their financial accounts may also impact the solvency ratios.
Furthermore, qualitative elements that may affect a government’s financial situation are not considered by solvency ratios. A government’s financial condition can be impacted by qualitative elements, including political stability, economic strength, and the capacity of the administration to enact changes. Solvency ratios must therefore be used in the context of a comprehensive study that considers both quantitative and qualitative considerations.
How Solvency Solves Financial Issues
Any company or government must be solvent because this defines their long-term viability and financial health. It can be defined as an indicator of an organization’s capacity to pay its debts when they become due. Solvency problems can manifest in several ways, including excessive debt, declining sales, or ineffective operations. If these issues are not fixed immediately, they can become troublesome and even lead to the failure of a company. Solvency ratios are a crucial instrument for assessing the financial stability of any government or business. They can explain how a company handles its long-term financial commitments, such as debt, pension payments, and capital investments.
Solvency ratios gauge the balance between an entity’s assets and liabilities. They evaluate an organization’s capacity to meet its short-term responsibilities with its current resources (Cao, 2022). The debt-to-equity ratio, the current ratio, and the interest coverage ratio are the three solvency ratios employed the most frequently. The short-term solvency of a company can be assessed using the current ratio. It assesses the entity’s capacity to satisfy its immediate financial obligations using current assets. A ratio greater than one suggests that the entity can fulfill its immediate responsibilities. However, a ratio of less than one suggests that the entity may encounter difficulties fulfilling its primary duties.
The long-term solvency of the organization is assessed using the debt-to-equity ratio. It gauges how much debt an entity has concerning its equity. An organization with a high debt-to-equity ratio likely has more debt than equity. If the firm is not producing enough cash flow to cover the debt, this could lead to a higher risk of bankruptcy. On the other hand, a low debt-to-equity ratio implies that the organization has less debt than equity, which suggests a lesser danger of bankruptcy. An entity’s capacity to cover its interest costs is gauged using the interest coverage ratio. It compares an entity’s operating profits to its interest costs. A higher interest coverage ratio suggests that an entity has a greater capacity to cover its interest costs. A lower interest coverage ratio suggests an entity may experience trouble doing so.
It is impossible to overstate solvency’s role in resolving financial problems. For any business or government to be able to fulfill its long-term responsibilities, it is essential to maintain a strong solvency position. Insufficient solvency puts an organization at risk of insolvency or financial commitments being missed. This could, in turn, cause financial instability, reduced investor confidence, and the loss of valuable investments.
An entity can use solvency ratios to identify its strong points and areas for improvement, empowering it to make wise financial decisions. An entity can take action to address any solvency issues before they develop into more serious financial challenges by determining its situation about solvency. There are many benefits to using solvency ratios. They offer a quick approach to assessing the solvency condition of a company, enabling them to make necessary corrections. Also frequently employed, solvability ratios have become a staple tool for financial analysts and investors. This could improve the organization’s transparency, which fosters investor confidence.
Maintaining solvency also aids in preventing financial difficulties, which can have various unfavorable effects. A government may be compelled to declare bankruptcy or default on its debts if it becomes insolvent, which might have severe repercussions for the government and its constituents. The government’s credit rating may decline due to a default on debt commitments, making future borrowing more challenging and expensive for the government. Moreover, bankruptcy may result in the sale of public assets and significant reductions in public services, which may be detrimental to those who depend on those services.
Sustaining solvency can aid in fostering a stable economy. A financially sound government can better respond to economic shocks and implement measures encouraging economic expansion. On the other hand, an insolvent government might be unable to react to economic shocks or enact policies that would encourage economic growth, which could worsen economic instability and harm the lives of the people.
Maintaining solvency, however, comes with significant drawbacks as well. For instance, governments that only prioritize preserving their financial viability may be less inclined to fund ideas and projects that can promote long-term economic growth. Additionally, some governments would have to enact austerity policies to retain solvency, which could severely affect the general public, especially those who depend on government services.
Differences between Solvency and Liquidity
Solvency and liquidity are two key financial terms that are frequently used to evaluate the financial standing of a business or organization. Although they both pertain to a company’s capacity to pay its debts, there are significant differences between the two notions. The term “solvency” describes a company’s capacity to consistently satisfy its long-term financial obligations, including its debts and other financial commitments (Ayoush et al., 2021). A company’s solvency is a gauge of its long-term financial stability. Ratios like the debt-to-equity ratio and the interest coverage ratio are commonly used to measure it. Solvency ratios indicate a company’s long-term ability to operate profitably and without declaring bankruptcy.
Liquidity, however, describes a company’s capacity to fulfill its immediate financial commitments, such as paying its invoices and loans as they become due. It refers to a company’s capacity to get funds to pay short-term obligations rapidly. Usually, current and quick ratios are used to measure it. The ability of a corporation to manage its short-term cash flow requirements is indicated by its liquidity ratios. The time frame they are measured is one of the main distinctions between solvency and liquidity. Liquidity focuses on a company’s short-term cash flow requirements, whereas solvency concerns its long-term financial health.
The kinds of financial commitments that each is concerned with also differ. In contrast to liquidity, which is concerned with short-term financial responsibilities, solvency is focused on long-term financial obligations. These variations are reflected in the many ratios used to gauge solvency and liquidity. Indicating a company’s level of debt to its equity, the debt-to-equity ratio is a gauge of its long-term financial stability. On the other hand, the current ratio reveals whether a company has enough current assets to cover its current liabilities and is used as a gauge of its short-term liquidity.
It’s crucial to remember that solvency and liquidity are equally crucial for a company’s financial health and are frequently linked. An insolvent corporation will experience short-term liquidity issues because timely payments on its debts and obligations will be difficult. Similarly, a corporation that lacks liquidity may experience solvency issues if it experiences short-term financial difficulties and defaults on its loans.
References
Ayoush, M. D., Toumeh, A. A., & Shabaneh, K. I. (2021). Liquidity, leverage, and solvency: What affects the profitability of industrial enterprises the most? Investment Management and Financial Innovations, 18(3), 249-259.
Cao, L. (2022). Ai in finance: challenges, techniques, and opportunities. ACM Computing Surveys (CSUR), 55(3), 1–38.
Chasanah, N., & Sucipto, A. (2019). Liquidity ratio, profitability, and solvency on stock returns with capital structure as an intervening variable (study on food and beverage sub-sector listed in Indonesia Stock Exchange (Idx) period 2013-2017). Ekspektra: Jurnal Bisnis dan Manajemen, 3(1), 52-68.
Dahiyat, a. A., weshah, s. R., & aldahiyat, m. (2021). Liquidity and solvency management and its impact on financial performance: empirical evidence from Jordan. The Journal of Asian Finance, Economics, and Business, 8(5), 135–141.
Mutiara, Y. T., Zakaria, A., & Anggraini, R. (2018). The influence of company size, company profit, solvency, and CPA firm size on audit report lag. Journal of Economics Finance and Accounting, 5(1), 1-10.
 write
write