Introduction
The case report analyzed a hundred films released in 2016 by major studios. The top hundred films of 2016 are provided together with their opening and total gross sales, the number of theaters exhibiting them, and the number of weeks they stayed in theaters. Tabular and graphical illustrations accompany the discussion of these data. Correlations are made between the data sets to show how opening gross sales, number of theaters, and weeks in theater release relate to total gross sales.
Tabular Summary
The table below shows a summary of movies and their outcomes after being released, including opening and total gross sales, number of theaters aired, and number of weeks they could be viewed in the theaters. The movies with the most grossing sales are part of movie franchises like Marvel, DC Universe, and Star Wars, producing movies like Captain America: Civil War, Batman v Superman: Dawn of Justice, and Rogue One: A Star Wars Story, respectively. The pattern indicates that the film series concept is a lucrative formula for producing the most influential cinema and the market in the world. A survey found that more than half (55%) of adults would like to see another installed of Marvel Cinematic Universe (MCU) or Star Wars on the big screen (Statista, 2023).
| Movie Title | Opening Gross Sales ($ millions) | Total Gross Sales ($ millions) | Number of Theaters | Weeks in release |
| Rogue One: A Star Wars Story | 155.08 | 532.18 | 4,157 | 20 |
| Finding Dory | 135.06 | 486.3 | 4,305 | 25 |
| Captain America: Civil War | 179.14 | 408.08 | 4,226 | 20 |
| The Secret Life of Pets | 104.35 | 368.38 | 4,381 | 25 |
| The Jungle Book (2016) | 103.26 | 364 | 4,144 | 24 |
| Deadpool | 132.43 | 363.07 | 3,856 | 18 |
| Zootopia | 75.06 | 341.27 | 3,959 | 22 |
| Batman v Superman: Dawn of Justice | 166.01 | 330.36 | 4,256 | 12 |
| Suicide Squad | 133.68 | 325.1 | 4,255 | 14 |
| Sing | 35.26 | 270.4 | 4,029 | 20 |
| Moana | 56.63 | 248.76 | 3,875 | 22 |
| Fantastic Beasts and Where To Find Them | 74.4 | 234.04 | 4,144 | 19 |
| Doctor Strange | 85.06 | 232.64 | 3,882 | 19 |
| Hidden Figures | 0.52 | 169.61 | 3,416 | 46 |
| Jason Bourne | 59.22 | 162.43 | 4,039 | 21 |
| Star Trek Beyond | 59.25 | 158.85 | 3,928 | 13 |
| X-Men: Apocalypse | 65.77 | 155.44 | 4,153 | 9 |
| Trolls | 46.58 | 153.71 | 4,066 | 21 |
| La La Land | 0.88 | 151.1 | 3,236 | 20 |
| Kung Fu Panda 3 | 41.28 | 143.53 | 3,987 | 25 |
| Ghostbusters (2016) | 46.02 | 128.35 | 3,963 | 17 |
| Central Intelligence | 35.54 | 127.44 | 3,508 | 11 |
| The Legend of Tarzan | 38.53 | 126.64 | 3,591 | 11 |
| Sully | 35.03 | 125.07 | 3,955 | 20 |
| Bad Moms | 23.82 | 113.26 | 3,215 | 13 |
| The Angry Birds Movie | 38.16 | 107.51 | 3,932 | 17 |
| Independence Day: Resurgence | 41.04 | 103.14 | 4,130 | 12 |
| The Conjuring 2 | 40.41 | 102.47 | 3,356 | 11 |
| Arrival | 24.07 | 100.55 | 3,115 | 17 |
| Passengers (2016) | 14.87 | 100.01 | 3,478 | 17 |
| Sausage Party | 34.26 | 97.69 | 3,135 | 19 |
| The Magnificent Seven (2016) | 34.7 | 93.43 | 3,696 | 15 |
| Ride Along 2 | 35.24 | 91.22 | 3,192 | 22 |
| Don’t Breathe | 26.41 | 89.22 | 3,384 | 17 |
| Miss Peregrine’s Home for Peculiar Children | 28.87 | 87.24 | 3,835 | 19 |
| The Accountant | 24.71 | 86.26 | 3,402 | 13 |
| Teenage Mutant Ninja Turtles: Out of the Shadows | 35.32 | 82.05 | 4,071 | 14 |
| The Purge: Election Year | 31.52 | 79.21 | 2,821 | 15 |
| Alice Through the Looking Glass | 26.86 | 77.04 | 3,763 | 14 |
| Pete’s Dragon (2016) | 21.51 | 76.23 | 3,702 | 18 |
| The Girl on the Train (2016) | 24.54 | 75.4 | 3,241 | 12 |
| Boo! A Madea Halloween | 28.5 | 73.21 | 2,299 | 9 |
| Storks | 21.31 | 72.68 | 3,922 | 16 |
| 10 Cloverfield Lane | 24.73 | 72.08 | 3,427 | 12 |
| Lights Out | 21.69 | 67.27 | 2,835 | 10 |
| Hacksaw Ridge | 15.19 | 67.21 | 2,971 | 18 |
| The Divergent Series: Allegiant | 29.03 | 66.18 | 3,740 | 11 |
| Now You See Me 2 | 22.38 | 65.08 | 3,232 | 11 |
| Ice Age: Collision Course | 21.37 | 64.06 | 3,997 | 15 |
| The Boss | 23.59 | 63.29 | 3,495 | 17 |
| London Has Fallen | 21.64 | 62.68 | 3,492 | 13 |
| Miracles from Heaven | 14.81 | 61.71 | 3,155 | 18 |
| Deepwater Horizon | 20.22 | 61.43 | 3,403 | 11 |
| Why Him? | 11 | 60.32 | 3,008 | 13 |
| My Big Fat Greek Wedding 2 | 17.86 | 59.69 | 3,179 | 9 |
| Jack Reacher: Never Go Back | 22.87 | 58.7 | 3,780 | 12 |
| Fences | 0.13 | 57.68 | 2,368 | 15 |
| Me Before You | 18.72 | 56.25 | 2,762 | 11 |
| The BFG | 18.78 | 55.48 | 3,392 | 15 |
| Neighbors 2: Sorority Rising | 21.76 | 55.46 | 3,416 | 8 |
| The Shallows | 16.8 | 55.12 | 2,962 | 14 |
| Office Christmas Party | 16.89 | 54.77 | 3,210 | 7 |
| Assassin’s Creed | 10.28 | 54.65 | 2,996 | 11 |
| Barbershop: The Next Cut | 20.24 | 54.03 | 2,676 | 13 |
| 13 Hours: The Secret Soldiers of Benghazi | 16.19 | 52.85 | 2,917 | 10 |
| Lion | 0.12 | 51.74 | 1,802 | 24 |
| The Huntsman: Winter’s War | 19.45 | 48.39 | 3,802 | 15 |
| Kubo and the Two Strings | 12.61 | 48.02 | 3,279 | 15 |
| Manchester by the Sea | 0.26 | 47.7 | 1,213 | 23 |
| Warcraft | 24.17 | 47.37 | 3,406 | 13 |
| How to Be Single | 17.88 | 46.84 | 3,357 | 9 |
| Mike and Dave Need Wedding Dates | 16.63 | 46.01 | 3,008 | 14 |
| War Dogs | 14.69 | 43.03 | 3,258 | 9 |
| Almost Christmas | 15.13 | 42.16 | 2,379 | 9 |
| Money Monster | 14.79 | 41.01 | 3,104 | 12 |
| Allied | 12.7 | 40.1 | 3,160 | 9 |
| Nerve | 9.45 | 38.58 | 2,538 | 10 |
| Risen | 11.8 | 36.88 | 2,915 | 13 |
| The Nice Guys | 11.2 | 36.26 | 2,865 | 11 |
| The Boy (2016) | 10.78 | 35.82 | 2,671 | 10 |
| Dirty Grandpa | 11.11 | 35.59 | 2,912 | 8 |
| Ouija: Origin of Evil | 14.07 | 35.14 | 3,168 | 10 |
| The 5th Wave | 10.33 | 34.92 | 2,908 | 18 |
| Inferno | 14.86 | 34.34 | 3,576 | 12 |
| Mother’s Day | 8.37 | 32.49 | 3,291 | 7 |
| Patriots Day | 0.16 | 31.89 | 3,120 | 11 |
| Gods of Egypt | 14.12 | 31.15 | 3,117 | 11 |
| Collateral Beauty | 7.1 | 31.02 | 3,028 | 8 |
| Hail Caesar! | 11.36 | 30.5 | 2,248 | 21 |
| When the Bough Breaks | 14.2 | 29.75 | 2,246 | 10 |
| Zoolander 2 | 13.84 | 28.85 | 3,418 | 7 |
| Moonlight (2016) | 0.4 | 27.85 | 1,564 | 28 |
| The Finest Hours | 10.29 | 27.57 | 3,143 | 10 |
| Florence Foster Jenkins | 6.6 | 27.38 | 1,528 | 11 |
| Hell or High Water | 0.62 | 27.01 | 1,505 | 14 |
| The Forest | 12.74 | 26.59 | 2,509 | 10 |
| Ben-Hur (2016) | 11.2 | 26.41 | 3,084 | 7 |
| The Witch | 8.8 | 25.14 | 2,204 | 14 |
| Bridget Jones’s Baby | 8.57 | 24.25 | 2,930 | 13 |
| Kevin Hart: What Now? | 11.77 | 23.59 | 2,567 | 9 |
Data from Box Office Mojo (2016).
Table: Summary of Movie Outcomes
Graphical Summary
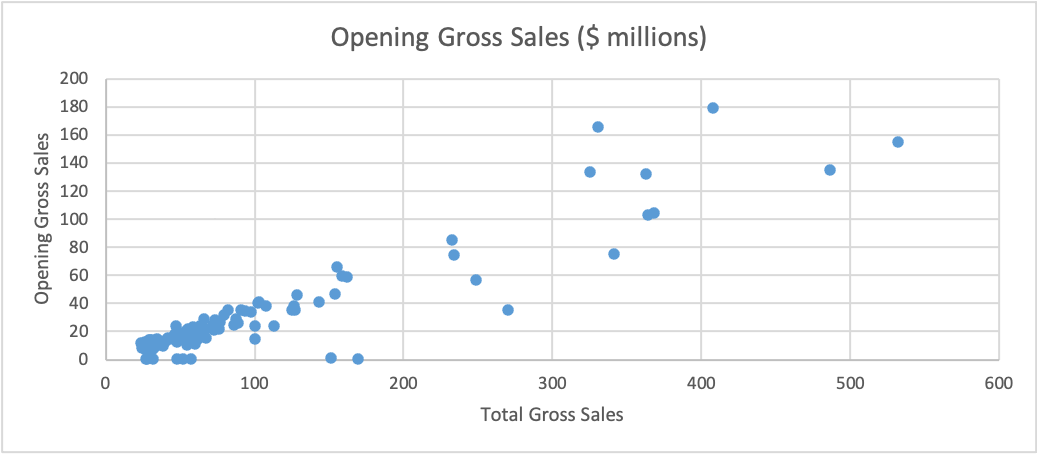
Opening gross sales are essential for studios since each additional week their movie is in theaters, they earn a proportion of the ticket sales for the film. In general, studios and exhibitors share the opening sales at a ratio of 60% and 40%, respectively. Each additional week the film is displayed in theaters reduces the studio’s earning share by ten percent (Sivadas, 2018). The phenomenon explains why some studios only like displaying films in theaters for a month.
However, this trend mostly applies in blockbuster movies since other films can earn a larger share of their gross sales in consecutive weeks apart from week one. Some movies start with small earnings margins in the first week but grow over time (Stephen Follows, 2018).
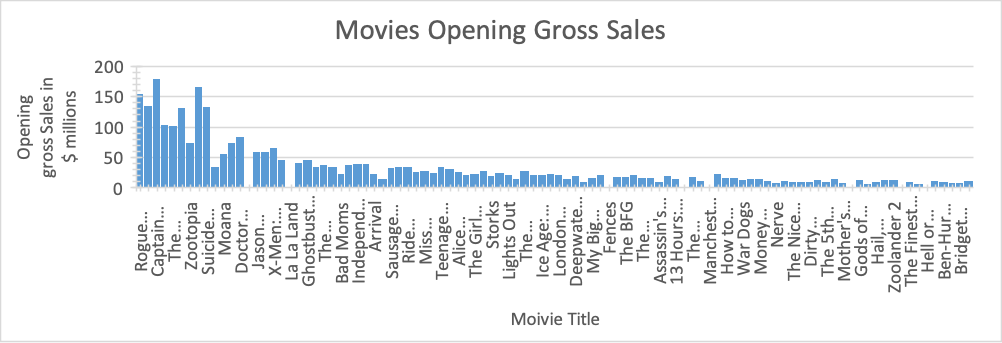
Most films make at least a third of their whole domestic box office gross sales in the opening weekend (Turner, 2015). The implication is that a bad opening gross means a movie did not break even or made losses for the studios, which is not a good result for filmmakers. However, a movie may have lower-than-expected opening gross sales but earn more total sales. Larry Gerbrandt, a movie research analyst, claims that the second weekend of a film’s release is a better indicator of long-term success (Turner, 2015). If a film can manage a decrease in ticket sales by about 30% to 40% from the first to the second week, the movie is likely to have box office success for a longer time than one that breaks box office records in the first weekend, only to earn less a month later (Turner, 2015).
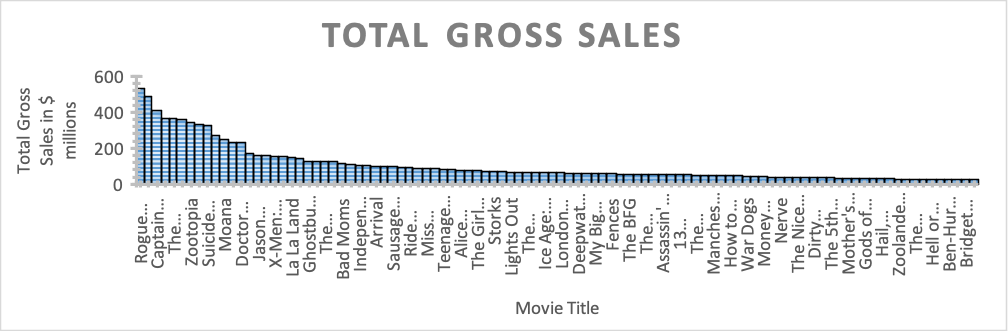
Apart from both domestic and international theater releases and ticket sales, movies earn from DVD sales, TV and cable deals, and streaming services (Turner, 2015). These other mediums contribute to the increase in total gross sales. Thus, film sales may be significantly contributed by other mediums of distribution.
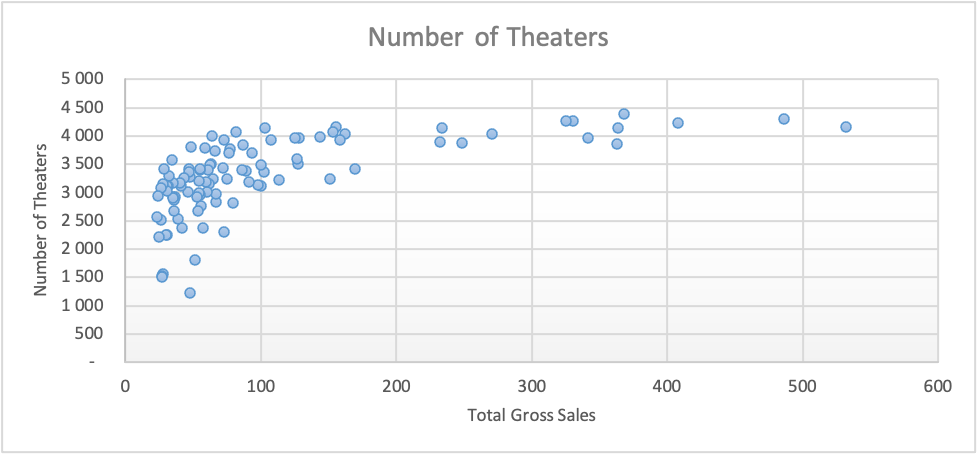
Studios try to exhibit their films in as many theaters as possible to earn ticket sales. With over 3,000 theatres showing a film, studios are assured of reaching directly to customers as closely as possible. Movies with higher demand are showcased in more theaters.
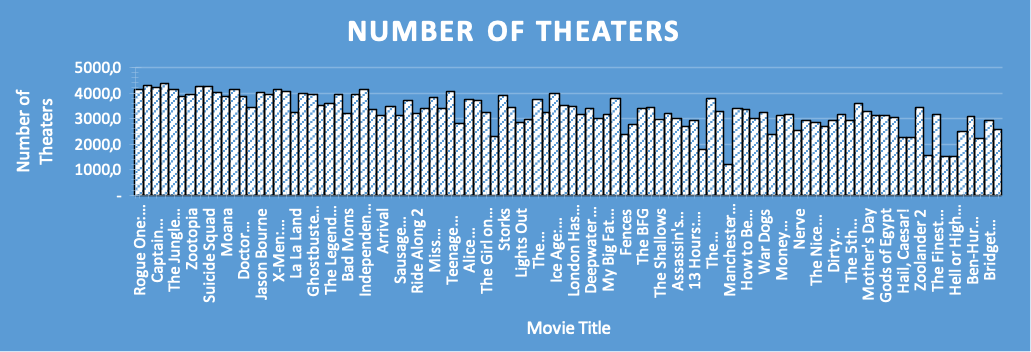
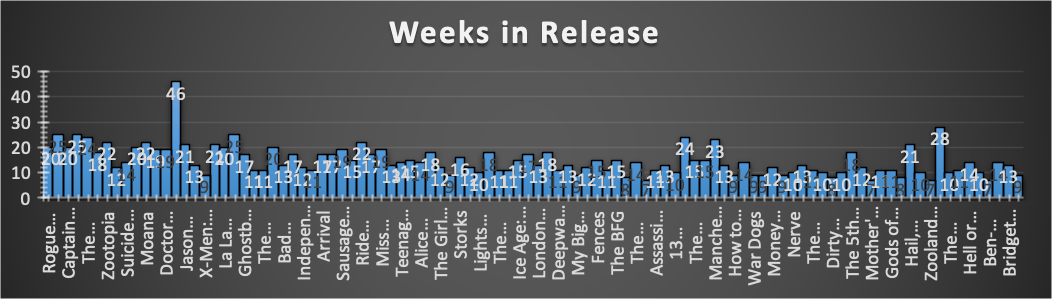
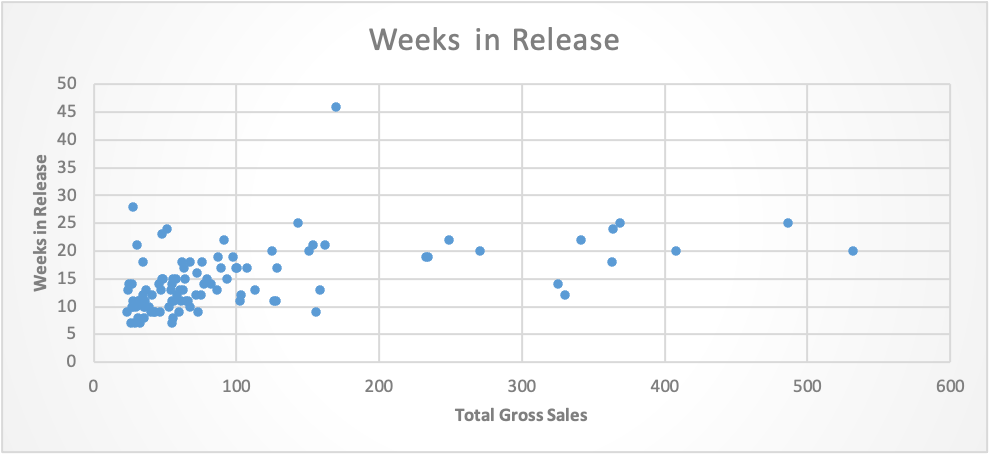
Recently, studios have shortened their theatrical windows to 45 days, down from 75 to 90 days before the pandemic (Clark, 2022). Some studios have exclusive theatrical windows before releasing the movies to home entertainment, while others simultaneously release them in theatres and streaming services. The opening weekend releases and gross sales still remain relevant, but studios are open to other avenues (Pallotta, 2022). However, the recorded films from 2016 – as illustrated in Graph 4 – could stay longer in theaters since they were the studios’ primary revenue sources.
Sivadas (2018) found that opening gross sales correlate significantly with total gross sales. Opening gross sales is a strong indicator of total gross sales (Fowle, 2020). As observed in the graphs and table, the higher the opening gross sales, the more the total gross sales when controlling for the number of weeks in release. The movie Hidden Figures is an exception to this correlation conclusion since it has the most weeks in release.
Total gross sales are also influenced by the number of theatres airing the film. Since studios earn from ticket price revenues, theater attendance will affect gross sales (Zipin, 2021). The more the attendance, the higher the ticket sales, hence the need to release and exhibit movies in as many theaters as possible.
A slightly significant correlation exists between total gross sales and weeks in release. Most films earn a larger percentage of their gross sales in the first few weeks of release (Stephen Follows, 2018). Blockbusters like superhero movies follow this first-week trend. However, others may stay for long in theatres and earn at least half of their gross sales after the first month or two, depending on the type of film (Stephen Follows, 2018).
Release dates are also important for films as they predict gross sales. Most studios aim to release their films during the holidays since they are guaranteed a larger audience in theaters, including children (Pangarker & Smit, 2013). Thus appropriate timing of release dates is relevant to target breaking the bank for the first-weekend ticket sales.
Conclusion
The opening gross sales are indicated to predict the gross sales volume for most blockbuster films. However, other films may still earn more than the ticket sales of the first week if they stay longer in theaters. The more theaters a film is exhibited in, the higher the audience reached and ticket sales which contribute to more total gross sales. Although opening gross sales have a significant correlation with total gross sales, studios are now considering other avenues of distribution and earnings, like streaming services. The 2016 datasets do not reflect this emerging trend.
References
Box Office Mojo. (2016). Domestic box office for 2016. Box Office Mojo by IMDb Pro. https://www.boxofficemojo.com/year/2016/
Clark, T. (2022, May 11). How major Hollywood studios are shifting their streaming strategies as the theater industry stages a comeback. Insider. https://www.businessinsider.com/how-long-movies-play-in-theaters-before-streaming-2022-5?r=US&IR=T
Fowle, B. (2020, April 19). Determining the relationship between opening weekend results, critical reviews, and box office success. Medium. https://medium.com/@befowle/determining-the-relationship-between-opening-weekend-results-critical-reviews-and-box-office-2e05bbb8f592
Pallotta, F. (2022, July 29). Why do movie theaters show so few films now. CNN Business. https://edition.cnn.com/2022/07/29/media/movie-box-office-year/index.html
Pangarker, N. A., & Smit, E. (2013). The determinants of box office performance in the film industry revisited. South African Journal of Business Management, 44(3), 47-58. http://dx.doi.org/10.4102/sajbm.v44i3.162
Sivadas, N. (2018, October 19). Boom or bust? Factors that influence box office revenue. Medium. https://nealsivadas.medium.com/boom-or-bust-factors-that-influence-box-office-revenue-c8e4442d141f
Statista Research Department. (2023, January 5). Top opening weekends at the box office in the U.S. & Canada 2022. Statista. https://www.statista.com/statistics/188498/biggest-opening-weekends-at-the-north-american-box-office/
Stephen Follows. (2018, June 11). How important is the opening week to a movie’s total box office? Stephen Follows. https://stephenfollows.com/how-important-is-the-opening-week-to-a-movies-total-box-office/
Turner, B. (2015, April 24). Why is a movie’s first week box office so important? HowStuffWorks.com. https://entertainment.howstuffworks.com/why-is-movie-first-week-box-office-important.htm
Zipin, D. (2021, October 18). How exactly do movies make money? Investopedia. https://www.investopedia.com/articles/investing/093015/how-exactly-do-movies-make-money.asp
 write
write