Executive Summary
Marks & Spencer Group PLC operates under the Food and Clothing & Home segments, with over 950 outlets within the UK. Despite the difficult economic conditions and new consumer tastes for the 2021 year, M&S has earned $14.3 billion, revealing its ability to persist in an adverse environment combined with the company’s broad spectrum of products. The company is dedicated to sustainability, which contemplates its goal of becoming carbon-neutral by 2035. However, the operational and financial analysis presents decreased profitability and a significant liquidity challenge. To address these problems, a strategic restructuring plan is suggested that entails the reduction of physical presence, internationalization, and debt management strategies. These measures are intended to improve efficiency, increase revenue streams, and achieve financial strength, making M&S a great success in the competitive retail industry.
1.0 The Company
The headquarters of Marks & Spencer is in London, United Kingdom. Michael Marks and Thomas Spencer launched it in 1884, and it has since expanded to rank among the biggest retailers in the UK (M&S, 2022). The two primary business segments of M&S are Food and Clothes & Home, as shown in Figure 1. The food segment includes an extensive selection of groceries, fresh vegetables, ready meals, and bakery items. The Clothing & Home segment offers a range of apparel and home products, including furniture, home goods, as well as cosmetics for men, women, including children (M&S, 2022). With more than 950 locations around the country as well as an online store, M&S is well-known in the UK. The corporation operates outlets in more than 50 countries, expanding its global footprint. $14.3 billion was the company’s revenue for the 2021 fiscal year (M&S, 2023a). M&S is renowned for its dedication to ethical sourcing and sustainability. The corporation has established aggressive goals to lessen its environmental influence, one of which is to become carbon neutral by 2035 (M&S, 2023a). It also collaborates closely with suppliers to guarantee that goods are made ethically and sustainably. M&S is a reputable store with a strong brand and an emphasis on sustainability.
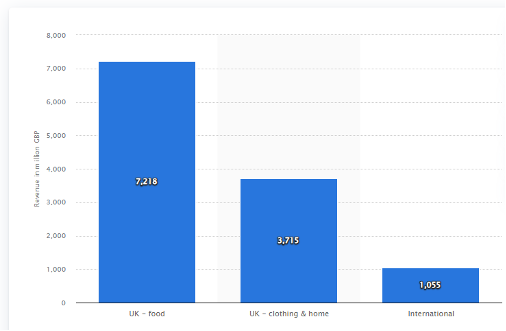
Figure 1: Revenue of Marks & Spencer worldwide, by segment (in million GBP)
2.0 Macro and Micro Environment
In the UK, the retail industry is particularly vulnerable to shifts in interest rates and is prone to economic downturns. Despite battling to survive the 2009 economic downturn, the nation’s economy has recovered (Partington, 2023). Since the UK is the center of e-commerce, customers are not restricted to local merchants but also include visitors from outside, resulting in a diversified retail industry and foundational trends. Nevertheless, the British economy has grown more slowly due to the recent Brexit, which has impacted the nation’s total economy and its citizens’ ability to spend (Croudace, 2021). For the UK retail sector, shifting consumer interests, preferences, and lifestyles have brought both possibilities and risks. UK consumers tend to stick with a single brand regardless of the product’s quality (Abdulla and Bruce, 2024). On the other hand, a competitive pricing approach from rivals can quickly alter this. Additionally, customers favour contemporary fashions over classics, which poses a challenge to M&S’s efforts to win back a sizable portion of the market. It indicates that customers in the UK’s retail sector often give their money a high value.
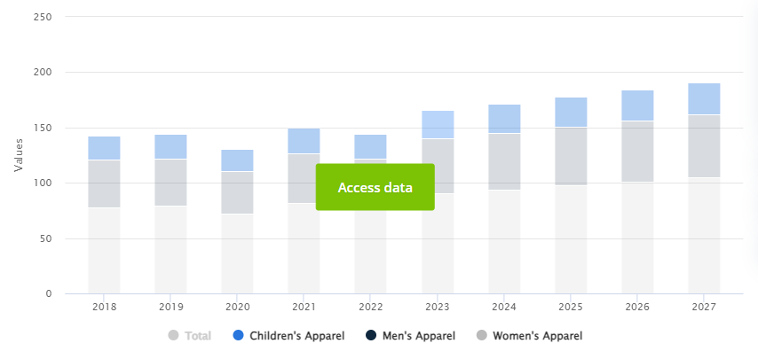
Figure 2: Apparel market values (Statista, 2023)
In 2024, the UK apparel sector is expected to bring in US$85.85 billion in sales. Statista (2023) states it is projected to rise at 3.55 percent per year (CAGR 2024–2027). Women’s apparel is the market category with the most significant volume, estimated to reach US$47.02 billion in 2024, as shown in figure 2 (Statista, 2023). With an estimated $359 billion in income in 2024, the United States tops the world in this regard when compared to other countries. According to Statista (2023), every individual in the United Kingdom is anticipated to generate US$1.26k per capita revenue in 2024. Looking into the future, the volume of the apparel market is predicted to reach 4.2 billion pieces by 2027. Furthermore, a 1.0 percent volume rise is anticipated in the industry in 2025 (Statista, 2023).
3.0 Company Analysis
3.1 Operational Performance
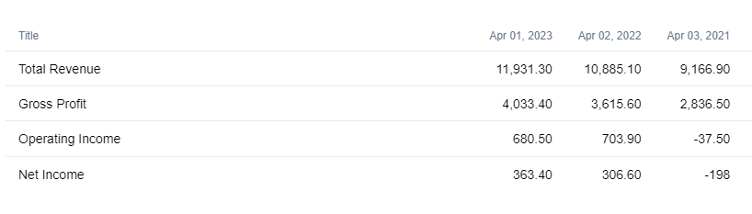
Figure 3: Operational performance elements (FML, 2024)
The drop in the operating and net profit margins is the source of M & S’s deteriorating profitability. Operating profit per dollar of sales was $703.90 million in 2023, down to $680.50 million in 2024, as shown in Figure 3 (FML, 2024). These low margins indicate that the business’s costs are rising, which is concerning since it suggests that not enough of the company’s income is available to pay for its non-operating expenditures. $306.60M in net profit was generated for every dollar in sales, rising to $363.40 in 2023, as shown in Figure 4 (FML, 2024). Creditors and investors would be interested in M&S because of its increasing capacity to turn a profit from its income.
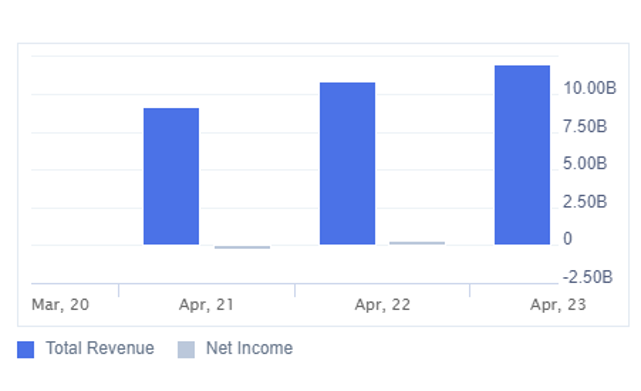
Figure 4: Net income (FML, 2024)
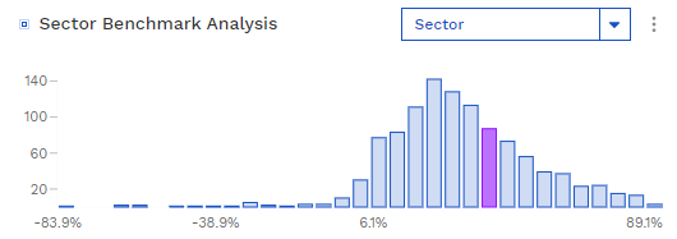
Figure 5: Overall distribution of gross profit margin (Finbox, 2024a)
The overall distribution of gross profit margin for businesses in the Consumer Staples sector in the Developed Economic Region is shown in Figure 5. In this investigation, 1,090 out of the 1,130 enterprises were found to have relevant values (Finbox, 2024a). The average gross profit margin within the sector is 30.4 percent, with a standard variation of 21.6 percent. The Gross Profit Margin of M&S Group plc, at 37.0%, is within the 66.3% percentile of the industry (Finbox, 2024a). After just one year, M&S’s reinvigorated business strategy shows promise, according to Briggs (2023), with end-of-year data showing increased sales and consumer engagement in the food, clothing, and home categories. However, M&S experiences growing pains due to investing in reshaping for growth (Briggs, 2023). With a forecast for moderate sales growth in FY2024, M&S’s recovery plan gives shareholders a dividend return and a stable foundation for the upcoming year.
3.2 Financial Performance
3.2.1 Debt Repayment Capacity
Table 1: Debt repayment capacity elements
| Fiscal Years | 2021 | 2022 | 2023 |
| Total Debt-To-Asset | 0.474 | 0.403 | 0.399 |
| Long Term Debt-ToAsset | 0.823 | 0.602 | 0.684 |
| Debt-To-Equity | 2.58 | 2.19 | 2.08 |
| Cash-Coverage Ratio | 0.8X | 3.4X | 3.6X |
M&S’s short-term and long-term debt dropped from $5.63 billion in 2021 to $4.49 billion in 2023 during the previous three years. Due to the debt reduction, M&S now has $1,081 million in cash and short-term assets available for company initiatives. Furthermore, M&S generated $1,068 million in operating cash during the previous year, 2023, yielding operating cash to total debt ratio of 23.77%, indicating that M&S has enough operating cash to pay down its debt (Ycharts, 2024). This ratio may also indicate operational effectiveness in place of return on assets. With its debt capital, M&S can produce 0.23 times as much cash as it needs. Given the number of current assets at $2.597 billion and the current liabilities value of $3.262 billion, the firm does not seem to be able to satisfy these commitments, as seen by the current ratio of 0.79x, which is below the recommended level of 3x (Wall Street Journal, 2024).
M&S has an above-average leverage ratio of 2.08 when compared to other companies. Financial soundness is defined as a company’s ability to generate earnings before interest and tax (EBIT) at least three times its net interest payments. Given that M&S’s ratio of 3.6x, as in Figure 6, indicates that interest is suitably covered, lenders might be more willing to extend credit to the firm since it is perceived as having a stable repayment history (Finbox, 2024c). Due to its strong cash coverage ratio, M&S can use its borrowings to create cash flow despite its high debt levels.
3.2.2 Du Pont Analysis
Table 2: Du Pont Analysis elements
| Operation
Profit Margin |
Asset
Turnover |
Equity
Multiplier |
ROE | |
| 2021 | 0% | 1.1X | 3.1X | -6.6% |
| 2022 | 0% | 1.3X | 3.0X | 11.8% |
| 2023 | 0% | 1.4X | 2.6X | 12.7% |
Figure 7: Return on Equity (Finbox, 2024a)
In the last three years, Marks & Spencer Group plc produced an average return on equity of 12.7%, as in Figure 7, which is typical for its sector (Finbox, 2024a). Compared with its contemporaries, M&S’s results show a relatively efficient business. In essence, profit margin shows how much sales are converted into earnings and how well the company manages costs (M&S, 2023b). On the other hand, M&S has been reporting a 0% profit margin in this instance. It is highly detrimental. The amount of money M&S can generate from its asset base is shown by its asset turnover. In September 2023, it was valued 1.4 times, as shown in table 2. The debt-to-equity ratio now stands at a respectable 2.08, implying the ROE results from its potential to deliver profit growth without a significant debt burden.
3.2.3 Liquidity Ratio
Table 3: Liquidity ratio elements
| Fiscal Years | 2021 | 2022 | 2023 |
| Current Ratio | 0.86 | 0.88 | 0.80 |
| Quick Ratio | 0.43 | 0.63 | 0.51 |
| Cash Ratio | 0.3X | 0.5X | 0.4X |
| Net-Working Capital/Asset | -10.4% | -10.5% | -9.9% |
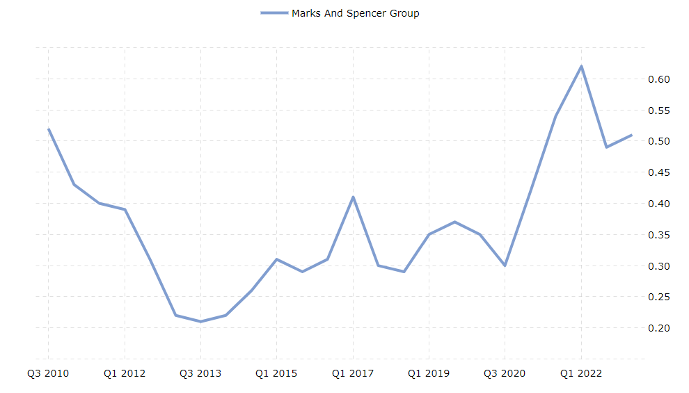
Figure 8: Quick ratio (Macrotrends, 2024)
Due to liquidity ratios below 1, M&S’s liquidity condition is unfavorable. There are 0.80 times as many current assets as current liabilities, according to the current ratio of 0.80, as in Table 3. The issue is that it is less than 1, which indicates that the company’s current assets are insufficient to meet its current liabilities. As a result, it may be difficult for the business to make its short-term payments on time. According to Macrotrends (2024), M&S’s quick ratio of 0.51, as in Figure 8, indicates that the business does not own enough quick assets to cover its short-term liabilities when they become due. The cash ratio grew from 0.3 to 0.4, indicating that M&S’s available cash, as well as cash equivalents, are insufficient to cover its present liabilities (Macrotrends, 2024). Creditors would be concerned since this indicates the firm does not maintain enough cash balances and may have to sell long-term assets to pay off its current commitments. The company requires more than its cash reserves to cover these costs.
3.2.4 Efficiency Ratio
Table 4: Efficiency ratio elements
| Fiscal Years | 2021 | 2022 | 2023 |
| Asset-Turnover | 1.7X | 2.2X | 2.4X |
| Inventory-Turnover | 10.51 | 10.72 | 10.59 |
| 34.74 days | 34.06 days | 34.46 days | |
| Receivable-Turnover | 72.41 | 106.56 | 107.93 |
| 59.47 days | 46.69 days | 35.96 days |
According to an analysis of the efficiency ratios, M&S manages operations and efficiently generates income from its assets. According to Morningstar’s 2024 report, the asset turnover of M&S yielded a revenue of $2.4 for every dollar of assets, as in Table 4. The asset turnover is positive since the business is increasing sales with the capital it has invested. Before selling its inventory, Marks and Spencer needed an average of 34.06 days in 2022 as well as 34.46 days in 2023 (Morningstar, 2024). According to Morningstar (2024), the inventory turnover rate indicates that the company sold its stock on average 10.72 times in 2022, down to 10.59 times in 2023. A higher inventory turnover rate is advantageous for the firm as it indicates that it is selling its stock more often, which lowers inventory costs, decreases obsolescence, and improves liquidity by turning stock into cash in days (Farooq, 2019). According to Morningstar (2024), the day’s receivables have also dropped from 46.69 in 2022 to 35.96 in 2023, demonstrating that the business collects its receivables more quickly, a sign of efficiency and aggressiveness.
4.0 SWOT Analysis
Strengths
- Solid brand reputation: The M&S brand enjoys a solid reputation that draws in customers and keeps them returning.
- Broad product selection: M&S serves a variety of consumer demands and tastes by providing a large selection of goods in the Food, Clothes & Home categories (Middleton, 2023). This variety aids in drawing in and keeping clients.
- Sustainability: M&S has an unwavering dedication to ethical sourcing as well as sustainability, which helps set it apart from rivals and win over customers who care about the environment (Elder, 2017).
- Robust online presence: M&S has a reputable online store that has grown significantly over the past few years.
- Emphasis on innovation: M&S has a track record of innovation, having been the first retailer in the UK to launch a loyalty card program.
Weaknesses
- Over-reliance on the UK market: Since the UK market accounts for most of M&S’s sales, the company is susceptible to changes in the nation’s consumer spending patterns and economic downturns (Schaverien, 2019).
- Limited global reach: M&S is still small compared to some of its rivals, although it has a developing global reach.
- Challenges in the apparel sector: M&S’s sales have decreased as a result of its inability to stay up to date with industry developments.
- High operational costs: Maintaining M&S’s substantial physical retail presence may be expensive.
Opportunities
- International expansion: M&S has the chance to increase its global footprint, especially in developing nations like Asia and Africa.
- E-commerce expansion: In response to the evolving demands of its customers, M&S has the chance to expand its e-commerce capabilities, which have been expedited by the COVID-19 epidemic (Middleton, 2023).
- Sustainability: M&S has demonstrated a solid commitment to sustainability previously, but investing in sustainable methods and products may further set itself apart from competitors.
- Collaborations and partnerships: M&S may work with other businesses and brands to broaden its range of products and target new markets (Schaverien, 2019).
- Innovation: M&S has a history of innovation, and there are chances to build on this by introducing new goods and services, such as digital technologies, to draw in and keep clients.
Threats
- Intense rivalry: M&S confronts competition from conventional shops and online companies in the fiercely competitive retail sector.
- Economic unpredictability: Since most of M&S’s income comes from the UK market, the company is susceptible to changes in consumer spending patterns and economic downturns (Elder, 2017).
- Disruptions to the supply chain: M&S obtains goods from all over the world, so events like natural catastrophes or unstable political environments may affect its capacity to deliver goods to clients.
- Shifts in customer behaviour: If M&S cannot adjust to these changes, its sales and market position may be negatively impacted. Examples of such shifts include a preference for online shopping and a focus on sustainability.
5.0 Summary of Findings
M&S is active within the Food and also Clothing & Home segments. With more than 950 stores in the UK and also a growing global presence, M&S made $14.3 billion in revenue during the fiscal year 2021. Moreover, ethical sourcing aligns with the company’s bold commitment to achieve carbon neutrality by 2035. The apparent behavior of the macro and micro environment is characterized by contrasting challenges that include economic uncertainties arising from Brexit, together with the changing preferences among customers. Looking at M&S’s operational and financial performance, the company has a wide range of products, a strong online presence, and revenue growth. M&S’s debt level is decreasing, and its Du Pont analysis implies a satisfactory return on equity financially. However, the liquid ratios reveal many difficulties in meeting the short-term liabilities, questioning the current assets management practices. SWOT analysis pinpoints the strength factors of M&S, such as the strong brand image and their commitment to sustainability, but also identifies weaknesses, including an over-reliance on the UK market sales and opportunities presented by the challenges in clothing production. The chances exist for international expansion, e-commerce development, sustainability ventures, partnerships, and innovations. The threats include increased competition, economic uncertainty, supply chain disruptions, and also changes in consumer behavior.
6.0 Restructuring
6.1 Streamlining Physical Presence
To strengthen the operational effectiveness and fiscal stability, Marks & Spencer is set to benefit immensely from a focused examination of its far-reaching physical store chain. The proposal involves shutting 50 underperforming stores, resulting in a store count drop to 900. It is estimated to result in an annual cost reduction of $20 million through improved and simplified operations. Such a discerning reduction perfectly conforms to the set direction of improving liquidity ratios, since improvements in current ratio from 0.80 to up by 0.85 and quick ratio from 0.51 to 0.55 are forecasted respectively. These changes are set to lay the ground for a praiseworthy 1% increase in the net profit margins, reaching an envisioned 7% that is propelled by a leaner operating model.
6.2 International Expansion
To overcome the economic uncertainties, Marks & Spencer is advised strongly to pursue strategic overseas expansion in high-potential regions such as Asia and also Africa. The proposal’s scope includes opening 20 new stores in these growing economies, targeting a revenue contribution from the international markets pegged at only 5 percent additional contribution for the next fiscal year. This initiative’s desired benefits include an estimated $100 million revenue gain annually and a distinct diversification strategy to curb the current 85% dependence on the UK market to 75%. In addition, the expansion plan can counteract market-specific risks; this could lead to an earnings volatility reduction of 2%. These targets also highlight the strategic nature of this expansion and define an effective means by which its success can be evaluated.
6.3 Debt Management and Financing Strategies
In its quest to achieve financial optimization and stability, Marks & Spencer should consider alternative debt management and finance strategies. It involves a bond issue of $200 million with an attractive interest rate of 3.5% and the formation of a strategic partnership for a deviated product development joint venture worth above $300 million. These fundamental changes are predicted to result in a significant decrease in the debt-to-equity ratio from 2.08, which is reported now, up to a more favorable 1.80 level as it receives improvements from these tangible markers. Additionally, the company anticipates $5 million in annual interest expense savings, demonstrating its commitment to a greener and leaner capital structure. The suggested actions would not only mitigate the financial risk that Marks & Spencer faces but also improve its overall operational stability in terms of finances.
Table 5: Restructuring Plan
| Restructuring plan | Current quantifiable | Restructured quantifiable |
| Streamlining Physical Presence | Total Stores: 950 | Total Stores: 900 |
| Annual Cost Savings: $0 | Annual Cost Savings: $20 million | |
| Current Ratio: 0.80 | Current Ratio: 0.85 | |
| Quick Ratio: 0.51 | Quick Ratio: 0.55 | |
| Net Profit Margin: 6% | Net Profit Margin: 7% | |
| International Expansion | New Stores: 0 | New Stores: 20 |
| Revenue Contribution: 0% | Revenue Contribution: 5% | |
| Annual Revenue Increase: $0 | Annual Revenue Increase: $100 million | |
| Dependence on the UK Market: 85% | Dependence on the UK Market: 75% | |
| Earnings Volatility Reduction: 0% | Earnings Volatility Reduction: 2% | |
| Debt Management and Financing Strategies | Debt-to-Equity Ratio: 2.08 | Debt-to-Equity Ratio: 1.80 |
| Interest Expense Savings: $0 | Interest Expense Savings: $5 million | |
| Interest Coverage Ratio: 3.6x | Interest Coverage Ratio: 4.2x |
7.0 Conclusion
In summary, Marks & Spencer Group PLC is set for a strategic restructuring through targeted revival initiatives. The suggested measures, consisting of rationalizing on-site presence, going global, and debt repayment mechanisms, aim to provide specific directions for improving operating efficiency through revenue diversification while pursuing better financial sustainability. Adapting to the changing market forces and building on strengths will help M&S sail through the challenges, capitalize on gains, and cement its position in the industry. The recommendations provide a foundation for sustainable growth and value creation, thus ensuring M&S’ stability in the ever-changing retail market.
8.0 References
Abdulla, S. and Bruce, A. (2024). UK retail sales slump points to new risk of recession. Reuters. [online] 19 Jan. Available at: https://www.reuters.com/world/uk/british-retail-sales-slump-32-december-2024-01-19/ [Accessed 25 Jan. 2024].
Briggs, F. (2023). M&S outperforms as sustainable growth plan delivers, says GlobalData. [online] Retail Times. Available at: https://retailtimes.co.uk/ms-outperforms-as-sustainable-growth-plan-delivers-says-globaldata/ [Accessed 25 Jan. 2024].
Croudace, L. (2021). Economic trends in the retail sector, Great Britain – Office for National Statistics. [online] Ons. Available at: https://www.ons.gov.uk/economy/nationalaccounts/balanceofpayments/articles/economictrendsintheretailsectorgreatbritain/1989to2021 [Accessed 25 Jan. 2024].
Elder, B. (2017). Marks and Spencer rises on turnround prediction. [online] Financial Times. Available at: https://www.ft.com/content/6bad91a2-fde0-11e6-96f8-3700c5664d30 [Accessed 25 Jan. 2024].
Farooq, U. (2019). Impact of Inventory Turnover on the Profitability of Non-Financial Sector Firms in Pakistan. Journal of Finance and Accounting Research, 01(01), pp.34–51. doi:https://doi.org/10.32350/jfar.0101.03.
Finbox (2024a). Gross Profit Margin for Marks and Spencer Group plc. [online] Finbox. Available at: https://finbox.com/LSE:MKS/explorer/gp_margin/#:~:text=Marks%20and%20Spencer [Accessed 25 Jan. 2024].
Finbox (2024b). Return on Common Equity for Marks and Spencer Group plc. [online] Finbox. Available at: https://finbox.com/LSE:MKS/explorer/roe/#:~:text=Marks%20and%20Spencer [Accessed 25 Jan. 2024].
Finbox (2024c). Interest Coverage Ratio for Marks and Spencer Group plc. [online] Finbox. Available at: https://finbox.com/LSE:MKS/explorer/interest_coverage/ [Accessed 25 Jan. 2024].
Fusion Media Limited (2024). Marks & Spencer (MKS) Financial Summary. [online] Investing.com India. Available at: https://in.investing.com/equities/marks—spencer-group-financial-summary?period_type=annually [Accessed 25 Jan. 2024].
M&S (2022). Our History. [online] Marks & Spencer. Available at: https://corporate.marksandspencer.com/about-us/our-history [Accessed 25 Jan. 2024].
M&S (2023b). Half Year Results For 26 Weeks Ended 30 September 2023 ‘RESHAPING M&S’ STRATEGY DELIVERS STRONG RESULTS. [online] Marks & Spencer. Available at: https://corporate.marksandspencer.com/media/press-releases/half-year-results-26-weeks-ended-30-september-2023-reshaping-ms-strategy [Accessed 25 Jan. 2024].
Macrotrends (2024). Marks and Spencer Group quick ratio. [online] Macrotrends. Available at: https://www.macrotrends.net/stocks/stock-comparison?s=quick-ratio&axis=multiple&comp=MAKSY [Accessed 25 Jan. 2024].
Marks and Spencer Group plc (2023a). Annual Report. [online] Marks & Spencer. Available at: https://corporate.marksandspencer.com/sites/marksandspencer/files/2023-06/M%26S_2023_Annual_Report.pdf [Accessed 25 Jan. 2024].
Middleton, J. (2023). Demand for holidaywear and food lifts M&S profit expectations. The Guardian. [online] 15 Aug. Available at: https://www.theguardian.com/business/2023/aug/15/marks-and-spencer-upgrades-profit-outlook-as-market-share-in-food-and-clothing-grows [Accessed 25 Jan. 2024].
Morningstar (2024). MKS – Marks & Spencer Group PLC Operating Performance | Morningstar. [online] Morningstar Inc. Available at: https://www.morningstar.com/stocks/xlon/mks/performance [Accessed 25 Jan. 2024].
Partington, R. (2023). UK recession risk grows as higher interest rates weigh on firms. The Guardian. [online] 22 Sep. Available at: https://www.theguardian.com/business/2023/sep/22/uk-recession-risk-mounts-as-higher-rates-weigh-on-firms [Accessed 25 Jan. 2024].
Schaverien, A. (2019). Why A Marks & Spencer-Ocado Partnership Makes Sense For Both Retailers. [online] Forbes. Available at: https://www.forbes.com/sites/annaschaverien/2019/01/30/ocado-marks-and-spencer-mands-partnership-waitrose/ [Accessed 25 Jan. 2024].
Statista (2023). Apparel – United Kingdom | Statista Market Forecast. [online] Statista. Available at: https://www.statista.com/outlook/cmo/apparel/united-kingdom#:~:text=The%20Apparel%20market%20in%20the [Accessed 25 Jan. 2024].
Wall Street Journal (2024). MKS.UK | Marks & Spencer Group PLC Financial Statements – WSJ. [online] Wall Street Journal. Available at: https://www.wsj.com/market-data/quotes/UK/MKS/financials.
Ycharts (2024). Marks & Spencer Group Debt to Equity Ratio. [online] Ycharts. Available at: https://ycharts.com/companies/MAKSF/debt_equity_ratio#:~:text=Marks%20%26%20Spencer%20Group%20Debt%20to%20Equity%20Ratio%3A%201.157%20for%20Sept [Accessed 25 Jan. 2024].
 write
write