Introduction
Children rely on their parents for their growth and development. Therefore, when parents are unemployed, they cannot support the household. Limited parental support interferes with the minor’s performance and safety. Alabama and New York are two locations where children are exposed to various challenges because of their parents’ unemployment state. The COVID-19 pandemic exacerbated the condition by revealing the severity of the problem. High unemployment rates of parents in Alabama and New York interfered with children’s safety and well-being during the pandemic; however, the situation changed in 2022 when the unemployment rate reduced significantly.
Data Analysis
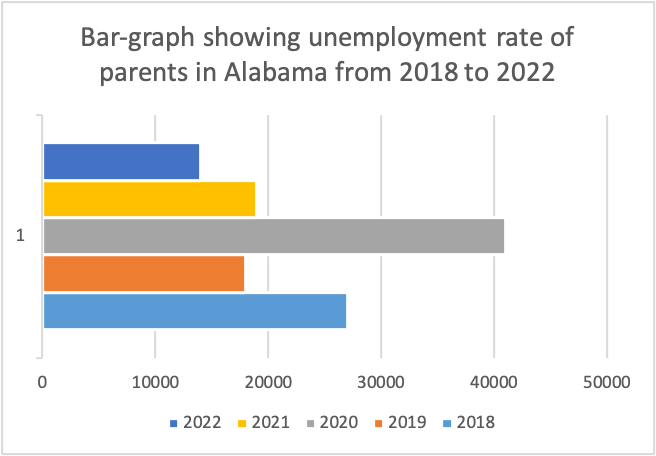
Fig. 1
The bar graph shows that in 2020, there was the highest unemployment rate of parents in Alabama. High unemployment rates threaten children’s safety because parents cannot support their household. The increase in unemployment during that time is attributed to the COVID-19 pandemic that resulted in the loss of employment. Other adults in Alabama closed down their businesses and economic activities during the pandemic and government directives to stop business. High unemployment among patients in Alabama exposes children to poor nutritional choices, health risks, and other challenges associated with low income.
The graph also shows that in 2018, there was a high unemployment rate among parents from Alabama. The trend of adult unemployment shows that parents are vulnerable to losing employment. However, in 2022, Alabama recorded the lowest unemployment rate in adults. The employment growth in the adult population in the post-pandemic era revealed that the authority introduced proper recovery means from the highest unemployment rate to declining in consecutive years. The trajectory illustrates that children’s safety was also gradually returning.
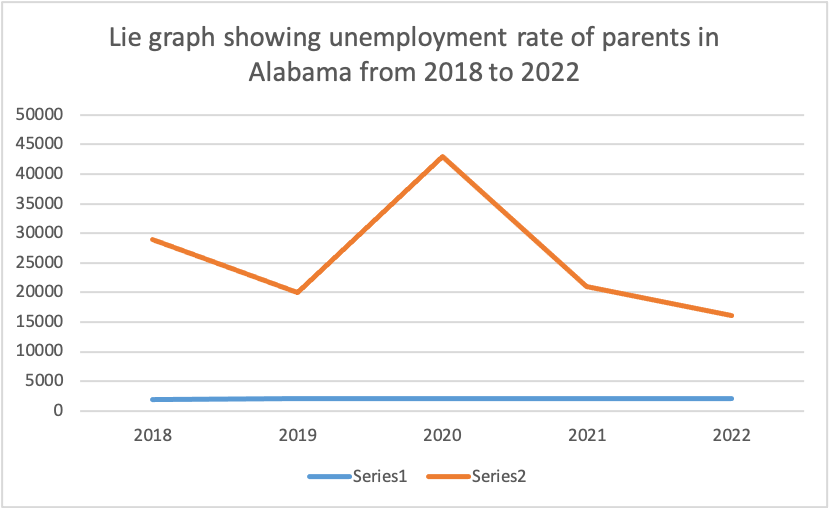
Fig. 2
. Fig.2 illustrates the trend of unemployment in parents in Alabama. The line graph shows that in 2020, there was the highest adult unemployment. Many Alabama parents were unemployed. In 2019 and 2018, parents struggled to care for the household without money. However, the graph shows that 2022 had the lowest unemployment rates. The lowest adult employment rates affect families. Low unemployment among adults protects children from the effects of financial challenges. The unemployment rate in the household also causes gender and domestic violence—parental confrontation because of poverty results in separation and divorce. The separation affects children’s growth and development. Other parents become traumatized and depressed due to their inability to sustain their household. Disturbed adults may display unexpected behaviours because of depression.
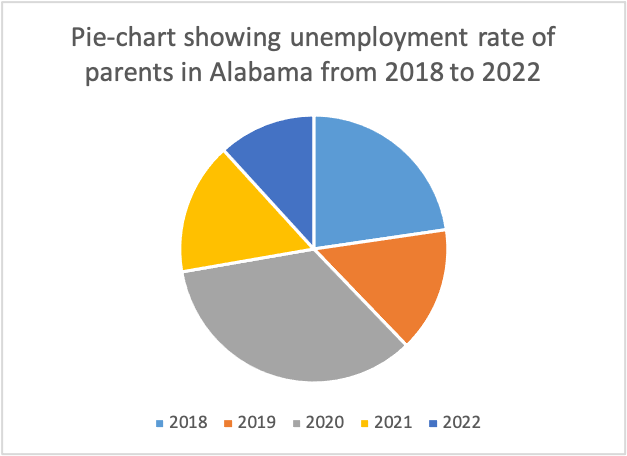
Fig. 3
Fig. 3 is a chart that shows the unemployment rate of parents in Alabama. The grey section is the biggest. The pie chart has the same conclusion as the other two data representations. The pie chart is simple to read and interpret. The statistics show the dangers that children encountered during the pandemic. Limited attention to child abuse caused more mental breakdown and distress. Older people received more attention than children because senior adults were vulnerable compared to children. The pie chart shows that 2022 has the lowest parent unemployment. The remaining years show a relatively low parent unemployment. The U.S. protected the household against the effect of high living costs. The low poverty rate because of unemployment exposed children and other vulnerable family members to reduced economic challenges.
The three visual images show the same information. However, the graphical representations are different. Drawing and using the pie chart for data representation is the most suitable choice because it was easy to remove and read the pie chart. Also, reading the pie chart was less time-consuming than reading the lie and bar graphs. The presence of three visual representations provides room for choice. In addition, the three research representations permitted comparison. New York is another location with the same data as Alabama because, in 2020, the area had its highest unemployment rate. The two locations share 2020 as the worst year. Also, in 2022, there were low unemployment rates for parents in Alabama and New York with low unemployment rate. The similarity shows that the U.S. government was enrolling countrywide intervention post-COVID-19 times. Hence, different states were getting almost similar intervention impacts.
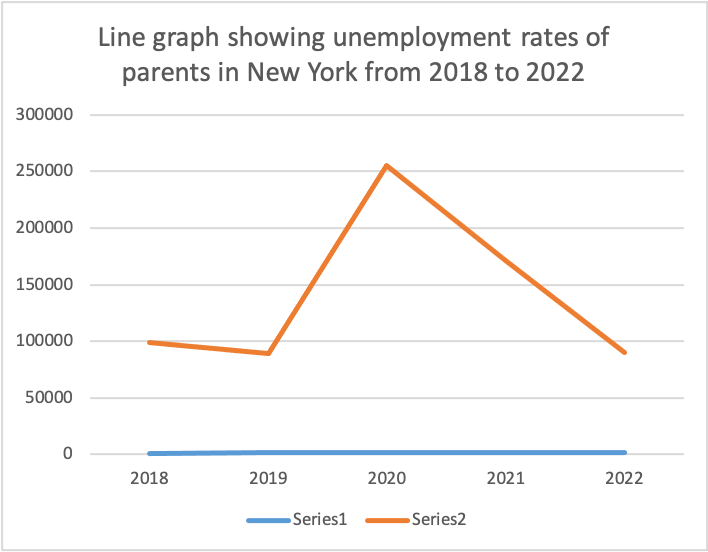
Fig. 4
Fig. 4 shows the unemployment trend of New York’s parents. Before the pandemic, the unemployment rate was lower than before and during the pandemic. The strong economy enabled the U.S. government to employ adult New York residents with families. Therefore, employed parents protect their children from the challenges of financial constraints. Poor preparation against the pandemic due to limited preparation time exposed the U.S. economy and households to various problems at the pandemic’s peak (Blustein et al., 2020). New York is among the busy cities that closed most activities to prevent the virus infection and transmission. 2020 shows a challenging year for parents encountering depression and mental breakdown due to their inability to provide for and sustain the family. Children become victims of GBV in an economically struggling household.
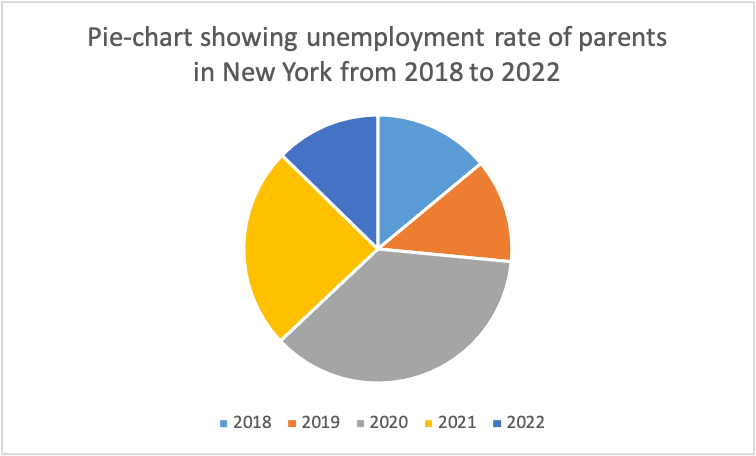
Fig. 5
Fig. 5 is the chart with the same findings as the line graph. However, the pie chart has a unique experience. The chart sections show different unemployment rates in New York in five years. Children are also victims of economic occurrences between 2018 and 2022. Young people in New York depend on their parents for social support, provision of basic needs, and other assistance. Still, monetary problems limit parents’ involvement in safe childhood upbringing (González et al., 2020). Therefore, children cannot attend and perform well in school when their parents cannot support them. In 2020, the highest unemployment rate among parents reveals how New York older adults experience challenges caring for their children. Besides, the government closed learning institutions. As a result, most children were at home at the pandemic’s peak. Many unemployed parents struggle to care for their younger ones at home.
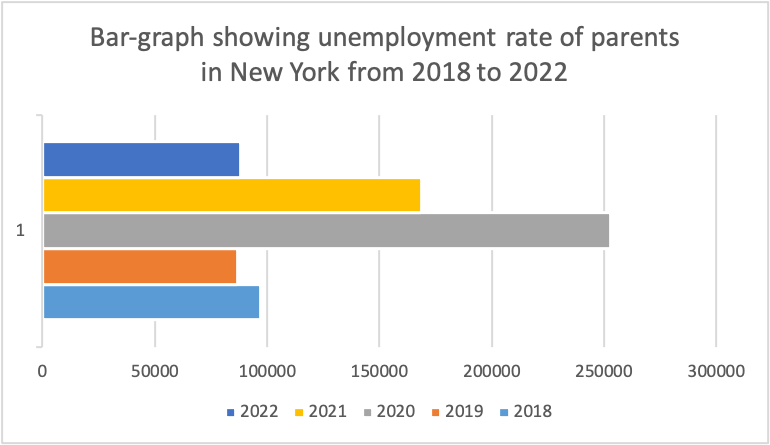
Fig. 6
The bar graph shows that 2020 and 2021 were tough years for unemployed parents in New York. Due to high unemployment rates, older adults needed help caring for their households due to frequent monetary issues. Minors rely on their parents frequently. Therefore, children depended on their parents’ social support during the pandemic. However, unemployed parents were preoccupied with worries about the impact of unemployment on the household (Raifman et al., 2021). The bar graph shows a significant reduction in the unemployment rate among men in 2022. The per cent decline reveals how the U.S. government is responding to the effects of the pandemic. Governmental intervention helps in speeding the recovery process. 2022 depicted a positive recovery, guaranteeing children their safety and return to normalcy.
Conclusion
From 2018 to 2022, Alabama and New York parents encountered different economic conditions due to the pandemic. In 2018, unemployment among parents in Alabama and New York was low because the U.S. economy employed many adults. However, the COVID-19 pandemic resulted in massive job losses. Also, the government shut down the economy as part of the intervention. Therefore, enormous job loss disrupted normalcy in most households. Children were among the victims of the pandemic at the household level because parents could not provide the required support without earning.
References
Blustein, D. L., Duffy, R., Ferreira, J. A., Cohen-Scali, V., Cinamon, R. G., & Allan, B. A. (2020). Unemployment in the time of COVID-19: A research agenda. Journal of Vocational Behavior, 119, 103436. https://doi.org/10.1016/j.jvb.2020.103436
González, L., Cortés-Sancho, R., Murcia, M., Ballester, F., Rebagliato, M., & Rodríguez-Bernal, C. L. (2020). The role of parental social class, education and unemployment on child cognitive development. Gaceta sanitaria, 34, 51-60. https://doi.org/10.1016/j.gaceta.2018.07.014
Raifman, J., Bor, J., & Venkataramani, A. (2021). Association between receipt of unemployment insurance and food insecurity among people who lost employment during the COVID-19 pandemic in the United States. JAMA network open, 4(1), e2035884-e2035884. https://jamanetwork.com/journals/jamanetworkopen/article-abstract/2775731
 write
write