Brief company background
Johnson & Johnson is a multinational healthcare company in the pharmaceutical, medical devices, and consumer goods sectors. The company is listed on the New York Securities Exchange with a ticker symbol, JNJ. The current market capitalization is circa 500 billion making it one of the most valuable companies globally. It is a component of the S&P 500. The company has three segments; the Pharmaceutical segment, the MedTech segment, and the consumer segment, which offers various products and services. The author examines JNJ’s financial performance through various financial analyses, such as fundamental and technical analyses. Fundamental analysis involves the evaluation of ratios and other financial metrics, as well as qualitative information, such as the company’s management.
Economic environment
JNJ operates in a highly competitive industry and must continually innovate and develop new products to stay ahead. The company’s robust brand recognition, global presence, and diverse product portfolio maintain its position as a significant player in the healthcare industry. However, JNJ must remain vigilant and adapt to changing market conditions to remain competitive in the future.
Johnson & Johnson (JNJ) is a multinational company serving various healthcare industry segments, including pharmaceuticals, medical devices, and consumer healthcare products. JNJ competes with companies such as Pfizer, Novartis, and Roche in the pharmaceutical segment. These companies have a strong presence in the global pharmaceutical market and offer a wide range of products in various therapeutic areas. JNJ has a strong pipeline of products in development, including medicines for cancer, autoimmune diseases, and infectious diseases, that help us stay ahead of the competition.
JNJ faces competition from companies such as Medtronic, Stryker, and Abbott Laboratories in the medical device segment. These companies offer various products, including implants, surgical instruments, and diagnostic equipment. JNJ has a strong presence in the orthopedic and cardiovascular markets but faces stiff competition from other players in other segments.
JNJ competes with companies such as Procter & Gamble, GlaxoSmithKline, and Bayer in the consumer health segment. These companies offer a variety of consumer healthcare products, including over-the-counter medicines, oral care products, and skincare products. JNJ has a strong presence in the baby care, oral care, and skin care markets but faces competition from other players in other segments.
Financial performance
A company’s financial performance can be measured by various techniques such as revenues, earnings, and financial using information provided by the company in the annual reports and comparing it with the industry. JNJ has performed well financially over the last three years, as observed in table 1. The table shows that revenue has increased from $ 82.58 billion in 2020 to 94.94 $ billion in 2022. Similarly, net income increased from $ 14.71 billion to $ 17.94 billion in 2022. There was a slight decline in earnings in 2022, as shown by the decline in EBITDA by $ 1.38 billion from the previous year.

Source: Morningstar.com

Source: Investing.com
Financial ratios provide crucial insights into the company’s performance since they provide quantitative figures that can be compared with previous periods or across the industry. Table 2 shows different financial ratios used to analyze the financial performance of JNJ.
P/E Ratio
JNJ’s P/E Ratio TTM (price-to-earnings ratio) is 24.06, higher than the industry average of -47.83. The P/E ratio measures the price investors are willing to pay per dollar of earnings. In this case, JNJ’s P/E ratio is higher than the industry average, indicating that the market values the company’s earnings more highly. It indicates that the company’s stock is overvalued, which indicates investor confidence.
Net Profit Margin
JNJ’s Net Profit Margin 5YA (net profit divided by total revenue over five years) is 16.74%, higher than the industry average of -35.78. The net profit margin measures the percentage of revenue after all expenses, including taxes and interest, have been deducted. JNJ’s high net profit margin indicates that the company is more profitable than its peers in the industry.
Return on Equity
JNJ’s Return on Equity 5YA (net income divided by shareholder equity over five years) is 22.32%, which is higher than the industry average of 12.31. The return on equity measures how much profit a company generates for every dollar of shareholder equity. JNJ’s high return on equity indicates that the company generates significant profits for its shareholders.
Return on Assets
JNJ’s Return on Assets 5YA (net income divided by total assets over five years) is 8.78%, slightly lower than the industry average of 9.78. The return on assets measures how much profit a company generates for every dollar of assets. JNJ’s return on assets is good, indicating that the company is efficiently using its assets to generate profits.
5 Year EPS Growth
Earnings per share is a crucial financial metric in equity market analysis. JNJ’s 5-Year EPS Growth 5YA (percentage change in earnings per share over five years) is 69.89%, which is significantly higher than the industry average of 7.91. The 5-year EPS growth measures the rate at which earnings per share have grown over five years. JNJ’s high 5-year EPS growth indicates that the company is experiencing robust earnings growth.
5 Year Sales Growth
JNJ’s 5-Year Sales Growth 5Y is 4.43%, slightly lower than the industry average of 7.1. The 5-year sales growth measures the rate at which a company’s revenue has grown over five years. JNJ’s sales growth is still positive but growing slower than its peers. This shows that JNJ is in the maturity stage of the business lifecycle compared to its peers, which are in the growth stage. The company’s management should use product innovation and business process reengineering to avoid a decline.
Current Ratio
This ratio measures the ability of a company to pay its short-term liquidity, that is, the ability to meet short-term obligations as and when they fall due. A ratio of 1 or greater is usually considered good, as it indicates that a company has enough current assets to cover its current liabilities. JNJ’s current ratio is 0.99, slightly lower than the industry average of 1.22. This may indicate that JNJ needs some help paying off its short-term liabilities in the short-term since it is less than 1. On the contrary, it also shows that the company’s operational efficiency is at top gear, such that it manages to operate effectively with minimal assets.
Debt to equity ratio
The debt-to-equity ratio shows the proportion of a company’s total debt compared to its equity. A lower ratio is usually better as it indicates a lower amount of debt in relation to equity. JNJ has a D/E ratio of 53.33%, lower than the industry average of 126.68%. This indicates that JNJ has a lower proportion of total debt than its equity, which is considered a positive sign.
Asset Turnover
This ratio measures the efficiency of a company in using its assets to generate revenue. A higher ratio is usually better as it indicates that a company generates more revenue with each dollar of assets. JNJ has an Asset Turnover ratio of 0.51, slightly lower than the industry average of 0.53. This may indicate that JNJ needs to use its assets more efficiently to generate revenue.
Receivable Turnover
This ratio measures how efficiently a company is collecting its outstanding receivables from customers. A higher ratio is usually better as it indicates that a company is collecting its receivables more quickly. JNJ has a Receivable Turnover ratio of 5.92, higher than the industry average of 4.71. This indicates that JNJ collects its outstanding receivables more efficiently than its peers.
Dividend Yield
This ratio shows the percentage of a company’s current stock price that is paid out annually in dividends. A higher yield is usually better as it indicates a higher shareholder return. JNJ has a Dividend Yield of 2.58%, slightly higher than the industry average of 2.33%. This indicates that JNJ provides a slightly higher return to its shareholders through dividends than its peers.
The financial analysis above shows that JNJ generally performed well compared to the industry regarding profitability, growth, and debt management. However, the company’s liquidity and asset turnover are slightly weaker than the industry average. Nonetheless, JNJ is a strong brand, diversified product portfolio, and consistent dividend payouts, which make it a reliable investment option for long-term investors.
Absolute valuation
Absolute valuation determines a company’s intrinsic value based on fundamentals such as earnings, cash flow, and net worth. This includes using financial ratios and ratios to calculate a company’s value regardless of market conditions or share price. Absolute valuation methods include Discounted Cash Flow Analysis (DCF), which calculates the present value of expected future cash flows, and Dividend Discount Model (DDM), which calculates the present value of expected future dividend payments. Absolute valuations are useful for investors who want to determine whether a company’s stock is undervalued or overvalued relative to its intrinsic value.
Dividend Discount Model
It is possible to determine the absolute valuation of JNJ using the DDM. The required values include the cost of equity, the perpetual growth rate, and the expected. The expected dividend was determined using the current and average dividend growth rates. The cost of equity was obtained using the CAPM formula. The expected return is 7.5%, and the growth rate is assumed to be 5%. Using the DDM, the value of the company’s stock can be calculated as follows;
P0= D1/(r-g)
P0 = 4.73/(7.5%-5%) = 189.04
The actual stock value is $ 165.15. Compared to the estimated value of $ 189.04, the stock is overvalued.
Relative valuation
Relative valuation attempts to determine the value of an asset by looking at how it compares to the valuation of other similar assets in terms of underlying financial metrics such as revenue, sales, and book value. This approach usually involves using multiples like the price-to-earnings ratio (P/E), price-to-sales (P/E), or price-to-book value (P/E) ratio to compare the company’s valuation versus the index. Table 3 below shows the 5YA valuation ratios for JNJ versus the index.

Source: Investing.com
The price/sales ratio compares the company’s market capitalization to its annual revenue. The P/S ratio for JNJ is 4.74 compared to the industry’s 2.24. This implies that investors are willing to pay more for every dollar of JNJ’s sales than the industry. A high P/S ratio indicates that the market has high expectations for the company’s growth potential. JNJ has higher than the average industry ratios for all four metrics analyzed. This suggests that the market has high expectations for JNJ’s growth potential, earnings, cash flow, and assets.
Technical Analysis
Technical analysis involves the analysis of past stock prices using charts to predict future prices. Analysts use charts such as candlestick patterns, Bollinger Bands, moving averages, and RSI, among others, to make informed stock decisions. The researcher compared JNJ’s cumulative stock return with that of the S&P 500, and the results are shown in Figure 1 below.
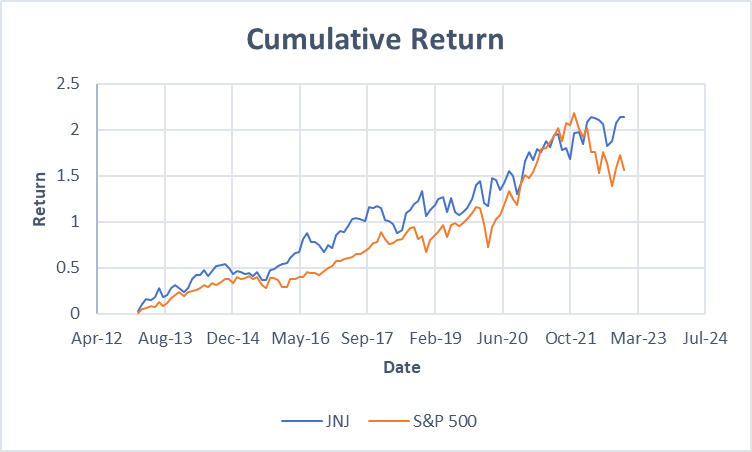
Source: Author
Figure 1 shows the patterns for the cumulative returns of the JNJ stock versus the index. It indicates that the company’s stock has outperformed the market. There was a significant decline in the first quarter of 2020, coinciding with the height of the Covid 19 pandemic. Again, there has been a decline from the fourth quarter of 2021, which reflects the current issue of global inflation and geopolitical conflicts between Russian and Ukraine. Apart from the stock returns shown above, the author also utilized other technical indicators shown in Figure 2.
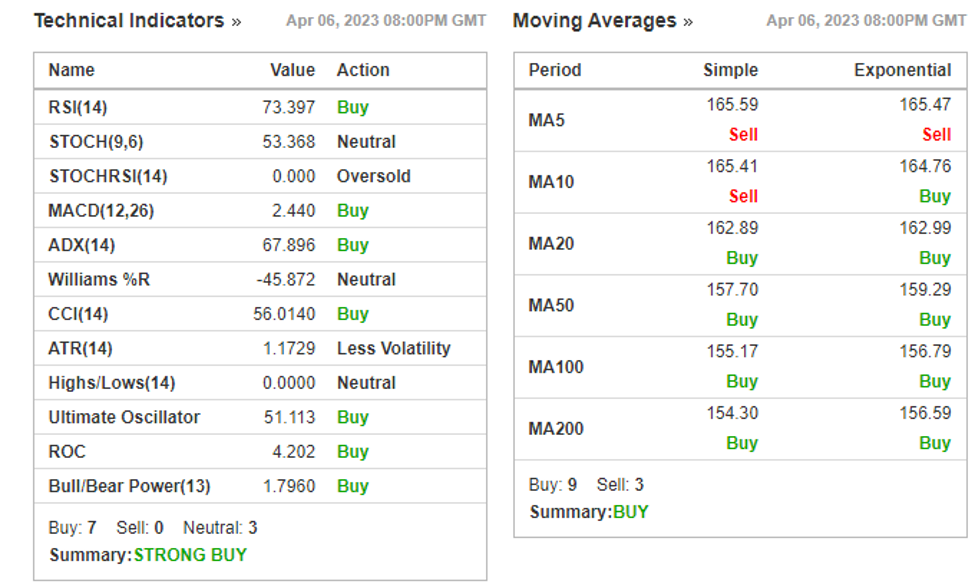
Source: Investing.com
Based on the technical analysis provided, Johnson & Johnson (JNJ) is a strong buy. The moving Averages indicators suggest that the stock has a generally positive trend, with the 20-day moving average crossing over the 50-day moving average and both pointing upwards. The Relative Strength Index (RSI) of 73.397 is above the threshold of 70, indicating that the stock is currently overbought. However, this suggests strong buying pressure in the market, leading to the current uptrend. The Moving Average Convergence Divergence (MACD) indicator of 2.44 also suggests a bullish trend.
Investment Recommendation
Johnson & Johnson (JNJ) is a strong buy stock. JNJ is a large and well-established company with a market capitalization of $500 billion and good revenues and earnings annually. The fundamental analysis using financial ratios and other metrics shows that the stock has outperformed its peers. The valuation ratios indicate that the stock is over-valued, which suggests a high buying pressure.
JNJ also has a relatively low beta of 0.536, which indicates that its stock price is less volatile than the overall market. In addition, JNJ pays a dividend with a yield of 2.97%, which is attractive to investors seeking income. The stock is suitable for long-term investors who want to buy and hold. The holding period return is substantially higher than the S&P 500 index.
References
Johnson & Johnson (JNJ) Financial Ratios. (n.d.). Investing.com. https://www.investing.com/equities/johnson-johnson-ratios
Morningstar, Inc. (2023, April 7). Morningstar, Inc. https://www.morningstar.com/stocks/xnys/jnj/valuation
Morningstar, Inc. (2023b, April 7). Morningstar, Inc. https://www.morningstar.com/stocks/xnys/jnj/financials
Johnson and Johnson. (n.d.). 2022 Annual Report Johnson and Johnson. JNJ.com. Retrieved April 9, 2023, from https://www.investor.jnj.com/asm/2022-annual-report
 write
write