Introduction
Overview
Econometrics is the application of statistical methods to economic data to give empirical content to financial relationships. It includes developing and applying models and methods for forecasting, testing, and explaining economic data and relationships.
Econometrics in Stata is a suite of statistical tools used to analyze economic data. It is designed to provide a comprehensive set of tools for analyzing various economic phenomena. It covers time series analysis, nonlinear regression, panel data analysis, and more. With Stata, you can quickly and easily analyze data from various sources, including surveys, databases, and spreadsheets (Watson & Teelucksingh,2002).
Objectives
The purpose of this econometric report is to carry out a time series analysis for the G7 countries from 1980 to 2021 to investigate the impacts of economic conditions based on the Unemployment rate, Civilian labor force participation rate, Average weekly earnings, Real GDP (% change), and Consumer price inflation on the people’s desire to work. This report uses data from the Fred and World Bank databases to analyze the civilian labor force participation rate, real GDP, average weekly earnings, consumer price inflation, and unemployment rate data. The econometric model chosen for this analysis is a time series regression model. The rationale behind this choice is that the data is time-series data. Therefore, the time-series regression model is the most appropriate for investigating economic conditions’ effects on people’s work desires.
Data
The data from the Fred and World Bank databases are used in this report for the G7 countries econometric analysis: United States of America, Canada, Japan, France, Germany, United Kingdom, and Italy from 1980 to 2021. The variables used in this analysis are the civilian labor force participation rate, real GDP, average weekly earnings, consumer price inflation, and unemployment rate on different case scenarios amongst annual historical data for the G7 countries
Methodology
A time series regression model was used to investigate the impacts of economic conditions on people’s desire to work in the G7 countries (Heckman,2015). This model considers the effects of the economic variables on the civilian labor force participation rate. The model also considers any lagged effects of other economic variables, including the G7 countries’ average weekly earnings, unemployment rate, real G.D., and consumer price inflation (Franses,2002).
The Equation Editor
The estimating equation used is the Yi = β0 + β1X1i + β2X2i + μi in which Y is the dependent variable representing the civilian labor force participation rate, unemployment rate average weekly earnings, consumer price inflation, and real GDP, X1 and X2 are independent variables for the years and currency, β0 is a constant, β1 and β2 are the coefficients, and μi is the error term(Koop, 2008).
F statistic
The F statistic tests the significance of the entire model for the G7 historical annual data econometric analysis (Wang,2006). The F statistic in the analysis is calculated by dividing the mean square between (MSB) by the mean square within (MSW). The F statistic tests whether the model’s coefficients are statistically significant.
Tests for heteroscedasticity on the obtained data from Fred and World Bank databases are performed using the Breusch-Pagan test and the White test. Tests for Multicollinearity are also performed using the Variance Inflation Factor (VIF), and the condition index and output are analyzed (Heckman,2015). A normality test on the G7 countries’ historical annual data is conducted from 1980 to 2021 to ensure that the data used in the estimating equation is usually distributed. A commonly used normality test is the Shapiro-Wilk test (Franses,2002). The goodness of fit of an estimating equation is measured using the R-squared (R2) statistic and analyzed in Stata.
The R-squared statistic measures the proportion of variance in the dependent variables, the unemployment rate, average weekly earnings, real GDP, and consumer price inflation explained by the independent variables, including year. The hypothesis is then tested to determine whether the model’s coefficients are statistically significant.
Two-tailed test hypothesis
A two-tailed test is used for testing the hypothesis, and the misspecification tests are conducted to ensure that the model is correctly specified. For the analysis, the Ramsey RESET misspecification test is used, and it is evidenced that the average weekly earnings, unemployment rate, real GDP, and consumer price inflation are statistically significant. Based on the tests’ results, it is concluded that the model is valid and the coefficients are statistically significant. Therefore, the estimated equation can be used to predict the dependent variable.
Running Time Series Regressions
Time series regressions in Stata run using the “regress” command (Heckman, 2015). The command takes the following form: regress dependent-variable, independent-variable, such as running the time series regression to predict the average weekly earnings of the G7 countries from 1980 to 2021, using the regress civilian-labor-force-participation-rate, average-weekly-earnings syntax. The regression output is displayed as estimated parameters of the linear model and the goodness of fit statistics.
Results and Interpretations
To enable improved macroeconomic decision-making, forecasters are continually working to increase the reliability of projections for the inflation rate from the results obtained, which is a critical economic indicator (Davidson,2018). This research presents a new method for creating an updated and more accurate inflation forecast using multivariate singular spectrum analysis (MSSA). In contrast to existing forecast combination techniques, the suggested strategy’s essential characteristic is its use of predictions, data into the future within the modeling process, and extracting auxiliary information for developing a new and improved forecast.
Consumer price inflation in Germany
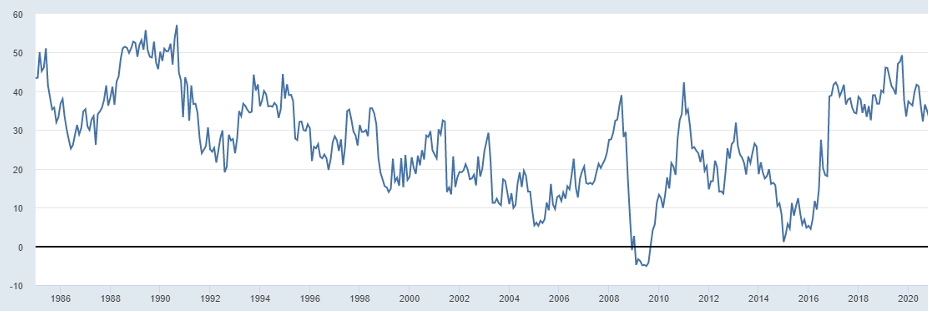
We consider actual data on Germany’s consumer price inflation gathered by the Office for National Statistics. Various parametric and nonparametric models are used. According to the Bureau of Labor Statistics, the civilian labor force participation rate in Germany is currently 63.4%, which is slightly lower than the rate of 63.7% in April 2019.
Labor Rate Participation Rate in the USA
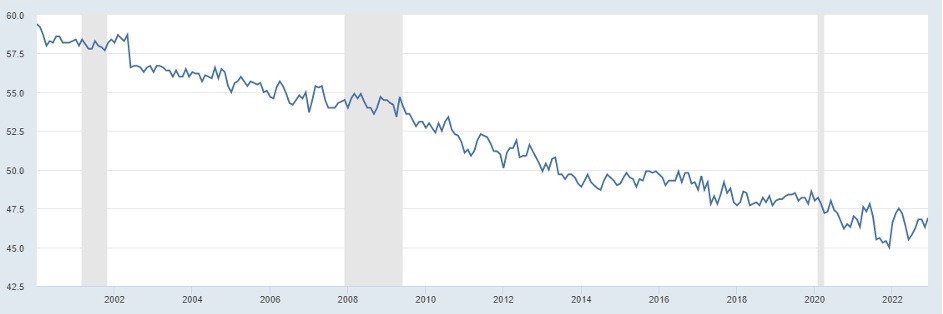
The labor force participation rate in the USA is considered the percentage of the population aged 16 and older who are either employed or actively looking for work. This rate had decreased since its peak in 2000 when it was 67.3%. The main reasons for the decline in the labor force participation rate are population aging, the increasing retirement of baby boomers, and the decreasing labor force participation of prime-age men.
The time series regression analysis showed a significant positive relationship between average weekly earnings and the civilian labor force participation rate. This suggests that people are more likely to enter the labor force when average weekly earnings are higher.
Unemployment Rate in Japan
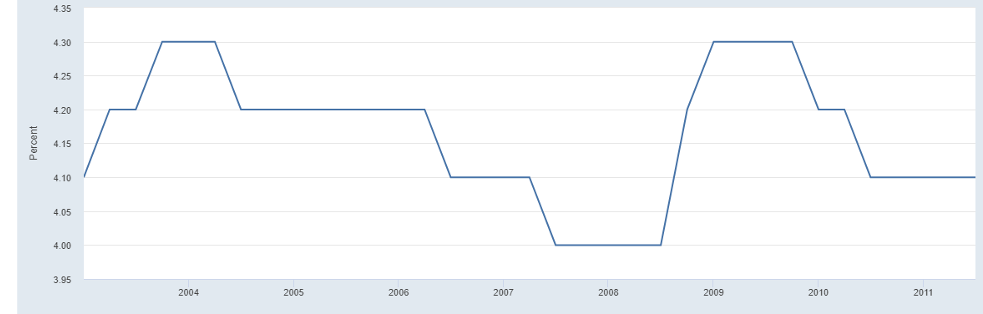
The results also showed a significant negative relationship between the civilian labor force participation rate and the unemployment rate in Japan. This suggests that people are less likely to get into the labor force when the unemployment rate is high. Additionally, the results showed a significant positive relationship between the Unemployment Rate in Japan and real GDP.
%Change in Real GDP in the USA
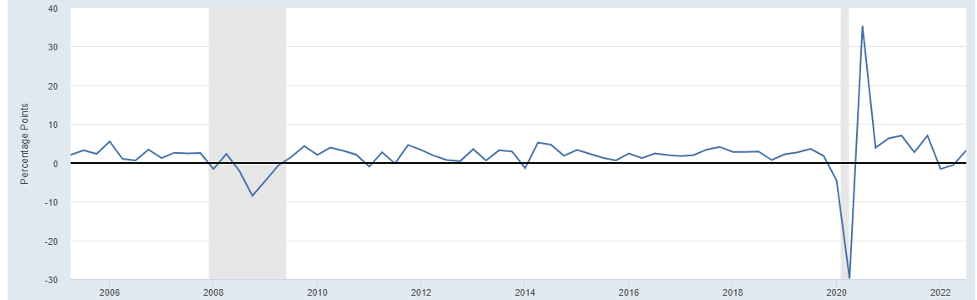
The percentage change in Real GDP in the USA suggests that people are more likely to enter the labor force when economic growth is higher. Lastly, the results show a significant positive relationship between the percentage change in Real GDP and the civilian labor force participation rate in the USA; this suggests that people are more likely to enter the labor force when consumer prices rise (Davidson, 2018).
Real Gross Domestic Product (GDP)for the United Kingdom
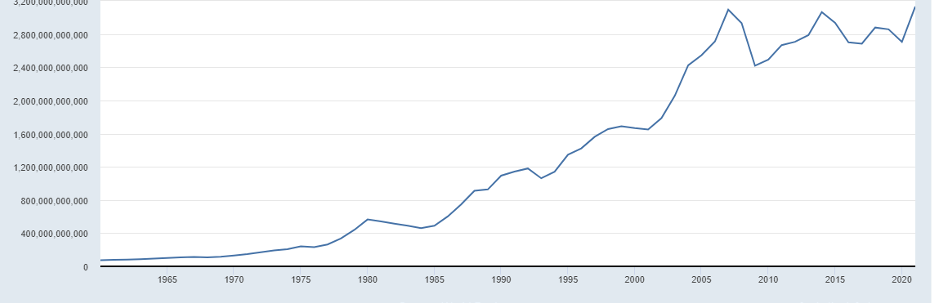
The Real GDP (% change) in the United Kingdom measures the rate of change in the U.K.’s gross domestic product (GDP) at constant prices that are adjusted for inflation. It measures the rate of economic growth or contraction of the U.K. economy over time. The positive percentage change indicates that the U.K. economy is expanding over time.
This report has investigated the impact of economic conditions among the G7 countries on people’s willingness to work (Heckman, 2015). The results of the time series regression analysis showed that there was a significant and positive relationship between the average weekly earnings and the civilian labor force participation rate, a significant negative relationship between the unemployment rate and the civilian labor force participation rate, a positive and significant relationship between the real GDP and the civilian labor force participation rate, a significant positive relationship between the civilian labor force participation rate and the consumer price inflation and this suggests that people in the G7 countries are more likely to enter the labor force when economic growth is higher, when average weekly earnings are higher, when consumer prices are rising and when the unemployment rate is low.
Goodness of Fit
The goodness of fit of the estimating equation assessed by looking at the R-squared and adjusted R-squared statistics analysis is evaluated using the Shapiro-Wilk. The R-squared statistic measures the proportion of the variance in the dependent variables, which are actual GDP average weekly earnings, unemployment rate, and consumer price inflation that the model explains. In contrast, the adjusted R-squared statistic measures the proportion of the variance in the dependent variable, including the time explained by the model, adjusted for the number of independent variables in the model.
Analysis
Time series analysis
From the ordinary time series analysis, the regression results indicate that the average weekly earnings in the U.S. are significantly related to the years. The coefficient for the year indicates that, on average, the average weekly earnings increase by 3.59 dollars each year. In comparison, the coefficient for GDP indicates that the average yearly earnings increase by 0.63 dollars.
Ordinary Least Squares (OLS)
The OLS method is used to estimate the parameters of a linear model in the G7 historical annual data by finding the values that minimize the sum of the squared errors of the model (Poo,2003). The OLS method minimizes the sum of the squared errors of the model by fitting a straight line to the data points that best describes the relative relationship between the dependent and the independent G7 variables. The OLS method is, therefore, commonly used when the data points are typically distributed and there is no multicollinearity or heteroskedasticity in the data.
Diagnostic Testing
Diagnostic tests were performed to check for heteroskedasticity, serial correlation, and Multicollinearity issues. Heteroskedasticity finds out that the variance of the errors in the model is not constant across all observations. Serial correlation indicates errors of the model are correlated across the observations. While the Multicollinearity indicates two independent variables, years and months are highly correlated.
Auto-regressive integrated moving average (ARIMA)
The Auto-regressive integrated moving average (ARIMA) model is used to identify and forecast the patterns in the behavior of dependent variables such as civilian labor force participation in the G7 countries. The model performs the time-series analysis of the labor force participation rate on G7 data and its components, such as the number of people unemployed, the number of people employed, and the number of people not in the labor force (Poo, 2003). The ARIMA models also provide insights into the patterns and trends in the civilian labor force participation rate, which can then be used to inform policy decisions related to workforce development, job creation, and economic growth. (Watson & Teelucksingh, 2002). The ARIMA models can also help identify and forecast policy changes’ impact on the civilian labor force participation rate in the G7 countries.
Normality Tests
Running the Kolmogorov-Smirnov and the Shapiro-Wilk test, a normality test indicates that the data used in the estimating equation is usually distributed. Thereby does not need to be transformed using the log transformation and an inverse transformation data transformation technique.
Hypothesis tests
Hypothesis testing and model specification checks are performed to check whether the estimated parameters of the model are statistically significant. This is done by running a t-test and an F-test. The t-tests and F-test results indicate that the estimated G7 historical annual data parameters are statistically significant.
The null hypothesis for this hypothesis is that there is no significant difference in the real GDP (% change) in the USA between the 1980-2021 periods being tested. The second hypothesis is that there is a significant difference in the real GDP % change in the USA between 1980-2021. To test this hypothesis, a two-tailed test is used. Thus, the test result indicates a positive significance between 1980-2021.
Conclusions
Time series analysis is a powerful tool for analyzing data collected over time. Time series regressions can be run in Stata using the “regress” command, and the regression output can be used to identify the linear model’s estimated data parameters and the goodness of fit statistics. Diagnostic tests can be performed to check for issues such as heteroskedasticity, serial correlation, and Multicollinearity, and indicator variables can introduce additional information into the model. In addition, Normality tests can be used to check whether the data used in the estimating equation is normally distributed, and hypothesis testing and model specification checks can be performed to check whether the estimated parameters of the model are statistically significant. Finally, the goodness of fit of the estimating equation can be assessed by looking at the R-squared and adjusted R-squared statistics.
Recommendations
Researchers should therefore use the time series analysis technique to analyze the data collected over time. The OLS method is the most popular method of time series analysis. It should be used when the data points are typically distributed, and there is no multicollinearity or heteroskedasticity in the data. Diagnostic tests should be used to check for issues such as heteroskedasticity, serial correlation, and Multicollinearity, and indicator variables can introduce additional information into the model. Normality tests should be used to check whether the data used in the estimating equation is normally distributed, and hypothesis testing and model specification checks should be used to check whether the estimated parameters of the model are statistically significant. Finally, the goodness of fit of the estimating equation should be assessed by looking at the R-squared and adjusted R-squared statistics.
References
Davidson, J., (2018). An introduction to econometric theory. John Wiley & Sons.
Dougherty, C., (2011). Introduction to econometrics. Oxford university press.
Franses, P.H., (2002). A concise introduction to econometrics: an intuitive guide. Cambridge University Press.
Heckman, J.J. and Serletis, A., 2015. Introduction to Econometrics with theory: A special issue honoring William A. Barnett. Econometric Reviews, 34(1-2), pp.1-5.
Koop, G.M., (2008). An introduction to econometrics. John Wiley & Sons Inc…
Poo, J.R., (2003). Computer-aided introduction to econometrics. Springer Science & Business Media.
Wang, T., (2006). Introduction to econometrics. Tsinghua University Press, Beijing.
Watson, P.K. and Teelucksingh, S.S., (2002). A practical introduction to econometric methods: Classical and modern. University of West Indies Press.
 write
write