1. Introduction
H&M is a global clothing retailer with over 5,000 locations in over 70 countries. The firm was founded more than 70 years ago. The brand sells a variety of Footwear in addition to other apparel and accessories. In many states across the US, however, H&M is losing money on the sale of Footwear. To solve this problem, H&M has implemented business analytics to understand its sales data better and act accordingly.
With business analytics, businesses may gather, process, and analyze data to understand their operations and consumers better. H&M can figure out why their shoe sales are losing money using business analytics by creating a detailed data management and analytics strategy. With this strategy, H&M can visualize their sales data and act wisely depending on the insights they gain.
Businesses that employ business analytics have been found to have greater success than their competitors regarding revenue, productivity, and market value. McKinsey & Company concluded in 2011 that businesses utilizing big data and analytics increased productivity by 5–6% and operating margin by 2–4%. Davenport and Harris (2007) conducted another study, finding that analytics-using businesses outperformed their competitors financially.
This report explains in detail how H&M can leverage the Excel dashboard that will allow the Company to better understand and act upon its sales data. H&M will be able to see trends, patterns, and improvement opportunities in their sales data in real-time thanks to the dashboard. Business analytics provide H&M with the information they need to take preventative measures against continuing to lose money on the sale of Footwear.
2. Theoretical Framework
Businesses in many sectors have benefited from business analytics to guide decision-making and boost efficiency. Poor sales of H&M’s footwear products across the United States have led to negative earnings for the Company in numerous locations. The organization can utilize business analytics to examine sales data, look for trends and patterns, and make informed decisions about how to proceed.
Business analytics, according to studies, can boost productivity and profitability. Omar et al. (2019) found that businesses that invest in analytics are likelier to make decisions based on hard numbers, boosting profits. Cohen (2018) research shows that analytics can also improve pricing tactics, leading to higher profits.
Business analytics has been effectively implemented to increase revenue and client happiness in the retail sector. An analysis of consumer data by analytics can, for instance, reveal openings to boost customer loyalty and retention, as was discovered in a study by Anshari et al. (2019). Gallego-García et al. (2021) found that analytics can be utilized to improve stock management and cut down on stockoutsstockouts. The research implies that H&M can benefit from employing business analytics to fix its declining earnings in the US. H&M may enhance its financial performance, pricing tactics, and customer pleasure by studying its sales data and discovering patterns and trends.
2.1. Business analytics in the Clothing Industry
Today, business analytics is integral to every sector, including the apparel market. Data science is described as the use of statistical and computational tools to analyze and interpret data to guide business choices. Over the past few years, the market for ready-made clothing has exploded. Customers are savvier and have higher expectations due to the rise of e-commerce and social media. To maintain their market share, clothing manufacturers now must invest in business analytics. A company’s marketing, product development, and supply chain management decisions can all benefit from the insights gleaned through analytics tools by observing and analyzing patterns, trends, and consumer behavior.
Inventory management is a major advantage of business analytics in the clothing line industry. With predictive analytics, businesses may reduce waste and cut expenses by always keeping the correct amount of inventory on hand (Valamede and Akkari., 2020, p. 851). They can monitor stock levels, pinpoint sluggish sellers, and fine-tune their product offerings. The marketing field is another crucial one where business analytics can be applied. Customer data, such as purchases, browsing habits, and demographics, can be analyzed with analytics software to reveal patterns and insights. Marketing efforts, product suggestions, and the quality of the customer experience can all benefit from this data.
The supply chain in the textile industry is another potential area of improvement with the help of business analytics. Companies may optimize their supply chain using data analysis by looking at metrics like supplier performance, shipment delays, and inventory levels (Brintrup et al., 2020, p. 3330-3341). The importance of business analytics in the textile sector cannot be overstated. It can aid businesses in optimizing their supply chains, managing their inventories, and promoting sales. Analytics technologies enable businesses to adapt to an ever-evolving industry and meet customers’ growing demand for individualized service.
3. Data Analyses
3.1. Dashboard
Source: Excel dashboard created by me
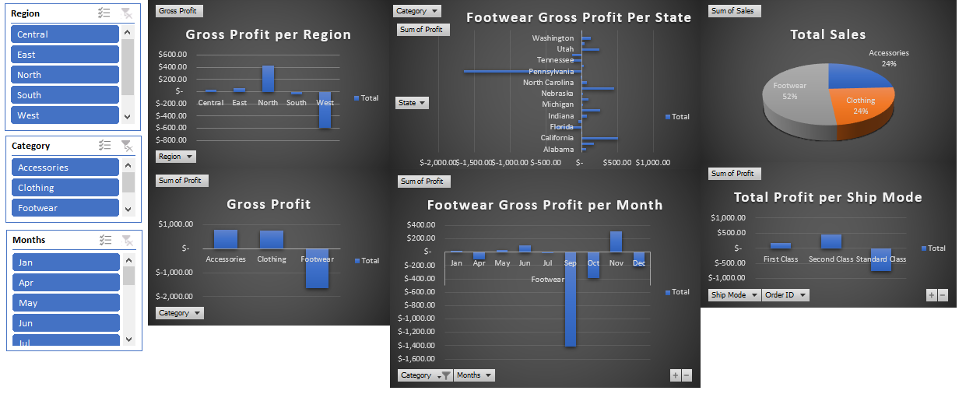
The H&M Business would benefit greatly from having a dashboard built in Excel. The dashboard needs several measures that can shed light on the organization’s sales success. The gross profit per category is an indicator because it reveals which product types are the most lucrative. This will inform H&M’s inventory management and advertising activities, allowing them to put their resources where they will provide the greatest return.
Monthly sales data is another key indicator to examine. H&M can better predict future success by analyzing monthly sales data for trends and making strategic adjustments. This can aid the business in maintaining a leading position in the market. It is also important to keep tabs on sales statistics related to specific regions and states. H&M can use this information to see where they excel and where they need to make changes. H&M may better allocate resources by city by evaluating sales data to determine which areas are most profitable. This helps the business better tailor its operations to the requirements of its clientele.
In addition, by keeping tabs on total sales by category, H&M can see which product lines are most profitable. The organization can use this information to decide better which items to push and where to concentrate their sales and marketing efforts. Total sales by region can also be tracked to see which markets are most profitable. As a result, H&M can better manage resources and zero in on revenue generators. H&M will be able to see the big picture of their sales performance by putting this information into a graphical format in Excel. The firm will then be able to make well-informed decisions that will help it run more efficiently. H&M Company’s success and continued dominance in the industry depend on the data and insights provided by an Excel dashboard.
4. Justification of the Dashboard
Source: Excel dashboard created by me
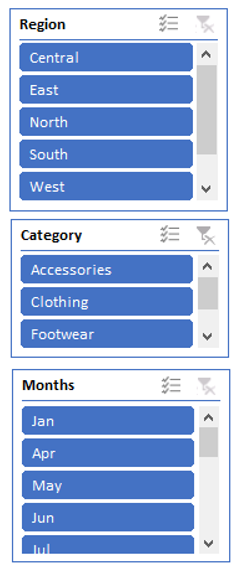
When it comes to filtering and analyzing data, slicers are crucial components of any dashboard. Data-driven decisions are critical to the success of any organization, and slicers let users quickly spot patterns, trends, and outliers. The slicers are useful because they allow users to interact with the data, making the interface more inviting and facilitating in-depth study and analysis.
Particularly useful in the context of an H&M dashboard are the Category Slicer, Sub-Category Slicer, Region Slicer, and Sales Slicer. For instance, the Category Slicer enables the user to filter data based on the category of products; this is critical for assessing how well various product categories are doing. In contrast, the Sub-Category Slicer may help you make informed decisions regarding product development and marketing by dissecting the performance of certain product categories.
The ability to slice data according to the location from which an order was placed is provided by the Region Slicer. By looking at sales data from different regions, consumers may see where advertising dollars are most effectively being spent. Users can, for instance, see which goods are doing well in other regions and promote those in the underperforming region if sales are slow there. The Sales Slicer is helpful for inspecting the breadth of sales figures. Users can sort products’ sales data according to how well or poorly they are doing. For effective inventory management and strategic marketing, this data is indispensable.
Bar Chart
Source: Excel dashboard created by me
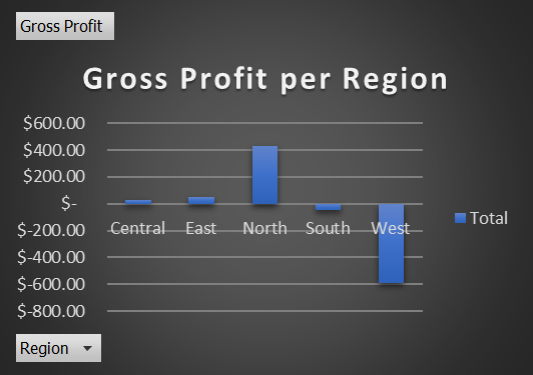
According to the research, regional differences in gross profit margins are substantial. The North region brought in $433.34, the largest gross profit of any area, or around 63.6% of the total. With a gross profit of $52.31 (or 7.7% of the whole), the East likewise did well. Nonetheless, the West area lost the most money (-$588.02), accounting for 86.1 percent of the overall gross loss. The Central region brought in $26.88 (3.9%) of the total, while the South brought in -$49.02 (7.2%) of the total in gross profits.
These findings point to considerable regional differences in the Company’s performance, suggesting that more research is required to determine the causes of these differences. More marketing and inventory optimization, as well as the introduction of new products, are just a few suggestions for how the corporation could boost revenues in areas where they are now lower. Further research may be needed to determine what’s causing the losses in the West and South in order to design effective countermeasures.
The data reveals vast discrepancies in gross profit margins between H&M’s various global markets. The North area posted the highest gross profit, indicating that there may be unique factors at play there that lead to greater profitability. However, the West region posted a sizable loss, suggesting there may be systemic difficulties that must be addressed before profitability can be restored in this area.
These results suggest that H&M should conduct a deeper investigation into the causes of regional differences in gross profit margins. To do so, it may be necessary to analyze things like shoppers’ habits, rival businesses’ tactics, advertising plans, and stock management procedures. The corporation may also decide to pursue methods to boost profitability in regions with lower gross margins, such as enhancing marketing, introducing new products, or enhancing inventory management. Additionally, the corporation should perform a more in-depth investigation and adopt suitable interventions to address the fundamental issues contributing to the losses in the West and South regions. Together, the corporation may utilize these findings to inform data-driven decisions that boost profits and streamline operations worldwide.
Gross Profit per Category
Source: Excel dashboard created by me
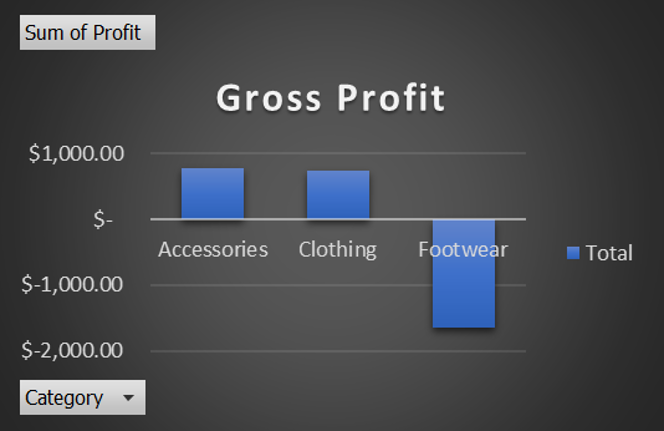
Profit of $785.67 in the Accessories column and $741.17 in the Clothes column would be the most profitable. A loss of $1,651.35 is reflected in the Footwear column. The fact that Footwear has a negative profit indicates that the Company is not doing well with this product line and may need to implement initiatives to enhance profitability, such as better inventory management, cheaper production, or an expansion of the product line. The growth in profitability for the Accessory and Clothes departments show that these product lines are successful and should receive continued attention. Yet it could be useful to dig deeper to find out what’s causing the disparity in profits between the two groups so that we can maximize performance with targeted interventions.
Gross Profit Per State
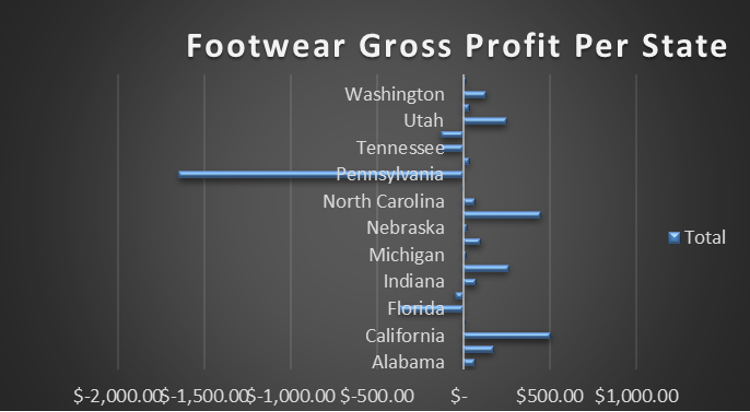
Source: Excel dashboard created by me
State-by-state profit figures in the United States are shown here. Profits in other areas, such as California ($506.57), New York ($449.5), Kentucky ($261.5), and Utah ($250.25), are significantly higher than the national average. Losses of -1,648.96 in Pennsylvania, -132.82 in Texas, and -370.95 in Florida have been reported, though. Many factors, including market demand, competition, and operating costs, can affect a company’s profitability. As a result, more research may be needed to determine what causes are really behind the differences in state-by-state profits so that effective interventions might be designed to boost performance.
Total Sales per Category
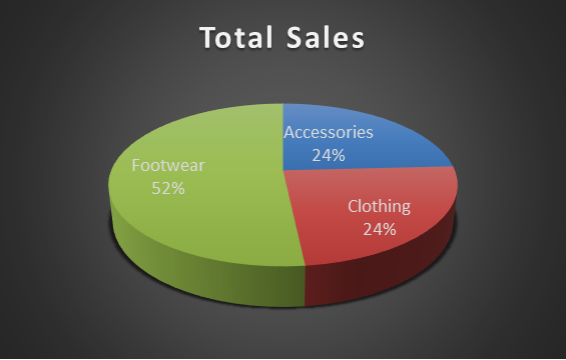
Source: Excel dashboard created by me
The sum of revenue generated by various types of merchandise is shown in this chart. Sales of $5,186.76 came from the Accessories section, or about 22.5 percent of overall revenue. The Apparel subcategory did very well as well, contributing $5,169.37 to total sales (or 22.4%). With a total of $11,083.78 in sales, the footwear category contributed over half of the total revenue.
According to the data, Footwear appears to be the best-selling product category, but both accessories and clothing are doing well. H&M could benefit from diversifying into these sectors and using their popularity to boost sales of similar items. The high sales in the Footwear category may warrant additional investigation into the factors that contribute to these results and the potential for further growth. Overall, these findings can guide H&M’s marketing and stock decisions to boost sales and bottom line performance.
Gross Profit by Category, Monthly
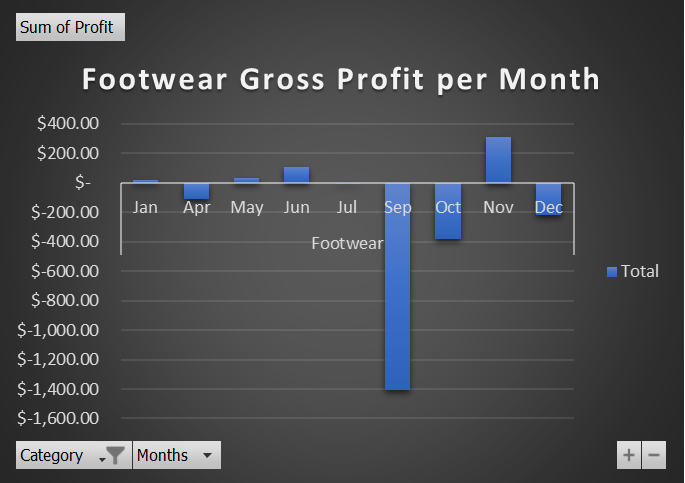
Source: Excel dashboard created by me
There is just data for the Footwear category in the January bar, which shows a profit of $16.54. The Footwear department lost $108.35 in April. In May, Footwear recorded a modest profit of $33.22. The footwear industry made more money in June, totaling $106.58. The Footwear category experienced a small loss of $0.01 in July. The Footwear business lost a huge $1,409.26 in September. Footwear also experienced a loss in October, totaling $-383.03. Yet in November, Footwear saw a profit of $309.90. In the end, Footwear lost $215.91 in December.
These findings suggest that Footwear’s profitability shifts dramatically from one month to the next. H&M could benefit from looking into the causes of these differences, which could include seasonal patterns or shifts in customer demand. The business may also try discounting products or running sales during slow months in order to boost profits.
5. Recommendations
H&M’s current predicament in the US footwear market calls for the implementation of business analytics via an Excel dashboard. Sales patterns, trends, and optimization possibilities can all be better understood with the use of business analytics, which has been shown to boost productivity and profitability. With an Excel dashboard, H&M can see their sales data in real time, enabling them to make decisions that will help them avoid more losses.
Using a business analytics dashboard built into Excel can help H&M increase profits, fine-tune prices, and boost happy customers. H&M can make better, more data-driven decisions that will help the business run more efficiently and keep it at the top of its field.
6. Conclusion
H&M can benefit immensely from implementing business analytics by using an Excel dashboard to better analyze their sales data and make educated decisions. H&M is able to increase financial performance and customer pleasure by evaluating data on a monthly basis to spot trends and patterns and then adjusting strategy accordingly. The dashboard’s slicers make it simple to filter and interact with the data, opening the door to further investigation and comprehension. H&M’s capacity to succeed in the highly competitive retail market will depend on their use of data and analytics, and the Excel dashboard will be a key component in this process. H&M can give themselves a leg up on the competition and set themselves up for future success by investing in business analytics.
7. References
Omar, Yamila M., Meysam Minoufekr, and Peter Plapper. “Business analytics in manufacturing: Current trends, challenges and pathway to market leadership.” Operations Research Perspectives 6 (2019): 100127.
Cohen, M.C., 2018. Big data and service operations. Production and Operations Management, 27(9), pp.1709-1723.
Anshari, M., Almunawar, M.N., Lim, S.A. and Al-Mudimigh, A., 2019. Customer relationship management and big data enabled: Personalization & customization of services. Applied Computing and Informatics, 15(2), pp.94-101.
Gallego-García, D., Gallego-García, S. and García-García, M., 2021. An optimized system to reduce procurement risks and stockoutsstockouts: a simulation case study for a component manufacturer. Applied Sciences, 11(21), p.10374.
Brintrup, A., Pak, J., Ratiney, D., Pearce, T., Wichmann, P., Woodall, P. and McFarlane, D., 2020. Supply chain data analytics for predicting supplier disruptions: a case study in complex asset manufacturing. International Journal of Production Research, 58(11), pp.3330-3341.
Valamede, L.S. and Akkari, A.C.S., 2020. Lean 4.0: A new holistic approach for the integration of lean manufacturing tools and digital technologies. International Journal of Mathematical, Engineering and Management Sciences, 5(5), p.851.
 write
write