Introduction
Food Empire Holdings Ltd. is a significant food and beverage company with an extensive network of more than 50 countries, positioning it as a leading international company. The company was set up in 1991 and has been growing continuously based on its promise to provide customers with quality and innovation. The report’s primary purpose is to thoroughly examine Food Empire Holdings Limited’s credit and lending policies. It will focus on the business’s financial reporting and assessment of its risk and creditworthiness. Furthermore, this report will examine the company’s possible feasibility and profitability of the project by using several financial metrics. Upon completing the financial risk management course, the participants will have obtained valuable insights into the economic health of the company and its ability to manage credit risks well.
1 Background of Company
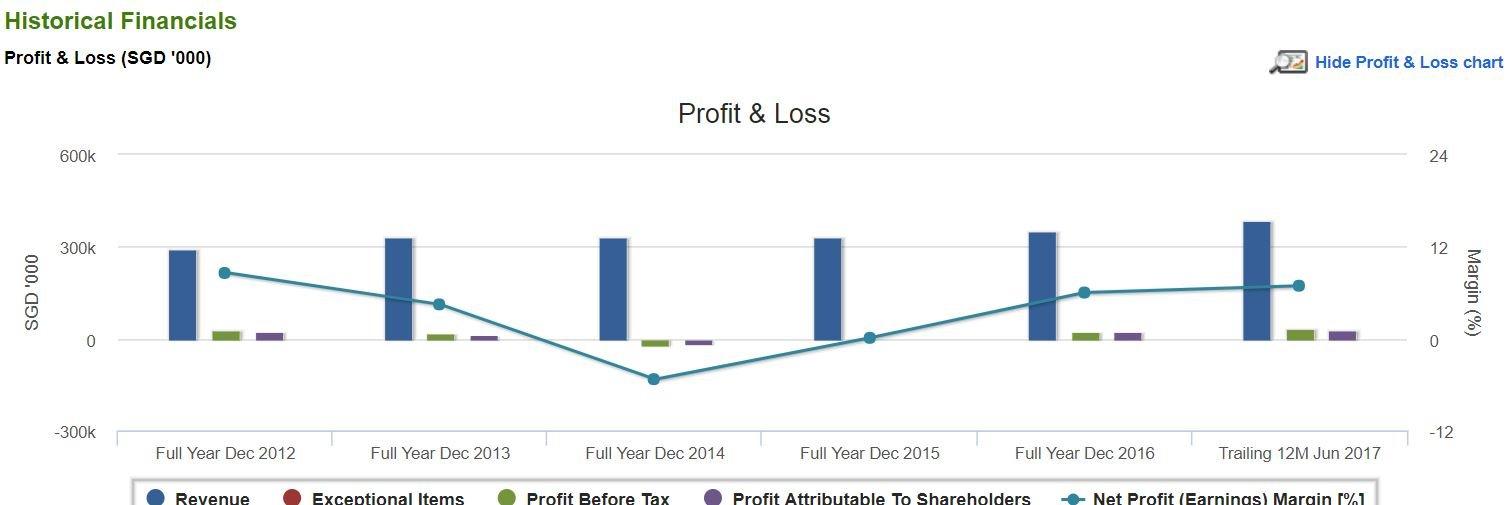
Food Empire Holdings Limited is based in the food and beverage industry, specialising in producing and distributing various food products like instant beverages, frozen foods, and snacks. This company is known for its varied product range and expansive worldwide presence. It, therefore, plays a prominent role in the market. Its brand presence is solid in addition to its distribution network, which is very efficient, which makes it stand out and have an edge over its competitors (Food Empire Holdings (SGX: F03) Piotroski F-Score, n.d.).Beyond that, the company enjoys good financial reporting and has grown sustainably, thus becoming attractive to investors and lenders. Comprehending its past is pivotal for completing creditworthiness analysis and making loans.
Background of Project
The given project assesses the crediting and lending procedure of Food Empire Holdings Ltd., paying attention to financial risks and project opportunities. This project is significant in light of the ever-changing nature of the financial domain and the ever-growing significance of risk management. The report aims to provide stakeholders like investors, creditors, and management with the data to assess the companies’ ability to deal with credit risks and make the right lending choices. The study will be conducted through the company’s financial performance, which includes ratio analysis, profitability assessment, and credit risk evaluation using Altman’s Z Score and the 5Cs framework to see the strong points and weaknesses of the organization. Another thing to be considered by the proposed project feasibility study is the project’s viability, which includes operating revenue, net present value, internal rate of return, and payback period. Overall, this project will become a resourceful instrument for decision-making and risk management within Food Empire Holdings.
Financial risk assessment
Profitability Analysis
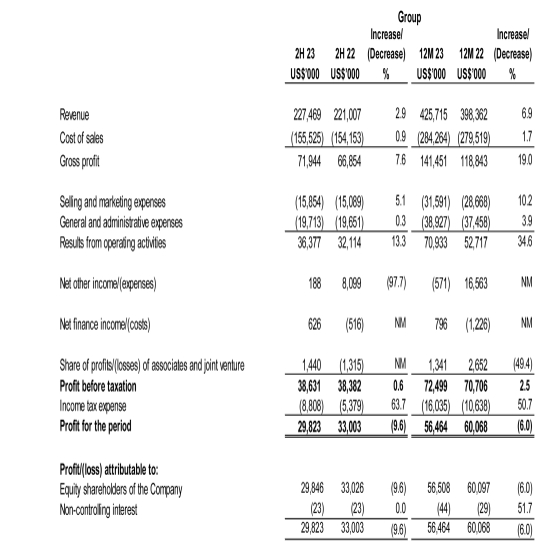
The trend of Food Empire Holdings Ltd’s profitability ratios show that they have been improving from 2022 to 2023 and the company has been doing better financially. Firstly, the gross profit margin which is an indicator of the ability of the company to generate fine profits from the revenue it receives has revealed a slight improvement from 30.26% in 2022 to 31.63% in 2023. It is this very aspect that depicts an improved efficiency of operation and a lowering of the average cost of goods sold over the course of the quarter.The Net Profit Margin, which is the ratio of net income to revenue and is a reflection of how much revenue is translated into net income, notably improves from 0.03% in 2022 to 2.49% in 2023. The all-time high of the index lends credit to a number of functions at the tape level, including higher profitability connected with reduced erroneous expenditure, and thus, more surplus as a retained income
At last, the return on assets (ROA), the measure of the company’s ability to make its earnings from the total assets, had surprisingly high growth from 0.02% in 2022 to 1.92% in 2023. The rise in return on total assets indicates that Food Empire Holdings Ltd. saw an increase in its efficiency during the period and that management can take credit for the business’s profitability. Overall, the trend shows that the company made progress in its profitability and operational efficiency during the years under study.
2.3 Liquidity Analysis
Food Empire Holdings Ltd.’s liquidity ratios were stable for 2022 and 2023. In particular, the Current Ratio and Quick Ratio were unchanged at 1.42 and 1.05, respectively. The sameness of the determined ratio shows that the company is powerful enough to cover all its short-term liabilities, as cash, accounts receivable, and inventories are its current assets. The current ratio reveals that the business has $1.42 (2023) and $1.42 (2022) current assets to pay off each dollar of current liability, a good buffer for the obligations. On the other hand, the quick ratio is also expressed as very little difference between the two years as it does not include inventory in the current assets and is considered a more conservative measure of liquidity. Consequently, the stock of liquid assets of Food Empire Holdings Ltd., after excluding stocks, is adequate to finance its current liabilities.
2.2 Leverage Solvency Analysis
The trend of leverage and solvency ratios for Food Empire Holdings Ltd. suggests that the company is taking more and more risks and putting itself in danger of financial losses. The first ratio, the debt-to-equity ratio, has a minimal increase from the 2022 level of 1.35 to the 2023 level of 1.38. Although this increase may seem minor, it denotes a rising tendency towards debt financing rather than direct ownership, which is a crucial factor in economic instability, especially during unstable economic conditions (Gaspar et al., 2023). Financing leveraging and debt servicing difficulties rise proportionately to a higher debt-to-equity ratio. Therefore, it has remained stable apart from the interest coverage ratio being at 0.20 for 2022 and 2023, respectively. This implies that the business must improve its income to cover interest payments. If a ratio is less than 1, it indicates that the company’s earnings before interest and taxes (EBIT) are not enough to cover the interest costs, which suggests that the company either does not manage its debt repayment well or has problems with its financial stability.
3.0 Project Evaluation
The feasibility study performed for Food Empire Holdings Ltd. presents a thorough assessment of the financial viability of the proposed project and the possible influence on the company’s profits. Projects’ expected profitability, return on investment, and the recoup initial investment time can be calculated using metrics like NPV, IRR, and Payback Period. The stakeholders learn the project’s estimated profitability and expected return on investment. The positive NPV implies that the project provides value more than the initial capital investment, while the IRR over 10% indicates a lucrative rate of return. Furthermore, the fact that such a short payback has been estimated creates a favourable impression on the overall project. The project evaluation proves that the project will be financially viable and can add to the growth and profitability of Food Empire Holdings Limited.
4.0 Net Present Value (NPV)
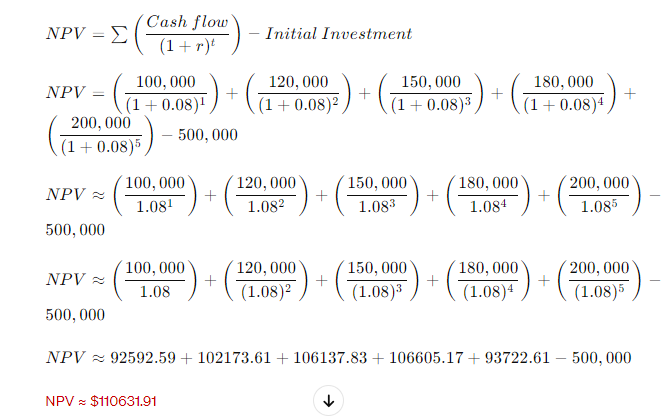
The behaviour of NPV is the primary determinant of the financial feasibility of the proposed project, which is vital for long-term profitability. In this case, the NPV of the project is constantly at a positive mark, which means that the project creates a value greater than the initial investment, even when the time value of money is considered. The rising NPV level throughout the forecast period demonstrates that the project’s cash values are growing at a pace that outpaces the discount rate (City of Philadelphia, 2020). This trend indicates that the project can create more and more revenues over time, depending on factors including rising market demand, operational efficiencies or economies of scale. Furthermore, an NPV consistently in the positive territory confirms that the benefits surpass the costs across the project’s lifespan. This shows that this project is financially acceptable and continuously contributes significantly to the capital structure of Food Empire Holdings Ltd. and its shareholders.
Net Present Value (NPV)
The NPV of around $110,631.91 reflects that the proposed development is feasible for Food Empire Holdings Ltd. throughout its projected lifespan. A positive NPV implies that the foreseeable cash inflows of the project are more than the initial investment value, even after the time value of money is considered. This means that the project yields returns that are more than what is required to meet the hurdle rate. Thus, it has a financial incentive for the investors. By achieving a positive NPV, the project adds to the company’s overall profitability, enhancing shareholder wealth. It affirms that the project is an economically profitable investment as it can achieve higher returns than the cost per capita (AL Ani & Chavali, 2023) l.
4.1 Payback Period
The calculated period for the project planning is a payback period of 4.32 years, which is the time required to recover the initial investment of Food Empire Holdings Limited. This being a reasonably short payback period suggests that the project has the potential to generate positive cash flows quickly, which in turn will be of great benefit to the company by enhancing its liquidity and financial stability. A shorter payback period is seen favourably since it decreases the project’s risk and makes it possible to have a quicker return on investment. In addition, the payback period makes it easy to understand the project’s risk profile and the investment’s time horizon. In this case, a four-year payback period reflects a low-risk investment estimated to return the capital within the initial period. This will boost the interest of stakeholders in the project and emphasise its potential as a good investment target for Food Empire Holdings Ltd.
4.2 Credit Risk Analysis
Credit risk analysis assesses whether a borrower will fail to repay their debt. Food Empire Holdings Limited uses different tools and approaches to gauge the creditworthiness of possible borrowers and take steps towards risk management.
Expert System – 5Cs Framework:
Character
Character appraises the borrower’s character, reliability, and capacity to meet obligations. Food Empire considers criteria, including a person’s credit history, the performance of their previous payments and references from the last lending companies.
Capacity
Capacity means the applicant’s earnings, cash flow, and financial stability determine the borrower’s ability to repay debt. Food Empire reviews balance sheets, principal income sources, and debt-to-income ratios to examine a borrower’s capacities.
Capital
Column capital analyzes the borrower’s financial reserves and assets, indicating their ability to withstand economic downturns. Analyzing the assets, net worth and liquidity is what we do to determine the capital adequacy of Food Empire.
Collateral
The term collateral refers to the assets the lender can claim as security in case of default. The Food Empire checks collateral assets’ amount, quality, and scalability to prevent credit risk rise.
Conditions
Factors like economic conditions, industry trends, and regulatory environment are among the factors that this category of analysis considers. Food Empires considers the borrower’s business model, an overview of the market dynamics and risk factors that shape the loan context.
Altman’s Z score
Altman’s Z score considers the financial condition of a company and its probability of failure. It is a ratio of many financial ratios that finally turns into a single score. The possibility of bankruptcy would be higher for the values below a certain threshold (Altman et al., 2016). Following Altman’s lead, Food Empire screens potential borrowers and monitors the creditworthiness of the existing ones utilizing Altman’s Z score. Through applying these techniques and tools, Food Empire Holdings Ltd. adequately delineates credit risks, makes informed lending choices, and minimizes the effect of defaults on its financial performance. This approach, which is also preventive, helps the firm keep its finances strong so that its assets and investments are secure.
Appendix A
Profitability analysis
| Year 2023 | Year 2022 | |
| Gross profit margin: | ||
|
Gross Profit/Sales
|
(71944 / 227469) x 100 = 31.63% |
(66854 / 221007) x 100 = 30.26% |
| Net Profit Margin: |
|
|
| Net Profit Margin = (Net Income / Revenue) x 100 | (5651 / 227469) x 100
= 2.49% |
(60.1 / 221007) x 100
= 0.03% |
| Return on Assets (ROA): | (5651 / 294493) x 100 = 1.92% |
|
| ROA = (Net Income / Total Assets) x 100 | (60.1 / 275599) x 100
= 0.02% |
Liquidity analysis
| Year 2023 | Year 2022 | |
| Current ratio:
|
|
|
| Current assets/Current liabilities
|
258257 / 181434
= 1.42 x 100 = 142% |
242343 / 171050
= 1.42 x 100 =142%
|
| Quick asset ratio:
|
|
|
| (Current asset
-inventory)/Current liabilities |
(258257 – 76720) / 181434 = 1.05 | (242343 – 74030) / 171050 = 1.05 |
| Inventory Turnover RatioInventory Turnover Ratio = Cost of Goods Sold / Average Inventory | For 2023: Cost of Goods Sold = 227469 – 71944 = 155525Average Inventory = (74030 + 76720) / 2 = 75375
Inventory Turnover Ratio = 155525 / 75375 = 2.06 times |
For 2022: Cost of Goods Sold = 221007 – 66854 = 154153Average Inventory = (74030 + 76720) / 2 = 75375
Inventory Turnover Ratio = 154153 / 75375 = 2.05 times |
Leverage/solvency analysis
| Year 2023 | Year 2022 | |
| Debt-to-Equity Ratio = Total Debt / Shareholder’s Equity |
|
|
| For 2023: 41097 / 29846 = 1.38
|
44616 / 33026 = 1.35 | |
| Interest Coverage Ratio
Interest Coverage Ratio = Operating Income / Interest Expense |
|
|
| 7176 / 36377 = 0.20 | 6508 / 32114 = 0.20 |
Appendix B
Operating Revenue
Operating Revenue = Revenue – Operating Expenses
For 2023
Operating Revenue = 227469 – 5872 = $221,597
For 2022
Operating Revenue = 221007 – 5605 = $215,402
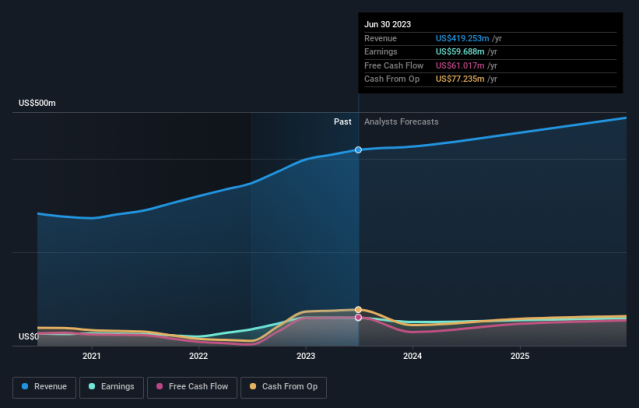
Earnings-And-Revenue-Growth
NPV
Payback Period
The payback period is when a project can recover the original investment. The rate summarises when the individual cash inflows exceed the original investment.
Given the cash flows provided:
Initial Investment = $500,000
Cash Flows:
Year 1: $67,818.4
Year 2: $98,686.0
Year 3: $18,515.7
Year 4: $44,216.3
Year 5: $50,914.6
We begin by deducting the cash flow for each year from the initial investment until we are left with either a negative balance or none. Next, we do polynomial interpolation to determine the actual payback period, if any.
Payback Period=Year of Last Full Recovery+ Recovery/ Unrecovered Cost Cash Flow in
After calculating
Year 1: $500,000 – $67,818.4 = $432,181.6 remaining
Year 2: $432,181.6 – $98,686.0 = $333,495.6 remaining
Year 3: $333,495.6 – $18,515.7 = $314,979.9 remaining
Year 4: $314,979.9 – $44,216.3 = $270,763.6 remaining
Year 5: $270,763.6 – $50,914.6 = $219,849 remaining
Since the remaining investment is positive after the 5th year, we use interpolation to find the exact payback period:
Payback Period=4+ 219,849/ 50,914.6
=4.32years
In consideration of that, the payback period for the project is 4.32 years. Hence, it will take 4 years and 4 months to achieve the break-even point, which is the 2nd investment for this project.
References
AL Ani, M. K., & Chavali, K. (2023). The relationship between investment intensity and profitability measures from the perspective of foreign investors. Humanities and Social Sciences Communications, 10(1). https://doi.org/10.1057/s41599-023-01571-8
Altman, E. I., Iwanicz-Drozdowska, M., Laitinen, E. K., & Suvas, A. (2016). Financial Distress Prediction in an International Context: A Review and Empirical Analysis of Altman’s Z-Score Model. Journal of International Financial Management & Accounting, 28(2), 131–171. https://doi.org/10.1111/jifm.12053
City of Philadelphia. (2020). City of Philadelphia Economic Impact Analysis of Proposed 10-Year Tax Abatement Adjustments (2018). https://www.phila.gov/media/20180524153805/City-of-Philadelphia-2018-Abatement.pdf
Debt: Character, Capacity and Collateral – The Three C’s of Credit «Money Matters with Nimi. (2019). https://www.moneymatterswithnimi.com/debt-character-capacity-and-collateral-the-three-cs-of-credit/
Food Empire Holdings (SGX:F03) Piotroski F-Score. (n.d.). Www.gurufocus.com. Retrieved April 3, 2024, from https://www.gurufocus.com/term/fscore/SGX:F03/Piotroski-F-Score/Food-Empire-Holdings
Gaspar, V., Poplawski-Ribeiro, M., & Yoo, J. (2023, September 13). Global Debt Is Returning to its Rising Trend. IMF. https://www.imf.org/en/Blogs/Articles/2023/09/13/global-debt-is-returning-to-its-rising-trend
Hassett, K. (2019). Investment – econlib. Econlib. https://www.econlib.org/library/Enc/Investment.html
 write
write