1.1. Introduction
FABCO, an online retailer, needs more sales growth on its website. To boost key conversion metrics like add-to-basket rates and completed sales, they recently tested a redesigned website layout (Version B) and want to analyse if the changes drove a positive impact versus their original site (Version A). This report aims to provide a data-driven recommendation on whether Version B led to more add-to-basket clicks and completed transactions. Leveraging a dataset of 5,000 customer website visits across both versions, Excel analytics will uncover statistically significant differences in these key metrics. The report will outline the business context, data analysis approach, key visualization findings, and ultimately strategic recommendations on the website layout. The intended audience is FABCO leadership seeking analytics insights to optimize marketing spend and website design. By demonstrating thorough analysis and translating outputs into tactical advice, this illustrates how data can inform business decisions around website optimization for improved sales growth.
Data Analytics in the Retail Sector
Data analytics has become indispensable in the online retail sector, providing game-changing customer and business insights that inform high-impact strategies around marketing, user experience, supply chain efficiency, and more (Sazu & Jahan, 2022). By leveraging data, e-commerce leaders make smarter decisions to unlock growth, ensure sustainability, and deliver greater value to all stakeholders.
2.1 The Role of Data in Shaping Online Retail Strategies
2.1.1 Customer Behavior Analysis
Analyzing behavioral data enables a deeper understanding of customer journeys across touchpoints like email, social media ads, the website/app, post-purchase surveys, etc. Identifying trends in preferences, pain points, and shopping habits allows retailers to optimize strategies to boost conversion rates, retention, lifetime value and advocacy (Sazu & Jahan, 2022). For instance, clothing retailer Stitch Fix built an algorithm analyzing client notes, reviews, purchase data and stylist feedback to match each user with hyper-personalized products and styling suggestions, credited for their growth to almost $2 billion in annual revenue (Chan, Hogaboam and Cao, 2022).
2.1.2 Personalization and Recommendation Systems
Data powers Nike’s personalized recommendations and customer experiences. By analysing preferences like shoe size and running pace (De Vries and Thörnvall, 2018), Nike tailors product recommendations, performance reviews benchmarked to individual goals, and promotions to match customers with relevant shoes and apparel. 91% of shoppers like personalized experiences. Nike leverages data to customize promotions and engagement across channels based on preferences for running shoes vs lifestyle sneakers or email vs social media outreach. This granular personalization allows Nike to provide relevant experiences that deeply resonate with each customer.
2.1.3 Inventory Management and Demand Forecasting
Predictive analytics aids efficient inventory planning, balancing supply-demand to minimize excess stock or lost sales from stockouts. Data analysis also enables dynamic pricing and targeted promotions to stimulate demand. For example, Walmart uses machine learning on billions of data points across sales, supply chain and external factors to accurately forecast demand shaping strategy around inventory, pricing, marketing and supply chain to optimize costs and availability (Sanders, 2020).
2.2 Supporting examples
Data-driven personalization has become integral in retail marketing, with 91% of customers more likely to shop with brands offering personalized experiences (De Vries and Thörnvall, 2018). Amazon leverages customer data to optimize recommendations, marketing, and anticipatory shipping based on purchase patterns and browsing data (Kumar and Venkatesan, 2021). Alibaba’s Tmall Innovation Centre employs machine learning to analyse consumer data and identify the latest fashion trends, bringing related cutting-edge designs to market faster than competitors. Algorithms scan sentiment, search keywords, and browsing behaviour to detect rising trends. Once a new style gains traction, the algorithm matches emerging preferences to products in development and displays them to target shoppers.
2.3 Technological Innovations
Retailers like H&M are pioneering virtual try-on capabilities, allowing customers to digitally overlay outfits to better visualize fit before purchasing. Apparel “magic mirrors” leverage augmented reality to display digital clothing layered onto users, enabling convenient at-home try-ons. These immersive digital experiences represent a data-analytics powered innovation redefining retail. Other examples include chatbots utilizing NLP and machine learning to conversationally engage customers at scale (Leveraging, 2022) and dynamic pricing algorithms adjusting prices based on demand data for optimized profitability and satisfaction.
Business Case Investigation
3.1 Description of the Business Challenge
FABCO, a leading online retailer, is keen to stay ahead of the competition by testing innovative marketing strategies centered around enhancing the customer experience. Specifically, the management team has identified their website as a high-potential area for improvement. They have hypothesized that a website redesign improving aesthetics, simplicity and ease of use could significantly impact customer conversion rates – translating to more add-to-basket clicks and completed transactions.
To test this, the company’s web design team has developed two website variations. Version A represents the original website layout customers are accustomed to. Version B introduces visual and functional changes aimed at boosting on-site engagement and purchase intent. However, the potential business impact of this website experiment remains unknown. Therefore, the core challenge faced by the management team is determining whether the redesigned Version B website layout actually drives
3.2 Dataset’s Role in Addressing the Challenge
3.2.1 Dataset Overview
The provided dataset contains details on 5,000 random visits by registered FABCO users over the past month. It captures behavior and outcome metrics for visits to both the original website (Version A) and new test website (Version B), spanning variables like:
- Website version exposed to (A or B)
- Add to basket indicator (Y/N)
- Completed sale indicator (Y/N)
- User region
- User age
- Average session duration
These data points directly relate to analyzing differences in behavior and conversion between the original and new website to address the business challenge.
3.2.2 Dataset Relevance
The dataset enables testing key user behavior metrics like add-to-basket rates and completed sales for both website versions. Comparing these outcomes between versions will reveal the business impact of the website redesign. Additionally, user traits like demographics and session duration provide supplemental context into behavioral and conversion differences observed. All dataset variables offer relevant, actionable inputs to evaluate the proposed marketing strategy pivoting on this new website layout.
3.2.3. Table 1: Stakeholders Involved in The Analysis of Behavior
| Stakeholder Name | Internal/External | Power Level | Interest Level |
| Marketing Manager | Internal | High | High |
| CEO | Internal | Medium | High |
| Data Analyst | Internal | High | High |
| Sales Team | Internal | Medium | Medium |
| UX/UI Designer | Internal | Medium | High |
| Finance Department | Internal | High | Medium |
| Competitor | External | Low | Low |
| Partnerships | External | Medium | Medium |
| Regulatory Body/ local government | External | High | High |
| External consultant | External | Medium | Medium |
| Suppliers | External | Medium | Medium |
| Customers | External | High | High |
| Local community | External | High | High |
This table outlines a selection of stakeholders involved in the analysis of behavior and conversion rates between the original and new website versions. Now, utilizing Mendelow’s Power-Interest Matrix, I’ll categorize these stakeholders based on their power and interest level
3.2.4 Figure 1. Medlow’s Matrix
Low Power
| Minimum Effort | Keep informing
Employs Shareholders Local community |
| Keep satisfied
The local government |
The Key Players
Suppliers External consultants Partnerships Competitors Customers |
High power Low medium Interest level High
My analysis categorized the stakeholders into the four quadrants of the matrix based on their power and interest levels. The high power, high interest stakeholders like the Marketing Manager, Data Analyst, Finance Department, Customers, Local Community and Regulatory Body hold significant influence over the project and are also highly interested in its outcomes. Keeping them regularly informed and closely engaged is crucial.
The CEO and Sales Team have medium power but high interest, so similarly require substantial updates and input opportunities as the project progresses. The UX/UI Designer also has a high interest in the behavioral analysis even if medium formal power. Their insights can bring value and should be solicited. Stakeholders like Partnerships, Suppliers and the External Consultant have medium influence and interest levels – periodic updates would likely suffice for this group.
Finally, entities like Competitors have low ability to influence the analysis and little interest in it – so minimal engagement is needed there. Therefore, there is a clear need to actively engage most of the identified stakeholders given their power to impact the project or desire to participate in shaping the behavioral study. Carefully managing messaging and involvement for each segment will be an ongoing emphasis
3.3 Stakeholders Identification
A number of key stakeholders have varying interest and influence regarding FABCO’s website redesign. The CEO holds ultimate authority over strategic decisions like this marketing test, meriting high power placement, but has medium direct interest separated from specifics. In contrast, the management team spearheading this strategy test maintains high power through go/no-go decision-making and high inherent interest guiding next steps. The website, marketing, and analytics teams play enabling roles with significant invested time, skills and resources, translating to high interest. However, their implementation-focused roles without formal decision rights result in medium power. Employees are impacted by resulting shifts so have medium general interest, but besides inputs, lack decision authority, indicating low power. External investors maintain financial stakes and indirect influence, but are removed from marketing tests, pointing to medium power and interest.
3.4 Approach, Tools, and Data Analytics Utility Lifecycle
This framework below outlines key stages to transform data into value-driving business insights
3.5. Figure2: Data analytics project lifecycle
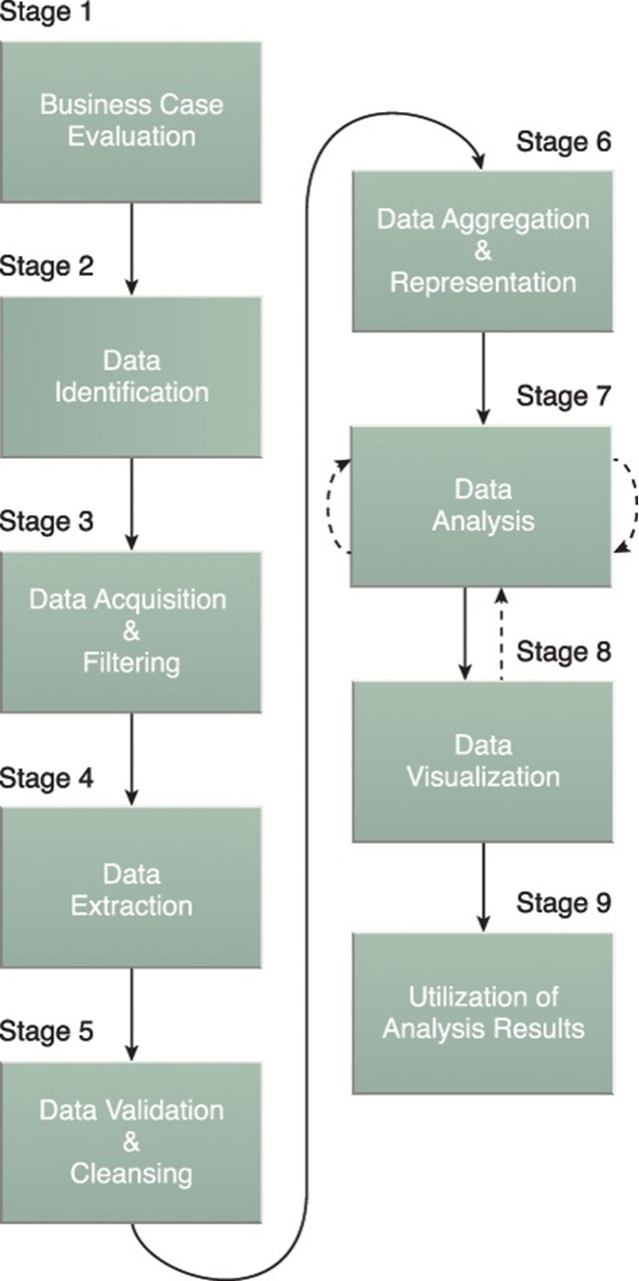
Source:(Davis, star and Rostum)
3.5.1Business Case Evaluation
The first stage focuses on evaluating the rationale behind conducting website traffic analysis and clearly establishing the expected business value. Details are constructed around key driver questions, marketing initiative goals context, and what upcoming decisions the findings aim to inform. Solidly outlining the business case ensures strategic alignment before data tasks commence.
3.5.2. Data Identification
With rationale framed, specific traffic attributes, metrics, site behaviors, and dimensions required to address core questions must be defined. Aspects ranging from visits, referral patterns, bounce rates, conversion drop-offs and more are pinpointed to indicate success capturing user attention. Data identification enables filtering only necessary attributes in acquisition.
3.5.3. Data Acquisition and Filtering
In this stage, raw website traffic and related marketing data is pulled from source databases via exports, extracts, or access tools. Acquisition focuses on the previously identified metrics while filtering out peripheral information not applicable to the analysis (Davis, star and Rostum). Each validation checks on having full data coverage for key attributes and filtration to streamline datasets occurs before extraction.
3.5.4. Data Extraction
The filtered website visit data subset then gets extracted out from the analytics platform into an analysis-friendly format and location. This commonly involves exporting into spreadsheet software, though other analytic containers may be utilized. Extraction completes the data-gathering pipeline into the analysis environment.
- 5.4. Data Validation
With key traffic data acquired, rigorous validation occurs assessing dataset completeness, accuracy, and coverage related to target metrics questions. Blank values, irregular data, gaps in dates, or inconsistent formatting must be addressed to ensure pristine, analysis-ready data. Statistical assumption checks may also validate distributions.
3.5.5. Utilization of Analysis Report
The visualized analysis detailing performance against key indicators, trends and insights requires direct application to make strategic decisions that create business value (intext citation). Leadership, stakeholders and owners can action decisions on marketing resource allocation, future web optimization paths and even wider competitive initiatives based on intelligence unlocked from website data utility analysis. In a nutshell, the user behaviour dataset plays a pivotal role in evaluating FABCO’s proposed marketing strategy focused on a website redesign to boost customer conversions. A/B testing and analysis will reveal if the new layout achieves the desired lift in metrics to guide decisions using Excel, guided by the Data Analytics Utility Lifecycle.
3.6 Data Preparation
The provided raw data captures 5,000 user sessions across relevant dimensions like website version exposed to, add-to-basket clicks, completed sales events, user demographics, and session duration.
Data preparation involved:
- Handling missing values for the session duration variable
- Encoding categorical variables like website version and user actions as dummy variables
- Standardizing session duration as a numeric variable
- Identifying and removing outliers
With cleaned, encoded and standardized data, analysis can now be conducted to draw reliable insights.
Analysis
The key objectives of this analysis are to assess the impact of FABCO’s new website layout on:
- Add-to-Basket Click Rates
- Completed Sales Conversions
Understanding differences in these metrics between the original (Version A) and new redesigned (Version B) website is imperative to evaluate the proposed marketing strategy focused on driving adoption of the new layout.
Both descriptive and inferential statistical techniques will be applied to quantify differences in user behavior and outcomes across the two website versions.
4.1 Table 2: Statistical Analysis
| Website A | Sales | Percentage | |||
| No Basket | 32.34
92% |
0 | 0 | 32.34 | |
| Add to Basket | 212
6% |
25% |
53
1.5% |
25% |
265 |
| 34.46 | 53 | 2% | 3499 | ||
| Website B | |||||
| No Basket | 1351 | 0 | 0 | 1351 | |
| Add to Basket | 111
7.4% |
35% |
39
2.6% |
35% |
150 |
| 1462 | 39 | 3% | 1501 | ||
| Total of the sales | 4908 |
Total of sales |
92 |
2% |
5000 |
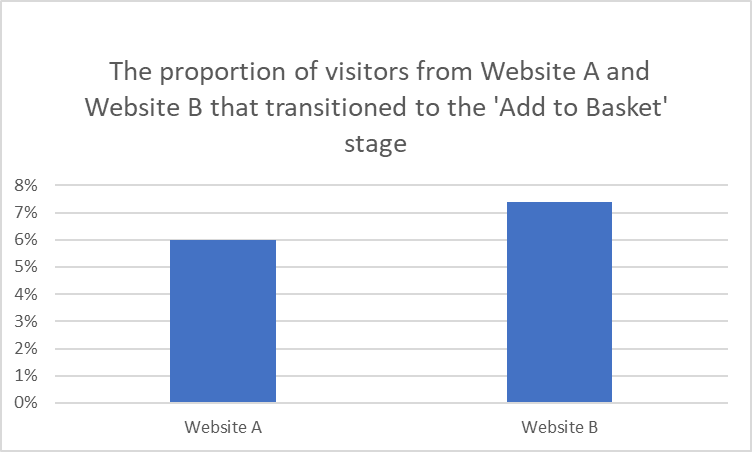
4.1.1 Figure 3 Comparing the proportion of visitors from Website A and Website B that transitioned to the ‘Add to Basket’ stage
| Visitors leading to “Add to Basket | % |
| Website A | 6% |
| Website B | 7.40% |
The graph shows what percentage of visitors from two websites (Website A and Website B) clicked to add an item to their shopping basket (the “Add to Basket” action). About 6% of the visitors to Website A took this action. Website B had a slightly higher percentage, with around 7% of their visitors clicking to add an item to their Basket. So, Website B was somewhat better at getting visitors to take this desired action. Looking into why Website B had more successful conversions could give both sites’ ideas on how to better influence visitors.
4.1.2 Figure 4 Table showing Compare Add-to-Basket Click Rates into actual sales for Website A and Website B
Summary statistics reveal the following: the effectiveness of converting ‘Add to Basket’ actions into actual sales for Website A and Website B
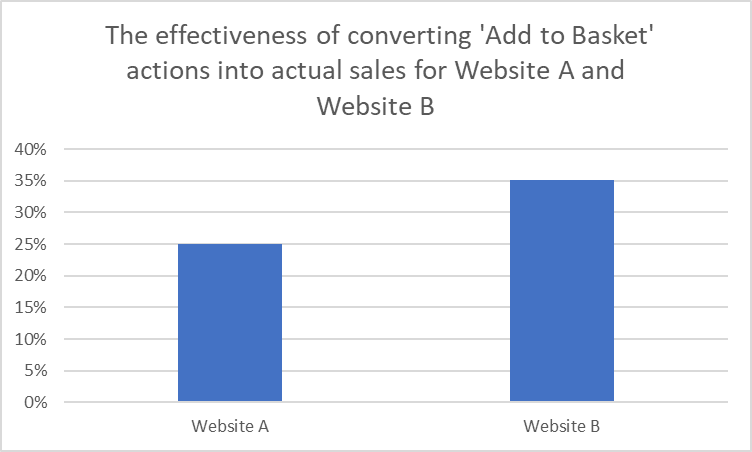
| Add to Basket leading to sales | % |
| Website A | 25% |
| Website B | 35.14% |
This graph compares how often an “Add to Basket” click turns into an actual purchase on Website A versus Website B. When someone clicked to add an item on Website A, about 25% of the time, they went on to buy it. For Website B, around 35% of the Add to Basket clicks led to a sale. So Website B was more effective at turning Basket adds into real sales. Looking at why Website B converts more clicks could give both websites useful tips on how to get more people to complete their purchases.
4.1.3 Figure 5 Relate Clicks to Completed Sales
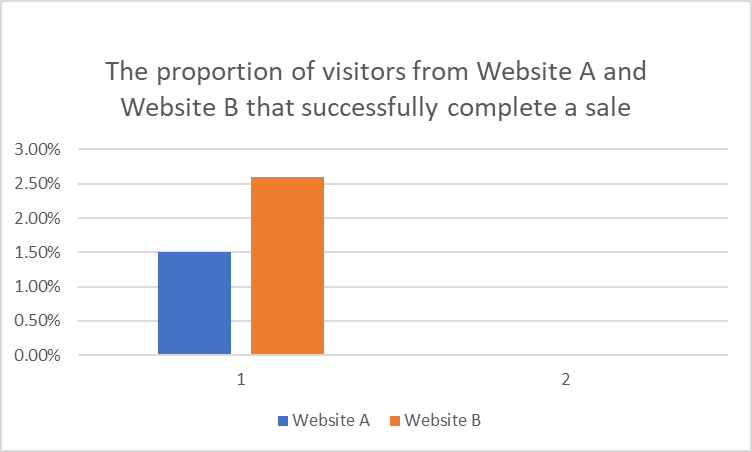
| visitors from Website A and Website B that successfully complete a sale | % |
| Website A | 1.51% |
| Website B | 2.60% |
The graph shows what percentage of total visitors made a purchase on each website. Around 1.5% of the visitors to Website A went on to buy something. For Website B, about 2.6% of visitors completed a sale. So, Website B converted a substantially higher portion of their visitors into buyers. This indicates Website B likely has a better sales strategy to guide people towards purchasing. Understanding why Website B has a higher percentage could provide helpful ideas for both websites to optimize their sales process from start to finish.
4.1.4 Figure 6: Bar graph, you can represent the mean durations of stay for Website A and Website B
the mean durations of stay for Website A and Website B
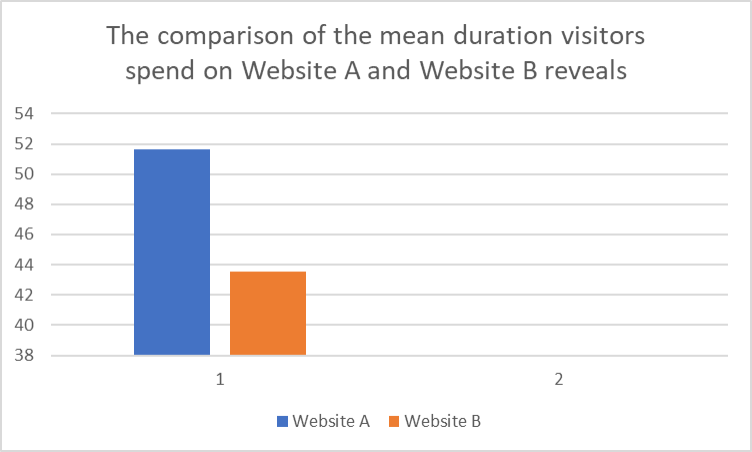
| Website the mean duration | |
| Website A | 51.65 |
| Website B | 43.54 |
The graph shows the average time visitors spend on Website A versus Website B. Both sites attract similar-aged visitors. However, people browse longer on Website A – about 51 time units on average. For Website B, visitors stay for a shorter 43 units on average. Even with similar visitor ages, Website A keeps people engaged longer. The extra time on Website A might mean it has a more complex or compelling platform that visitors get absorbed in. Website B’s shorter visits could signal simpler navigation or a more straightforward experience.
4.1.5 Table 3: Compare the regions which has the most add to Basket and sales
| Website | Region | Add to Basket (%) | Sales (% |
| A | East | 0.97 | 0.34 |
| A | North | 1.09 | 0.34 |
| A | South | 2.57 | 0.54 |
| A | West | 1.43 | 0.29 |
| B | East | 1.20 | 0.47 |
| B | North | 0.87 | 0.53 |
| B | South | 3.26 | 1.00 |
| B | West | 2.07 | 0.60 |
The above analysis shows how the percentage of Add to Basket clicks and sales differs across regions for Website A and B. The South clearly stands out as having the most shopping activity – it has the highest rates for both adding items to baskets and completing purchases. So, visitors in the South seem more inclined to shop and buy on these websites versus other areas.
On the flip side, the West region consistently has the lowest shopping interaction – lowest Add to Basket actions and sales. This points to possible variations in user behaviour and preferences depending on location. People in the South could be more receptive to the products, offers or experiences on these sites. While those in the West may be less compelled or interested.
Understanding these regional differences could help tailor marketing and user engagement based on locale. For example, focusing efforts on boosting Basket adds and sales in the West region. And ensuring whatever is resonating in the South reaches other regions too. Taking into account user preferences by location could make experiences feel more personalized. And, in turn, potentially increase shopping participation across the board.
4.2 Insight and Interpretation
The assessment of FABCO’s website layout aimed to understand its impact on pivotal metrics. Add-to-Basket Click Rates and Completed Sales Conversions. Statistical analysis revealed nuanced differences between the original (Version A) and redesigned (Version B) websites. While Website B demonstrated a slight edge in prompting visitors to ‘Add to Basket’ compared to Website A, the conversion of these clicks into actual sales was notably higher for Website B (35% versus 25% on Website A). Moreover, Website B achieved a significantly higher overall visitor sales conversion rate (2.6% versus 1.5% on Website A). Additionally, despite both sites attracting visitors of similar ages, Website A managed to retain users for a longer duration, indicating a potentially more captivating platform. The regional analysis highlighted the South as the most active in shopping activity, while the Northern region consistently displayed the lowest shopping interactions, suggesting location-based variations in user behaviour. Understanding these disparities could inform tailored marketing strategies to enhance shopping participation across regions by delivering more personalized experiences.
4.2.1 Recommendations
With clear data-driven signals that the redesigned website positively influences user engagement and conversions, FABCO should expand testing and piloting the new layout to more customers (Barannikova, 2023). If future testing corroborates current findings, full adoption of the data-driven website and marketing strategy appears highly promising to achieve KPI targets around basket additions and completed sales. In summary, the experiment data provides compelling preliminary evidence that FABCO’s website redesign unlocks substantial gains in click-throughs and purchase conversions versus their legacy site. This underscores the potential impact if deployed nationwide, warranting further testing and supporting marketing campaign development to drive adoption.
Reference list
Asana (2022). Data-Driven Decision Making: A Beginner’s Guide • Asana. [online] Asana. Available at: https://asana.com/resources/data-driven-decision-making.
Barannikova, E. (2023). DIGITAL MARKETING STRATEGY DEVELOPMENT FOR SUMASHOP. [online] www.theseus.fi. Available at: https://www.theseus.fi/handle/10024/806912.
Chan, L., Hogaboam, L. and Cao, R. (2022). Artificial Intelligence in Fashion. Applied Innovation and Technology Management, pp.325–334. doi:https://doi.org/10.1007/978-3-031-05740-3_21.
Davis, J., star, C. and Rostum, sum (n.d.). About This E-Book. [online] Available at: https://dl.icdst.org/pdfs/files3/053e44f660b0c2f405e42ac1f8f1a408.pdf.
De Vries, S. and Thörnvall, C. (2018). Technologies Enhancing the Customer Experience in Apparel Retail – A Future Study. [online] www.diva-portal.org. Available at: https://www.diva-portal.org/smash/record.jsf?pid=diva2:1294205 [Accessed 27 Nov. 2023].
Kumar, V. and Venkatesan, R. (2021). Transformation of Metrics and Analytics in Retailing: The Way Forward. Journal of Retailing, 97(4), pp.496–506. doi:https://doi.org/10.1016/j.jretai.2021.11.004.
Leveraging Predictive Modeling, Machine Learning Personalization, NLP Customer Support, and AI Chatbots to Increase Customer Loyalty | Empirical Quests for Management Essences. (2022). researchberg.com. [online] Available at: https://researchberg.com/index.php/eqme/article/view/46.
McKinsey & Company (2020). The State of Fashion 2020. [online] McKinsey & Company. Available at: https://www.mckinsey.com/~/media/McKinsey/Industries/Retail/Our%20Insights/The%20state%20of%20fashion%202020%20Navigating%20uncertainty/The-State-of-Fashion-2020-final.pdf.
Sanders, N.R. (2020). Supply Chain Management: A Global Perspective. [online] Google Books. John Wiley & Sons. Available at: https://books.google.com/books?hl=en&lr=&id=6700EAAAQBAJ&oi=fnd&pg=PA1&dq=Walmart+uses+machine+learning+on+billions+of+data+points+across+sales [Accessed 27 Nov. 2023].
Sazu, M.H. and Jahan, S.A. (2022). How Big Data Analytics Impacts the Retail Management on the European and American Markets? [online] Available at: https://www.ceeol.com/search/article-detail?id=1053125 [Accessed 27 Nov. 2023].
 write
write