This research investigates the educational achievement of middle school students in science disciplines. It will examine the impact of demographic factors, including race and gender, on their performance. We aim to identify at-risk students without compromising fair access to educational possibilities by adopting machine learning models such as decision trees and fairness-boasting decision trees. This evaluation is extremely important for focusing on students’ education with different backgrounds so they all have the opportunity.
Data Loading and Preprocessing
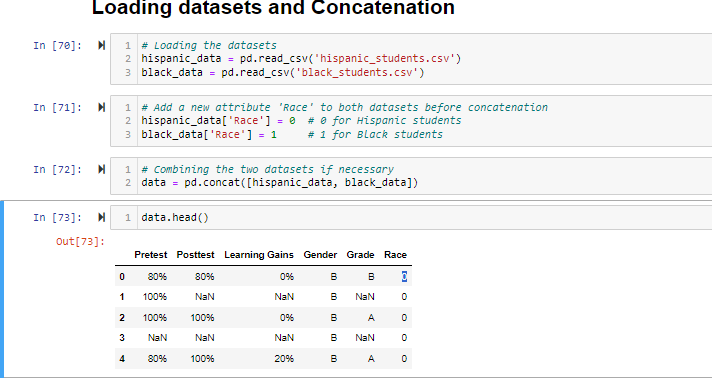
The loading of two datasets of the grades of Hispanic and Black students, corresponding to middle schools, followed the analysis, which started. Firstly, analyzed datasets consisted of information on individual pretest and posttest scores, learning gains, gender, and final grades. To ensure adequate and relevant analysis was conducted, we introduced a new feature that marked the students as either Black or Hispanic to classify their groups.
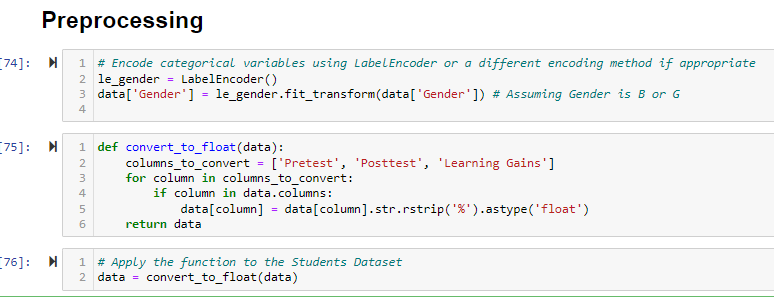
As the first phase of our analysis, we have been doing much preprocessing on the datasets before launching a comprehensive evaluation stage. First, we dealt with the percentage score presented in our report shown in the data format. As the next step in making these data consistent numerically for our subsequent analysis, let us convert the percentage scores to float values. It poured in understanding, which in turn makes the mathematical and statistical operation much easier to apply, ensuring the effectiveness during both the exploratory data analytic phase and the model training steps (Pagano et al., 2023).
Once that was done, we created the dataset and followed that up with the categorical variables, explicitly focusing on the ‘Gender’ variable. The LabelEncoder method, a standard method of transforming quantitative values into the numerical format, was used because numerical input was one of the requirements for machine learning models. The encoding process works by numbering each class separately, thus allowing the incorporation of categorized data into our predictive model.
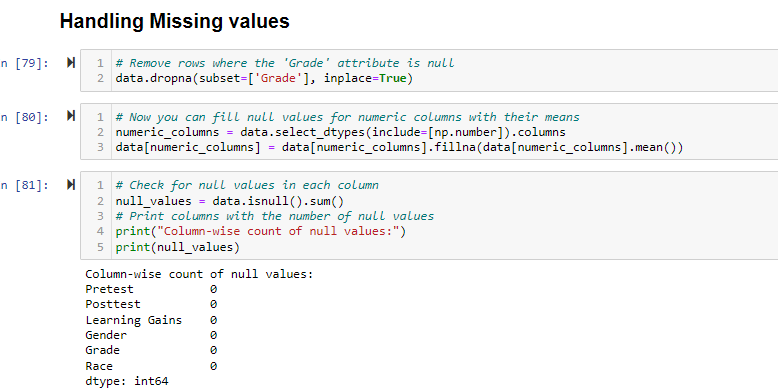
Last but not least, it is also crucial to ensure the integrity and completeness of our data (Fan et al., 2021). To ensure that our research findings are reliable, we thoroughly removed from our dataset any rows in which the ‘Grade’ field was empty; this field does not include the aiming value of the target for our predictive analytics. Additionally, we filled in the empty spaces in the numeric columns(other than where we used the mean) by using the mean values. With this method, we could keep gathering the maximum amount of information, enabling us to have a firmer statistical setup and put the dataset in a pure, ready state for the upcoming analysis and model-building process.
Data Visualization
Multiple visual displays were generated to compare Black and Hispanic students and those based on gender. The measures employed were the pretest scores, posttest scores, and learning gains. The patterns of educational accomplishments that were represented showed differentiation and led to what created the necessity for in-depth analysis.
Graphical Analysis
- Pretest and Posttest Distributions: Histograms were used to illustrate variations in pre-test and post-test scores that reflected on racial groups, depicting these groups learning disparities and gaps in academic performance.
- Learning Gains Distribution: Attainment graphs for the course create a visual image of the student’s level of knowledge over the course, showing how well the content delivered fits the gap in initial knowledge.
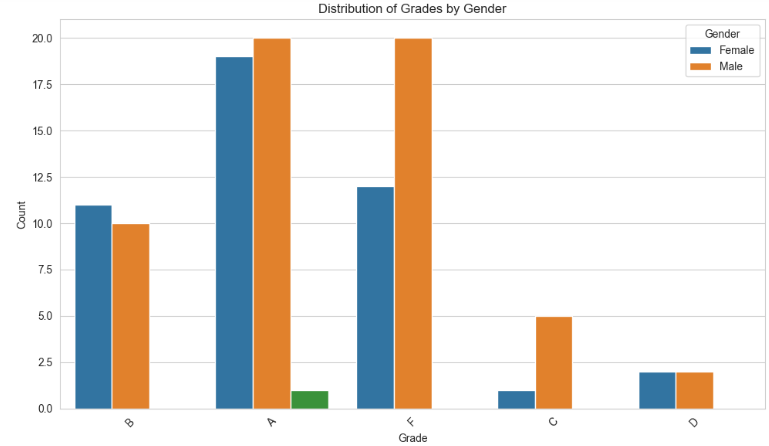
The graphs, as shown in the figure, illustrate the distribution of grades among the science students from middle school according to their racial and gender categories. This is illustrated in the “Grades Distribution by Race” graph at the higher number of “B” for the Latino group and “C” for the African-American group. A difference in grades between whites and blacks within this dataset suggests that the disparity exists.
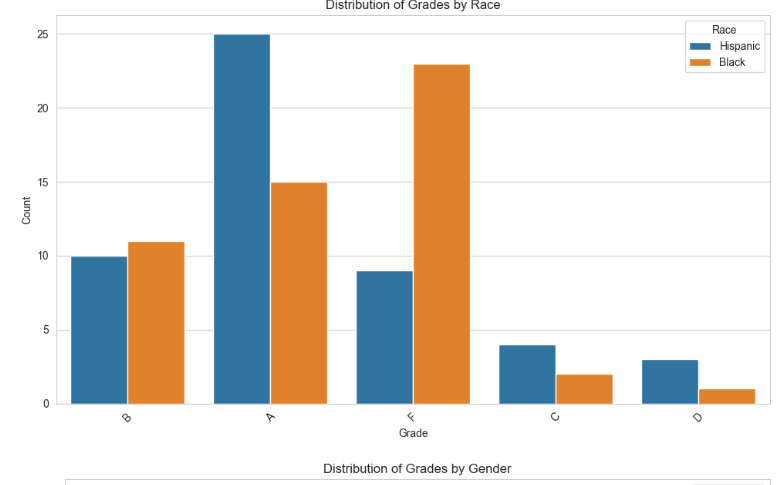
The “Distribution of Grades by Gender” chart shows that female students receive higher grades than male students. A higher percentage of the B grade and As for females are seen to be outstanding compared to males. Correspondingly, it becomes apparent that there is a significantly greater number of male students in the lower grade categories D and F, which indicates that there might be a gender difference in the achieved grades between the groups described in the text.
Correlation Analysis
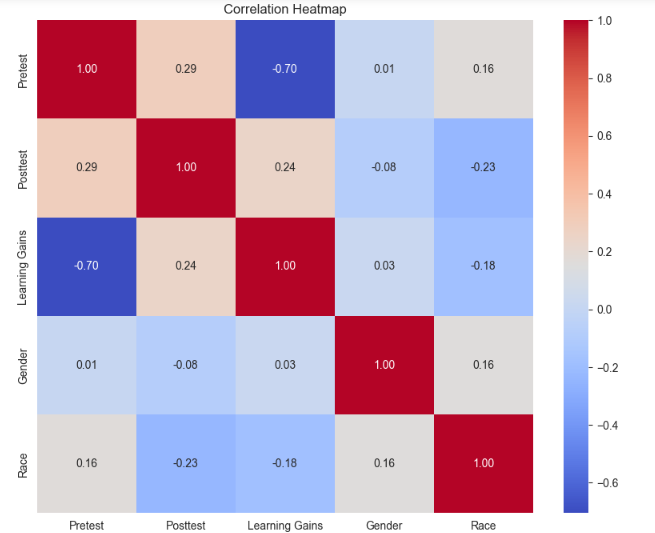
The correlation heatmap highlights the relationship between academic parameters like results and demographics (Fan et al., 2021). It features a negative correlation of -0.70 between post-test scores and learning gains, suggesting that students with lower initial performance levels may be more qualified for more substantial improvement. Nevertheless, in the Pre-test, the exact outcome is slightly different, with a correlation of 0.29. This implies that the original knowledge level is also a factor that aligns with the final results level. Also, Study Benefits found that the gain on study has a relationship of 0.24 with the Posttest scores, which is a sign that the gains obtained during the course are associated with the positive final results. Gender does not have a bulky correlation with academic scores, and hence, the somewhat lousy performance of the girl may be wrongly linked to their gender. While there is a marginally negative correlation of -0.23 between Race and Posttest results, the opposite is the case for Pretest scores since a modest positive correlation of 0.16 exists between the two, implying the existence of the underlying variables that affect performance negatively at the beginning of the session, and play the opposite role at the end.
Model Development and Methodology
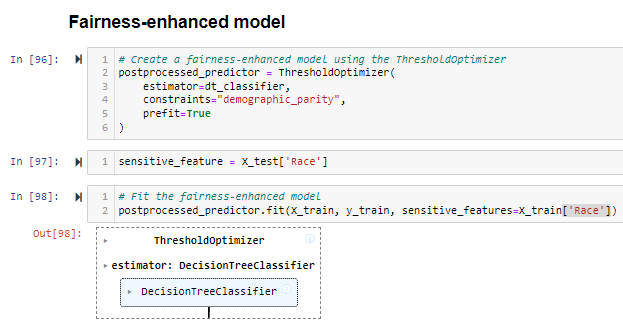
Our work has been focused on elaborating two unique models that enable the prediction of educational outcomes and on a methodology that makes the results both accurate and fair. The Decision Tree Model, a standard with information gain as a metric, was constructed in the first instance. It employed a range of explanatory factors, such as students’ initial scores prior to testing and subsequent performance gains and demographic characteristics, to make such a prognosis. The second model was a Fairness-enhanced Model, implemented using the fairlearn library as a helping tool. This advanced model was designed with a pivotal objective: For this very reason, choosing migrants should be mainly in line with these criteria. In an attempt to suppress bias based on sensitive attributes, including race and gender, this model aims to amend the decision tree’s predictions, contributing to the reduction of these types of biases (Mehrabi et al., 2021). Including such social equality criteria is envisaged as a step backward in designing educational models but with the idea of obtaining fairer predictions and eventually being able to administer a more equitable intervention.
Results and Model Comparison
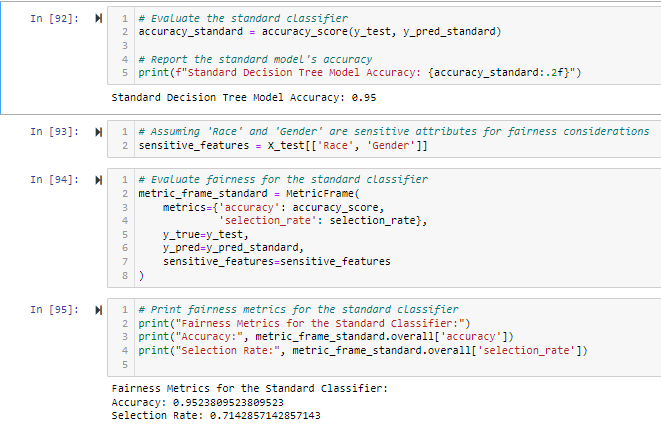
The standard classifier yielded less than unity, with a relatively high accuracy of approximately 0.95. This means that the model accurately foretold students’ final grades at a very high level of perfection with the aid of features such as pretest scores, learning improvement, and demographic accents. The evaluation criteria, which focused on selectivity, had a measured value of approximately 71%. The selection rate is the proportion of marked as positive, so in this case, it may be about the bias of the model in classifying the male/female and black/white students.
Now, let us apply the fairness-enhanced classifier to the original dataset, and we see the model’s accuracy decreased to around 0.71. This problem of answer precision can be observed during model fairness tuning since models usually mean accuracy by reducing the precision required to arrive at more fair results. The fairness test for the enhanced models indicates that the selection rate of race categories 0 (possibly Hispanic students) and 1(maybe Black students) are 0.58 and 0.50, respectively. This shows a trend of the selection being more balanced, which indicates an increasing degree in demographical proximity, where E, for example, is predicted to be more likely among black people than white people. This step is the rightful place to be in so that a model taking decisions upon a specific category of students would not be biased towards or particularize one group against sensitive attributes.
Discussion
Looking into the potential of fair information gain to fight against the demographic and social factors-based biases in education curricula among students who are either rich or poor poses a challenge that needs to be well-researched. Adjustment disparities caused by various social factors are sought by implementing fairness-enhanced algorithms like the fairness-enhanced classifier. These students are in the same geographical area, but their experiences differ. For those attending Ruben Dario Middle School in Doral, exposure to local resources, parental involvement, technology, and extracurricular activities could affect their social status. On the other hand, others attending North Dade Middle School in Opa-Locka could be subject to a myriad of factors like differing These external variables are of particular importance considering that they may influence the cognitive outcomes in learners significantly and, following their performance in standardized test and their overall scores in the subjects (Leonard & Woodland, 2022). Through fairness-adjusted information gain for working out decision trees, we would like to add instances of social bias, based upon which we would strive to transfer our assessments to more equitable educational schemes.
The outcomes stemming from the discriminatory-fairness classifier exhibit the same concern as fairness versus accuracy. The plain classifier could reach a high accuracy of around 0.95, whereas we had to take a lower accuracy of about 0.71 to achieve a fairer algorithm. Besides, race was no longer the only factor determining the admission rate; the deaf student race population approached the demographic rate. Instead of relying on metrics to determine how well our systems perform, we consciously choose to favor equity over accuracy. Considering this tradeoff in educational applications is generally critical and meaningful.
Furthermore, accuracy in the identification of vulnerable students should be supplemented by fairness so that the interventions will not be put against some disadvantaged groups, such as black or female ones, because they seem to be at risk. It is difficult to work out this balance between fairness and helping the students who need it most, irrespective of their demographic. The debate is that overcorrecting for fairness may lead to passing some students while ignoring some students who might need help.
Regarding the social challenges of the student performance towards the nature of the input data and the problem of fairness in the model classification, applying the data and model that account for the biases can be taken as the first step at realizing the effect of socioeconomic status. The model indicates that policymakers should revise their stance towards generally accepted conceptions of how external things impact academic performance since such models have the potential to perpetuate existing disparities and must be designed carefully. The tread between the model’s completeness and fairness requires the algorithms to be written so that the solution is achieved as the accuracy and justice of the model are being met (Jiang & Pardos, 2021). Consequently, both the educational systems and policymakers shall constantly monitor the effects of these models to ensure the utilization of this approach by the end for all groups of students who are disadvantaged.
Conclusion
Ultimately, fairness-enhanced machine learning models incorporated into the school system show the necessity of preserving the balance so accurate predictions are obtained with unbiased competition. We found out that even after fairness correction, the accuracy of the standard and fairness-adjusted decision tree classifiers is still intact. Nevertheless, consideration is vital when it comes to accurately maintaining sensitive target attributes (e.g., race and gender) in the classification process. This study proves how important it is to consider the social and demographic factors and incorporate these aspects in educational models to avoid repeating the same inequities as before. On the road ahead, it will still be essential for the algorithms to keep improving with them being accurate and fair to have a learning system that positively impacts the students and advances their learning regardless of their backgrounds.
References
Fan, C., Chen, M., Wang, X., Wang, J., & Huang, B. (2021). A review of data preprocessing techniques toward efficient and reliable knowledge discovery from building operational data. Frontiers in Energy Research, 9, 652801.https://doi.org/10.3389/fenrg.2021.652801
Jiang, W., & Pardos, Z. A. (2021, July). Towards equity and algorithmic fairness in student grade prediction. In Proceedings of the 2021 AAAI/ACM Conference on AI, Ethics, and Society (pp. 608–617).hhttps://doi.org/10.1145/3461702.3462623
Leonard, A. M., & Woodland, R. H. (2022). Anti-racism is not an initiative: How professional learning communities may advance equity and social-emotional learning in schools. Theory Into Practice, 61(2), 212–223.https://doi.org/10.1080/00405841.2022.2036058
Mehrabi, N., Morstatter, F., Saxena, N., Lerman, K., & Galstyan, A. (2021). A survey on bias and fairness in machine learning. ACM computing surveys (CSUR), 54(6), 1-35.https://doi.org/10.1145/3457607
Pagano, T. P., Loureiro, R. B., Lisboa, F. V., Peixoto, R. M., Guimarães, G. A., Cruz, G. O., … & Nascimento, E. G. (2023). Bias and unfairness in machine learning models: a systematic review on datasets, tools, fairness metrics, and identification and mitigation methods. Big data and cognitive computing, 7(1), 15.https://doi.org/10.3390/bdcc7010015
 write
write