Part 1: Industry and company overview
The company to be analysed is the Boeing company, which is one of the leading aerospace and airline plane manufacturers for commercial and military purposes. Boeing designs, manufactures and markets commercial jet aircraft along with additional jet support services, such as the 747, 767, 777 and 737 MAX models. (Reuters, 2019) Boeing also conducts research, development and production activities for military aircraft, for purposes such as fighter aircraft and surveillance. (Reuters, 2019). As an airlines and aerospace company with a global presence, Boeing is highly dependent on overall macroeconomic conditions such as unemployment rates, growth, fuel prices and interest rates.
In terms of its mission and values, Boeing’s mission is to connect, protect, explore and inspire the world through aerospace innovation, based on an enterprise strategy of unity, corporate strengths and fast growth based on productivity. (Boeing, 2019) Boeing’s company values include integrity, quality, safety, diversity, trust, respect, corporate citizenship and stakeholder success. (Boeing, 2019)
Boeing has recently run into issues with its 737 Max aircraft, which has been involved in two fatal airline crashes to date. (Lee, 2019) As a result, Boeing has faced regulatory pressures and penalties from several of its markets, in order to compel it to reform its manufacturing and safety compliance processes.
The U.S. aviation industry has remained a strong pillar of the U.S. economy since the post-war boom. However, the 2008 global financial crisis served as a major catalyst of reform for the inefficient industry, and the U.S. airline industry implemented significant restructuring to better meet capacity demands and compete globally. However, in recent times, the global airline industry has declined in profitability, with forecasts of lowest industry profits in five years amid rising fuel costs and the U.S.-China trade war. This was shown by the revision in the earnings forecast for the International Air Transport Association, which cut its earnings forecast from $35.5 blllion in 2019 to $28 billion in 2019. (IATA, 2019)
Part 2: Definitions of key economic indicators
This essay will first introduce three key economic indicators: real gross domestic product, the unemployment rate and the inflation rate.
Real gross domestic product (GDP) refers to the real value of all goods and services produced in an economy in a selected year. Real GDP is typically calculated using the nominal GDP, which takes the value of all goods and services at current prices, divided by a deflator that takes into account the impact of inflation.
The unemployment rate refers to the share of unemployed persons as a percentage of the total quantity of people in the labour force, which is the total number of people employed and unemployed who eligible for labour. (International Labor Organization, 2019) Unemployed persons are generally defined as individuals of working age who are not employed but are available to take up work and are actively seeking employment. (International Labor Organization, 2019)
The inflation rate, as measured by the Consumer Price Index (CPI), refers to the rate of change in prices in an economy. For example, an 8% inflation rate means that on average, prices in the economy have risen 8% from the previous year. The Consumer Price Index is a measure of the mean change in the prices faced by consumers for a fixed representative basket of goods and services over time. (Bureau of Labor Statistics, 2019) Measuring the inflation rate through the CPI allows the inflation rate to be focused on the goods and services which matter most to consumers, based on a sample of goods and services held representative in the CPI basket. The annual percentage change in a CPI can therefore be used to measure inflation.
Part 3: Trend Analysis of Key Economic Indicators from 2000 to 2017
The data for real gross domestic product, the unemployment rate and the inflation rate indicates the following trends.
Foremost, based on Figure 1, unemployment in the U.S. economy was relatively stable from 2000 to 2007, at 4 to 6 % (advanced industrial economies generally target an unemployment rate of 3 to 5%). However, unemployment rose rapidly from 2007 to 2009, likely in the wake of the global financial crisis. Unemployment then fell slowly from 2009 to 2017, and as of 2015 to 2017, has reached a pre-recession level.
Secondly, based on Figure 3, real GDP in billions has risen steadily at a constant rate, with the exception of the 2007 to 2009 period, where GDP growth slowed and then declined through the effects of a recessionary economy. Based on Figure 2, it can also be observed that there was a rapid acceleration and deceleration of growth from 2003 to 2005, based on real GDP as measured by quantity indexes.
Finally, based on figure 4, the consumer price index has risen at a steady rate from 2000 to 2017. This is also reflected in figure 5, where the inflation rate as measured by the consumer price index stayed constant between 1 to 1.5%.
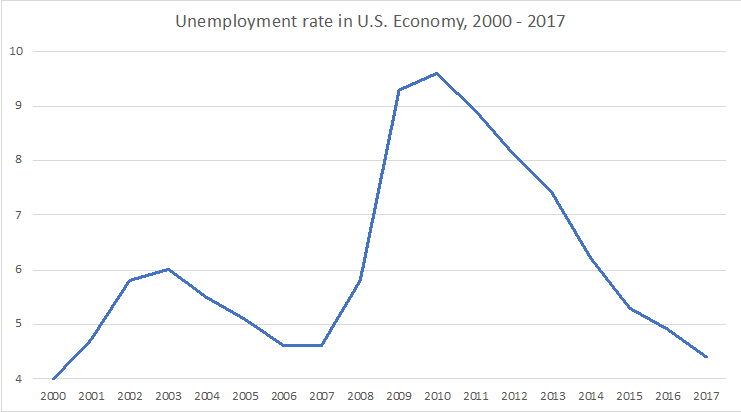
Figure 1: Unemployment rate in the U.S. Economy, 2000 – 2017
Source: Bureau of Labor Statistics. (2019, January 18). Labor Force Statistics from the Current Population Survey. Retrieved from https://www.bls.gov/cps/cpsaat01.htm
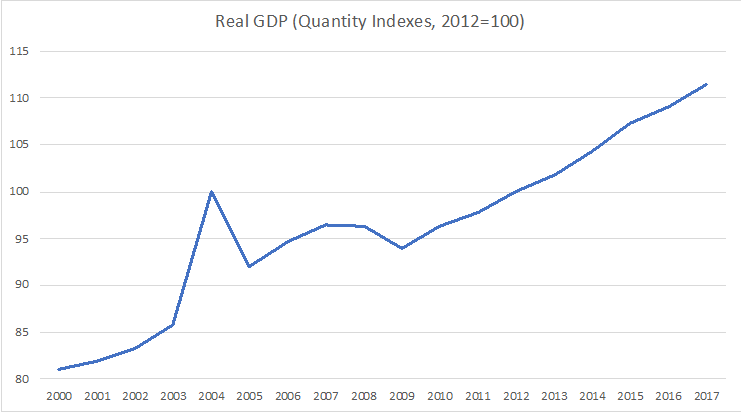
Figure 2: Real GDP (Quantity Index, 2012 = 100)
Source: Bureau of Economic Analysis. (2019, May 30). National Income and Product Accounts Table 1.1.3. Real Gross Domestic Product, Quantity Indexes. Retrieved from https://apps.bea.gov/iTable/iTable.cfm?reqid=19&step=2#reqid=19&step=2&isuri=1&1921=survey
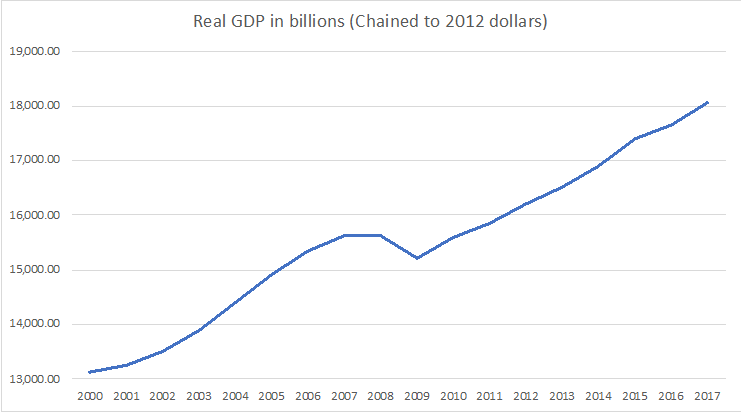
Figure 3: Real GDP in billions (chained to 2012 dollars)
Source: Bureau of Economic Analysis. (2019, May 30). National Income and Product Accounts Table 1.1.2. Real Gross Domestic Product, Chained Dollars. Retrieved from https://apps.bea.gov/iTable/iTable.cfm?reqid=19&step=2#reqid=19&step=2&isuri=1&1921=survey
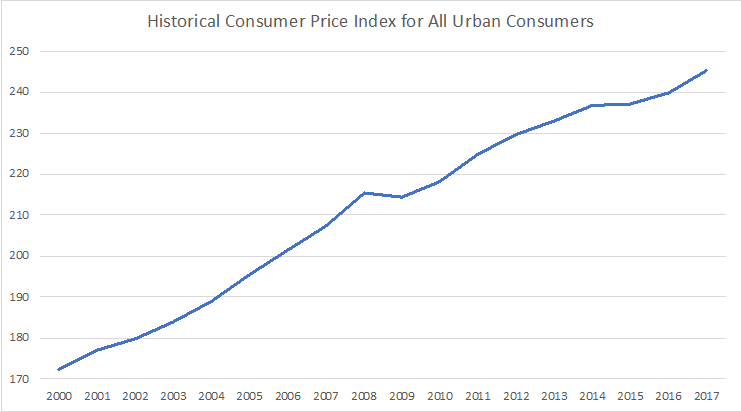
Figure 4: Historical CPI for all urban consumers
Source: Bureau of Labor Statistics. (2019, May 25). Historical Consumer Price Index for All Urban Consumers (CPI-U): U.S. city average, all items, by month. Retrieved from https://www.bls.gov/cpi/tables/supplemental-files/historical-cpi-u-201901.pdf
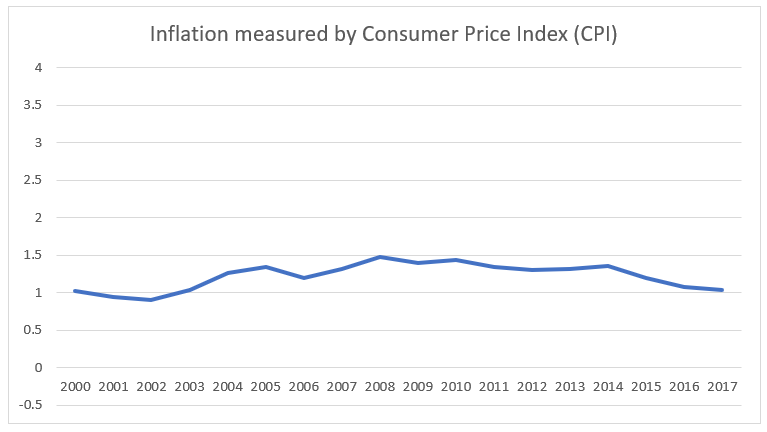
Figure 5: Inflation measured by Consumer Price Index
Source: OECD. (2019, January 30). Inflation (CPI) for the United States. Retrieved from https://data.oecd.org/price/inflation-cpi.htm
Part 4: Firm-specific economic indicator identification and trend analysis
In addition to the three nationwide macroeconomic indicators above, this essay will define, collect and summarize date for Boeing’s sales revenue, foreign exchange rate and manufacturing industry unemployment rate.
Boeing’s sales revenue will be defined in this paper as Boeing Company’s revenue before interest, taxes, cost of goods sold, capital expenditure, and depreciation. The revenue provides a metric to assess the overall health of Boeing as a company, and is impacted by the overall health of the U.S. economy.
The foreign exchange rate refers to the rate at which one currency is exchanged for another. In the case of this paper, the US dollar to Euro exchange rate will be used, as Europe is one of the U.S.’s largest consumer markets, including that of the aerospace technology and aviation industry.
The unemployment rate of the manufacturing industry is the unemployment rate (defined above) for industries related to manufacturing, such as electronics manufacturing, chemicals, paper, and heavy machinery. This metric is more relevant to the aviation industry and to Boeing as it characterises the unemployment rate for the industry segment which Boeing is most closely associated with (manufacturing).
The above data indicates the following trends.
Foremost, Boeing’s sales revenue has been growing steadily from 2000 to 2017, despite recessionary pressures in 2008 to 2009. Boeing’s sales revenue did, however, record a drop from 2008 to 2009.
Secondly, the foreign exchange rate (USD to Euro) has increased to a peak in 2008/2009, and then decreased to its original 2004 levels as of 2017. This indicates that for the period of 2000 to 2017, the US dollar strengthened against the Euro for the first half, and weakened against the Euro for the second half. This meant that, in foreign exchange terms, US companies such as Boeing had to export more expensively and import more cheaply from Europe for the period 2000 to 2008, and then import more expensively and export more cheaply from Europe for the period 2008 to 2017, which would have affected processes such as Boeing’s procurement and sales.
Finally, the unemployment rate for manufacturing closely followed the overall unemployment rate for the U.S. economy, with a small rise and fall from 200 to 2006, and a sharp increase in the unemployment rate in 2008, followed by a prolonged recovery in the form of a gradual decrease in unemployment rate from 2008 to 2017.
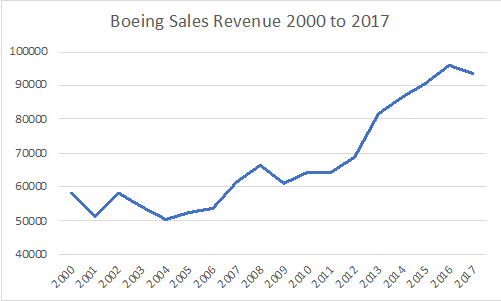
Figure 6: Boeing Sales Revenue, 2000 to 2017
Source: GuruFocus. (2019, June 1). Boeing Co. Retrieved from https://www.gurufocus.com/financials/BA
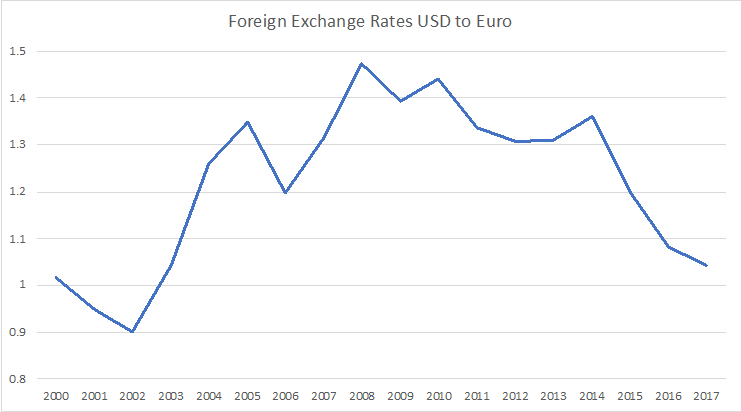
Figure 7: Foreign Exchange Rates USD to Euro
Source: Federal Reserve System. (2019, June 3). Foreign Exchange Rates USD to Euro. Retrieved from https://www.federalreserve.gov/releases/h10/Hist/dat00_eu.htm
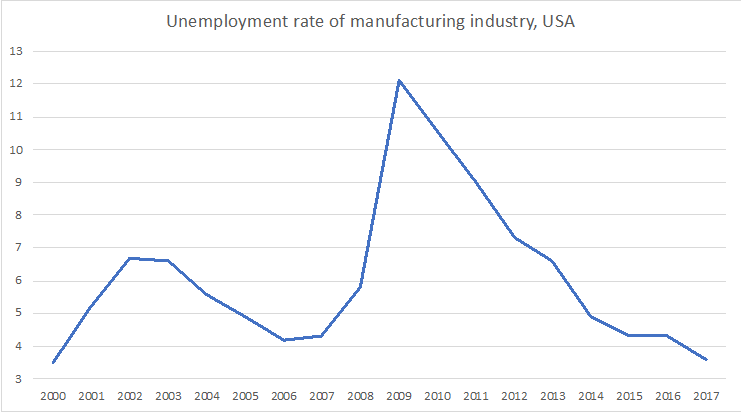
Figure 8: Unemployment rate of manufacturing industry, USA
Source: Source: FRED. (2019, Jun 7). Unemployment Rate: Manufacturing Industry, Private Wage and Salary Workers. Retrieved from https://fred.stlouisfed.org/series/LNU04032232#0
Part 5: Comparison of national and firm-specific indicators
Foremost, in comparing real GDP growth (as measured by CPI) and Boeing’s sales revenue growth, it can be seen that while Boeing is impacted by the overall US real GDP growth rate (with a decline in sales revenue from 2008 to 2009), on the whole, it may be concluded that Boeing is relatively resistant to changes in U.S. real GDP growth.
Secondly, in comparing the CPI-based inflation rate and the foreign exchange rate, it can be observed that both of these metrics are measures of the health of the U.S. economy, and also impact Boeing’s procurement and sales processes. For example, if the inflation rate were too high, the purchasing power of businesses such as airlines who purchase from Boeing would decline. Likewise, if the foreign exchange rate were too high (if the US dollar were too strong compared to the Euro), the purchasing power of businesses such as European airlines who purchase from Boeing would decline. The above data shows that inflation has stayed at a constant rate, which is good for Boeing (as it represents a stable business environment). Similar, for the foreign exchange rate, it is currently in Boeing’s favour as a weaker US dollar means cheaper exports, although that was not the case for the first half of the studied period, from 2000 to 2008.
Finally, in terms of unemployment rate, it can be observed that unemployment rates in the manufacturing sector closely follow unemployment rates at the national level, with both unemployment rates rising sharply in the 2008 recessionary period, followed by a prolonged recovery in the form of a slow decrease in unemployment rates over time from 2008 to 2017. However, it may also be observed that changes in unemployment rates for manufacturing are more pronounced than national unemployment rate changes, given that the peaks of manufacturing unemployment rates (6.5% in 2003, 12% in 2009) are higher than those of national unemployment rates.
Part 6: Analysis of current economic conditions
Current economic conditions are more consistent with classical economic theories. This is because Keynesian economic conditions involve proactive government spending when in recession to stimulate an economy by raising aggregate demand, while neoclassical economic conditions involve the enforcement of free markets and minimal government intervention in order to allow the economy to perform well. (Konings, 2018) Given the economic recovery under President Donald Trump, who has pushed an agenda of deregulation, minimal government intervention and free market conditions, current economic conditions are more consistent with classical economic theories. However, it may be argued that the present boom in the U.S. economy is also the result of a delayed effect of President Obama’s Keynesian policies, and that President Trump is also engaging in a limited degree of Keynesian policies through increased deficit-financed infrastructure and military spending.
Part 7: Impact of the macro-environment
The macro-environment, as measured by unemployment rate, real gross domestic product, and the inflation rate (CPI), impacts Boeing in the following ways. Foremost, the fall in real gross domestic product from 2008 to 2009 meant a drop in consumer goods such as tourism, and industrial activities such as shipping and international logistics. This likely contributed to a fall in Boeing’s revenue during the same period. Secondly, the unemployment rate, which was high from 2008 to 2014, likely meant cheaper labor for Boeing, but now that the unemployment rate has fallen, Boeing is likely hard pressed to find skilled workers affordably for its manufacturing operations. Finally, the inflation rate, which has remained relatively stable from 2000 to 2017, represents a stable price environment for Boeing and its customers.
Part 8: Analysis of the relationship between inflation, unemployment and the business cycle and its impact on Boeing
In general, when a business cycle is at a peak (and when the economy is doing well), unemployment will be lower and inflation will be higher. (Bade and Parkin, 2009) When a business cycle is in a trough, unemployment will be higher and inflation will be lower. For example, from 2008 to 2009, during the global financial crisis, it may be observed that inflation was low and unemployment was high. The impact of this relationship on Boeing is that the price of labor and other inputs will be lower during the trough of a business cycle (during the recessionary period), although demand for goods and services produced by Boeing during that time will be lower as well. Conversely, during a period of a business cycle peak, inflation and labor prices will be higher, which will represent more expensive factor costs for Boeing, although demand for Boeing’s goods and services will also be higher.
Part 9: Evaluation of fiscal and monetary policy impact on the economy and Boeing
Following a prolonged recovery period of near-zero interest rates from 2008 to 2016, the Fed has been gradually increasing its interest rates, although it held off on an interest rate rise for 2019. (BBC, 2019) Furthermore, under the Trump Administration, the U.S. has pursued a loose fiscal policy based on military and infrastructure spending. This is likely to have the following implications for Boeing. Foremost, higher interest rates will likely mean lower liquidity and lower growth, which is detrimental for Boeing. Conversely, a looser fiscal policy based on military spending will likely bode well for Boeing, as it would mean an increase in military contracts for Boeing’s military aircraft orders, as well as a stimulated economy with higher growth.
Part 10: Final section: forecast analysis of aviation industry with specific indicator, potential impact analysis and recommendations for strategic initiatives
This section will discuss a forecast analysis for the global aviation industry based on the 2018 Airbus Global Market Forecast. The 2018 Airbus Global Market Forecast from 2018 to 2037 has forecast that the commercial aviation industry has been sturdy in the face of macroeconomic shocks, with traffic and fleet size forecast to double over the next 15 years. (Airbus, 2018) As shown by Figure 1, the number of aircraft is forecast to grow from 21,450 in 2018 to 47,990 in 2037. This will large be fuelled by a growth in air traffic in emerging economies, buoyed by a rising middle class, as shown by how, in Figure 2, CAGR for emerging economy air traffic will go from 29% in 2018 to 40% in 2038. In Figure 3, we can also observe from IATA’s global aviation industry passenger forecast that global airline passenger demand is set to grow by almost 2 to 4 times its present level, although this depends on the regulatory environment and how protectionistic the global economy will become.
However, as earlier stated, global airline industry profits are in decline although the industry as a whole will remain profitable. Increasing costs will continue to reduce airline industry profitability, which will continue to put pressure on the Boeing company.
Hence, Boeing should pursue the following strategic initiatives. Foremost, Boeing should invest in strategic partnerships in new aerospace technologies such as fuel-efficient budget carriers, which will allow it to exploit the market opportunity offered by the growing middle class. Secondly, Boeing should pursue joint ventures in emerging markets to distribute its aircraft to regional carriers which serve the growing middle class.
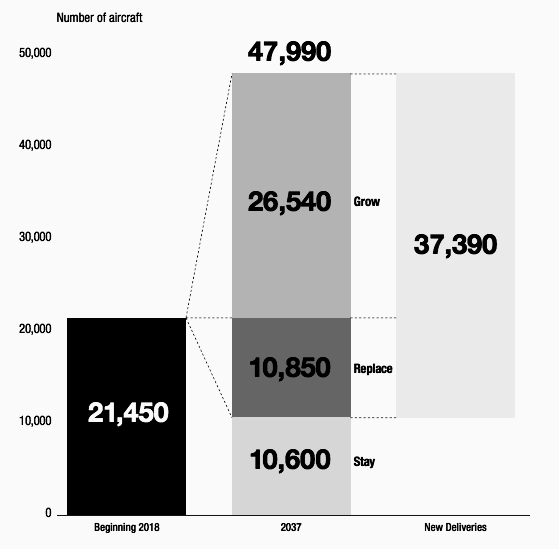
Figure 1: Growth in number of aircraft from 2018 to 2037
Reference: Airbus. (2018, June 23). 2018 Airbus Global Market Forecast: Global Networks, Global Citizens 2018 – 2037. Retrieved from https://www.airbus.com/content/dam/corporate-topics/publications/media-day/GMF-2018-2037.pdf
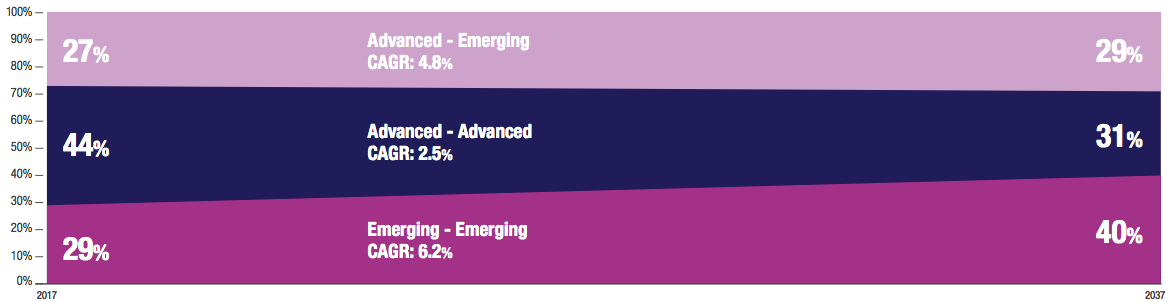
Figure 2: Network and air traffic forecast by region
Reference: Airbus. (2018, June 23). 2018 Airbus Global Market Forecast: Global Networks, Global Citizens 2018 – 2037. Retrieved from https://www.airbus.com/content/dam/corporate-topics/publications/media-day/GMF-2018-2037.pdf
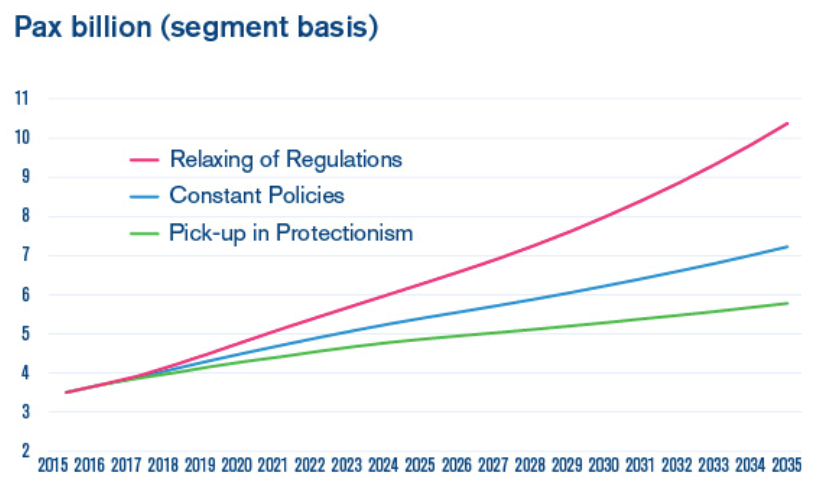
Figure 3: Global aviation industry passenger forecast based on three scenarios.
Reference: IATA. (2016, October 18). IATA Forecasts Passenger Demand to Double Over 20 Years. Retrieved from https://www.iata.org/pressroom/pr/Pages/2016-10-18-02.aspx
References (APA)
Airbus. (2018, June 23). 2018 Airbus Global Market Forecast: Global Networks, Global Citizens 2018 – 2037. Retrieved from https://www.airbus.com/content/dam/corporate-topics/publications/media-day/GMF-2018-2037.pdf
Bade, R., & Parkin, M. (2009). Foundations of Macroeconomics. Pearson Addison Wesley.
BBC. (2019, March 20). Slower US growth means no rate rise for 2019, says Fed. Retrieved from https://www.bbc.com/news/business-47644267
Bloomberg. (2019, June 1). The Boeing Co. Retrieved from https://www.bloomberg.com/profile/company/BA:US
Boeing. (2019, February 10). Principles: Vision. Retrieved from https://www.boeing.com/principles/vision.page
Bureau of Economic Analysis. (2019, May 30). National Income and Product Accounts Table 1.1.3. Real Gross Domestic Product, Quantity Indexes. Retrieved from https://apps.bea.gov/iTable/iTable.cfm?reqid=19&step=2#reqid=19&step=2&isuri=1&1921=survey
Bureau of Economic Analysis. (2019, May 30). National Income and Product Accounts Table 1.1.2. Real Gross Domestic Product, Chained Dollars. Retrieved from https://apps.bea.gov/iTable/iTable.cfm?reqid=19&step=2#reqid=19&step=2&isuri=1&1921=survey
Bureau of Labor Statistics. (2019, March 23). Consumer Price Index. Retrieved from https://www.bls.gov/cpi/questions-and-answers.htm#Question_14
Bureau of Labor Statistics. (2019, May 25). Historical Consumer Price Index for All Urban Consumers (CPI-U): U.S. city average, all items, by month. Retrieved from https://www.bls.gov/cpi/tables/supplemental-files/historical-cpi-u-201901.pdf
Bureau of Labor Statistics. (2019, January 18). Labor Force Statistics from the Current Population Survey. Retrieved from https://www.bls.gov/cps/cpsaat01.htm
Federal Aviation Administration. (2018, June 3). FAA Aerospace Forecast: Fiscal Years 2018 – 2038. Retrieved from https://www.faa.gov/data_research/aviation/aerospace_forecasts/media/FY2018-38_FAA_Aerospace_Forecast.pdf
Federal Reserve Bank of St. Louis Economic Research. (2019, June 3). Effective Federal Funds Rate (FEDFUNDS). Retrieved from https://fred.stlouisfed.org/series/FEDFUNDS#0
Federal Reserve System. (2019, June 3). Foreign Exchange Rates USD to Euro. Retrieved from https://www.federalreserve.gov/releases/h10/Hist/dat00_eu.htm
FRED. (2019, Jun 7). Unemployment Rate: Manufacturing Industry, Private Wage and Salary Workers. Retrieved from https://fred.stlouisfed.org/series/LNU04032232#0
GuruFocus. (2019, June 1). Boeing Co. Retrieved from https://www.gurufocus.com/financials/BA
IATA. (2016, October 18). IATA Forecasts Passenger Demand to Double Over 20 Years. Retrieved from https://www.iata.org/pressroom/pr/Pages/2016-10-18-02.aspx
IATA. (2019, June 2). Press Release 27: Press Release No.: 27 Date: 2 June 2019 Slowing Demand and Rising Costs Squeeze Airline Profits. Retrieved from https://www.iata.org/pressroom/pr/Pages/2019-06-02-01.aspx
International Labor Organization. (2019, January 6). Unemployment rate. Retrieved from https://www.ilo.org/ilostat-files/Documents/description_UR_EN.pdf
Jolly, Jasper. (2019, June 2). Global airline industry cuts profit forecast by more than a fifth. Retrieved from https://www.theguardian.com/business/2019/jun/02/airline-industry-cuts-profit-forecasts-fifth-us-china
Konings, M. (2018). From Hayek to Trump: The logic of neoliberal democracy. Socialist register, 54(54).
Lee, Yen Nee. (2019, March 17). CNBC: US is scrutinizing the development of Boeing’s 737 Max aircraft: WSJ. Retrieved from https://www.cnbc.com/2019/03/18/us-is-scrutinizing-the-development-of-boeings-737-max-aircraft-wsj.html
Mataloni, Lisa and Jeannine Aversa. (2019, May 17). Gross Domestic Product. Retrieved from https://www.bea.gov/data/gdp/gross-domestic-product
OECD. (2018, February 1). Real GDP forecast. Retrieved from https://data.oecd.org/gdp/real-gdp-forecast.htm
OECD. (2019, January 30). Inflation (CPI) for the United States. Retrieved from https://data.oecd.org/price/inflation-cpi.htm
Reuters. (2019, June 3). Boeing Co (BA.N). Retrieved from https://www.reuters.com/finance/stocks/company-profile/BA.N
 write
write