Introduction
Voter turnout is the percentage of registered voters who participated in an election. Voter turnout can be expressed in form of the percentage of the population old enough to vote, the percentage of the number of eligible voters, or a percentage of registered voters. These are the measures taken into consideration in voter participation and can lead to misleading inferences regarding the health of democracy. The voter turnout in a country is determined by different factors. The main factor affecting voter turnout is education where the more likely a person is educated the more likely they will vote (Grillo, 2020). Others include income level and class. Therefore voter turnout measures the percentage of people who have voted against those who are eligible of voting and have not voted.
The research questions that are going to be focused on include:
- Is voter turnout important in an election?
- What are the determinants of voter turnout in an election?
- Is there a relationship between the rate of voter turnout and the type of change in policies of a country?
The above research questions lead to the main purpose of the study, which is to determine the different measures used to determine voter turnout in an election or event. Voter participation is important in every aspect of the country and should be taken into serious consideration. Due to this, the main objectives of the study include:
- To determine the factors affecting voter turnout in a country
- To determine the appropriate voter turnout methods used to determine the extent of participation of voters.
- To determine the voter turnout distribution by focusing on the determinants of voter turnout
In voter turnout, it is stated that young people are less likely to turnout for voting than older people while wealthier people are also more likely to turnout than the less wealthy. Voter turnout is affected by a variety of factors. A low voter turnout is always related to a political disengagement with the belief that voting for one candidate or party will not have a major impact on the public policy of the country. Voter turnout in the US has been fluctuating over the years with about 60% of the eligible voters voting during the presidential elections and 40% voting during the midterm elections. This makes the voter turnout in the US lower than in other countries. This has made voting in other countries to be compulsory with the countries registering a high voter turnout of up to 90% (Hill, 2006). Examples of these countries included Australia, Chile, and Belgium. Sweden Austria and Italy experienced a voter turnout of up to 80%. The voter turnout greatly affects the types of leaders that people will elect in the country. Therefore voter turnout is important in any country conducting an election, which has made several countries make it compulsory to vote.
Literature Review
This chapter is going to look at the different takes on voter turnout and the measures taken in voter turnout. Moreover, the determinants of voter turnout will be also discussed in the chapter to establish a connection between the two variables.
- Is low turnout a bad thing?
Low voter turnout can be perceived in many different ways. Some people may regard low voter turnout as an indication of general satisfaction with the government and politics. However, it can also mean that smoothing is amiss in the country and government. However, high voter turnout cannot also alter the political outcomes of a country. Highton and Wolfinger (2001) asserted that there is a minimal difference between voters’ preferences and that of the citizens, this would make no difference to the election to the outcomes of the election even if everyone voted. Even if there is high certainty that this is the outcome if everyone voted, it cannot be used as grounds that low unequal voter turnout is of no consequence. The electoral outcome arguments state that it is hard to predict the behavior of people and their thinking under conditions that are radical to those that currently prevail. This means that in a country that is politically characterized by a high voter turnout, one could reasonably expect changes in political attitudes and behavior to occur over time.
Different problems have been created in the American democracy by a low voter turnout in the elections. Firstly it has affected the value levels, which include the legitimacy political equality, elite power minimization sovereignty, and representativeness. However, high non-voting violates political equality. There is a connection between political equality and liberal democracy with effective particularism connecting them together (Conover & Feldman, 1981). The principle of one vote one value is also violated in the process. Therefore, there is a strong relationship between non-participation and socioeconomic status where there is a disproportionate division of funds among the poor in the country meaning that nonvoting have material consequences to a specific group of people.
- Experiments to estimate the effects of education on voter turnout
The relationship existing between education and voter turnout ranks among the most extensive correlations in American survey research. The turnouts rates through the cross-sectional surveys have been reported to climb with consistent years of formal schooling. Several experiments have been done to determine the effects of education on turnouts including the STAR experiment, “I Have a Dream Natural Experiment”, Perry PreSchool Experiment, and Neyman-Rubin Causal Model. In the Perry PreSchool Experiment, the high school graduation rates were 44.4% in the control group and 65% in the treatment group (Sondheimer & Green 2010). The voter turnout was higher in the treatment group (18%) than in the control group (13%). Generally, from all three experiments, education was observed to be a factor contributing to voter turnouts.
Sondheimer and Green (2010) expressed their skepticism that education increases voter turnout. However, a few questions need to be answered including by what mechanisms does education induce higher rates of voting? Stockemer (2016) stated that education imparts the skills to negotiate bureaucratic hurdles associated with voting. This argument by Wolfinger does not correspond to voter turnouts in some countries like Britain where education is less influential and voter registration is automatic. There is also a steep education gradient in voting in some states like North Dakota, where there is no voter registration and also in some states where voters can register on Election Day. A second argument that justified education as a means to increase voter turnout is that it increases one’s general interest in and knowledge of politics. Analysis of “I Have a Dream Experiment” showed that there is a connection between education and political interest. This was characterized by an individual’s belief to participate in politics, and internal political efficacy. Thirdly, it was believed that increased education expands social networks and the likelihood of participating in community and political endeavors. Educated people are more likely to have politically involved people in their network of friends and coworkers (Sondheimer & Green 2010). Therefore, education may set in not only changes in the outlook but also changes in the way that one is engaged in one’s social and political environment. This was a hypothesis that was justified by Perry and IHAD experiments.
- Foreign policies
Citizens in the country connect their foreign policy views to their evaluations of the Republican candidates (Lodge & Powderly, 1890). However, the same foreign policies are much less likely to affect evaluations of the Democratic Party and the Democratic candidates. Moreover, it is believed that Americans always reward the candidates and parties perceived to hold hawkish positions and punish those candidates that appear to be dovish. A good example is in 2016 when Donald Trump stated that he was would build a wall around the US when elected president. It is this kind of policy that made him win the general elections that year. Foreign policies determine whether the voters will vote for or against you depending on the proposed foreign policy that a candidate will put in motion. Moreover, no foreign policy will fit all the citizens in the country, therefore, a candidate has to determine the best policy that is supported by a majority of people in the society and make it a promise during campaigns (Stockemer 2016).
- Political ideology
Cynicism in politics and the lack of trust in politicians is another hypothesized cause that led to higher absenteeism in turnout. Parties and politicians can try to address this factor themselves by resisting the temptation of running negative campaigns and being scrupulous in keeping their election promises (Fowler 2013). However, reforming a whole culture of political campaigns is difficult given the vast perception of politicians in the country. This is because conservative parties have little to gain from the reforms, therefore, it is unlikely for them to focus on the reforms. Character alteration of the American elections is an extremely complex exercise to engineer. A good example is that it is difficult and highly unlikely that someone will be willing to dismantle their federalism or institutional arrangements on the chance that it will lead to higher voter turnout.
Political ideologies can vary in different ways ranging from unrealistic promises to attainable ones. However, public mistrust has led to lower voter turnout and high absenteeism because of the many fake promises held out by previous politicians and then failing to honor their promises after getting into office. Political ideologies have led to the reduction in voter turnout in two different ways. First, the realistic ideologies and promises made by the candidates are not being met once they are in the office, making the public reduce their trust in candidates (Fowler 2013). Secondly, stating unrealistic promises and ideologies, makes the public know that the main intention of the candidate is to gain votes. This will reduce the confidence level of voters in the country, discouraging some of them from voting in the elections. Therefore, political ideologies should be in such a way that they are attainable in the long run and increases the confidence level of the voters into voting.
- Political participation and involvement
Political participation and involvement include the extent of attention that citizens give to the political events and happenings in the country. By engaging in political participation and involvement, a voter can determine the types of policies and ideologies that best fits his goals or that the country needs. A voter can determine the best policies for a candidate and how those policies can help them. This is different from a voter who does not pay attention to the political ideologies and is not involved in any parties and events held by a political candidate. The voter will miss on the ideologies and policies proposed by the different candidates, making it hard for them to vote in any election. Moreover, it is often those who are at par with political participation that has a high rate of voting for the candidate having the policies that seem best to them. This is not true for the people who never keep track of the political engagements in the country, where they only can vote if voting is compulsory as evident in some countries (Hill, 2006). However, in the US it is not compulsory, this means that there is a high number of voters who do not take part in political engagements and their chances of voting are close to 0 because they lack the information and ideologies that are presented by candidates seeking to have an office.
- Improving turnout
Easier registration procedures are not the only answers to improving voter turnout. There are other institutional means of improving the voter turnout including reducing the frequency and complexity of the elections in addressing the problem of voter fatigue, moving the election days to a Saturday or declaring the day a national holiday, and providing automatic registration and absentee voting (Erickson & Tedin, 2005), putting polling places in shopping malls to reduce the opportunity if the high cost of voting, and extending the voting over several days. Incentives can also be used to encourage voting.
The voter turnout can also be affected by changing the character of the election. The level of competitiveness and saliency of the elections comprises the nature of the elections. Voter turnout is affected “by the motivation of voters to affect the course of the public policy”, this means that some institutional structures including the government and separation of powers will tend to depress voter turnout. (Erickson & Tedin, 2005) stated that the institutional structures dilute the strength of the relationship between voting and the policy consequences. The salience of American elections is also affected by the choice-restricting effect of a simple plurality system. Richard Rose (1978) stated that “Americans voters are offered less choice than voters in any other Western nation” because only two parties have a higher chance of winning congressional seats or the presidency. Moreover, low variation exist in the party labels at the state level in America than in other countries including Canada. Therefore, the only way that the author deemed possible to increase voter turnout is through the introduction of proportional representation to decrease the lack of choices and also presents a means for the minority voters to have a say and chance at being represented (Franklin, 2004). The one cheaper solution to improve voter turnout in the country is to embrace compulsory voting. It is the only way that the country will achieve the 90% and above voter turnout, as observed in Australia where the voter turnout of registered voters is 95%, Belgium (93%, and the Netherlands with 90% of registered voters turnout.
The three explanations have exhausted the causal pathways that connect educational attainment to voting. There are also other educational reasons including voters’ increased sense of efficacy, the strength of partisan, accompanying economic interests, and education-induced affluence (Doherty, Gerber, & Green, 2006). Therefore, the three experiments proved that education affects the rate of voter turnout during elections.
Data and Methods
Methods
The research methods include the type of research method research design and research approach used in doing the study.
Research Method
The type of research method used includes both qualitative and quantitative. Qualitative research methods provide insights into the research objective highlighted through textual data. A qualitative research method was used in the research. Therefore, the study will benefit from getting information regarding voter turnout in different ways and how various factors affected the rate of voter turnout. The quantitative research method is also used in the research to determine the extent to which various determinants affect voter turnouts.
Research Approach
The research used abductive approach. A researcher mainly uses abductive approacvh because it is flexible and free from the limitations of deductive and inductive reasoning and theories can be developed at any time (Żelechowska, Żyluk, and Urbański, 2020). Proper positioning of the research objectives is given by using abductive reasoning. Abductive reasoning will also give surprising facts about the voter turnout and the determinants that are discussed. Moreover the main advantage of abductive approach is that it treats the knowledge from the study as incomplete and request for further research to be conducted.
Research Design
The type of research design used in this study includes both descriptive research and correlational research. Descriptive research design is used in describing the various measures that affected the voter turnout and the appropriate improvement strategies that that be undertaken to increase voter turnout in the countries that do not advocate for compulsory voting (Siedlecki, 2020). Moreover, the descriptive research design is used in stating the current situation of the voter turnout on election days in the countries having voluntary voting. Correlational research design on the other hand will be used in determining the quantitative figures and how voter turnout is correlated between the determinants. Therefore, the correlational research design is used in determining the relationship that exists between the independent and dependent variables of the study. Correlation research design is also important in the study since determining the extent to which independent factors affect the dependent variable is essential in identifying the most important independent variable and the type of effect it has on the dependent variable.
Data
This includes the type of data collection procedures and also the data that will be used in the study to conduct the research. The data analyzed in this paper come from the 2020 American National Election Study and was analyzed using the SETUPS through the ICPSR website.
Data Collection Procedure
Secondary data collected by other researchers was used. Secondary data is economical and saves time during the undertaking of the research. Descriptive research design makes the researcher to adequately identify the trend in the determinants of voter turnout to be used in the research. The data was collected from American National Election Study and analyzed using SETUPS.
Research Variables
There are two variables in the study. The first variable is the dependent variable, which is voter turnout. Voter turnout is dependent on several determinants including education, socioeconomic factors, and whether there is compulsory voting or not. Therefore, the dependent variable depends on the independent variable. Socioeconomic factors, income classes, education, and government policies (compulsory voting) are independent variables affecting the rate of voter turnout.
My dependent variable is on voting behavior and related items. People were asked, “Did you vote in the 2020 general election?” The responses included 1040 people who did not vote 6407 people who voted while 6 people did not answer the question. This means that the number of people who voted was higher than those who did not vote in the 2020 general election.
Hypothesis Testing
Ho1: Education increases the level of voter turnout in the election?
Ho2: The economy will be better in the next 12 months due to the elections.
Ho3: People who often pay attention to politics and elections are more likely to vote.
Ho4: China poses great threat to the US.
Results
- Education increases the level of voter turnout
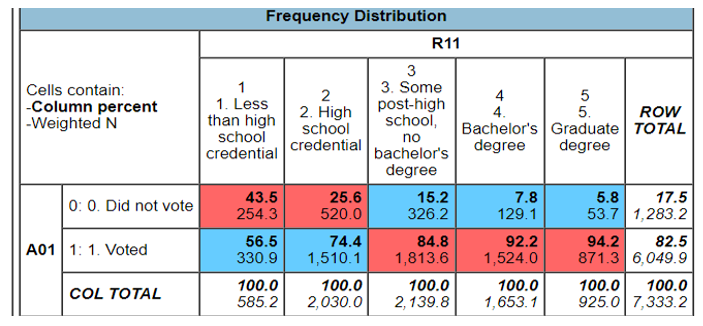
R11 represented the level of education of the population while A01 represented the number of people who voted in the 2020 general election. From the table, it is clear that the number of people who voted in the 2020 general election keeps increasing with an increase in the educational level. Only 56.5% of those having less than high school credentials voted, 74.4% of those having high school credentials voted, and 84.8% of high school post-graduate voted. 92.2% of those having degrees voted, and 94.2% of graduate degree voters voted in the 2020 general election. There is an upward trend in the percentage of people who voted in 2020 when the focus is put on education level.
- The economy will be better in the next 12 months due to the elections
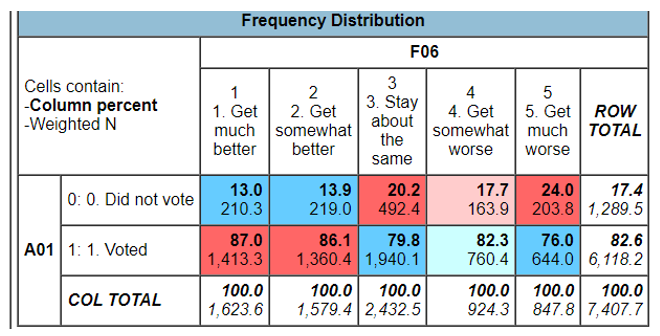
A01 represents those who voted while F06 represents their take on the country’s economy. 87% of those who voted stated that the economy will become much better after the election while 13% of those who did not vote also stated the same. However, the trend in this area had an upward effect with more people stating that the economy will become better after voting. 76% of those who voted stated that the country’s economy will get much worse while 79.8% stated that the economy will somehow stay about the same.
- People who often pay attention to politics and elections are more likely to vote.
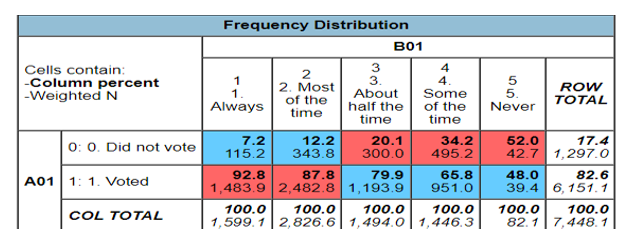
B01 represents those who often pay attention to politics and elections in the country. Approximately, 92.8% of the people who always paid attention to politics and elections voted in the 2020 general elections. The trend keeps on falling with only 48% of those people who never pay attention to politics and elections voting. The participants who only paid attention to politics half the time voted had a percentage of 79.9% voting in the 2020 general elections.
- How much is China’s threat to the USA
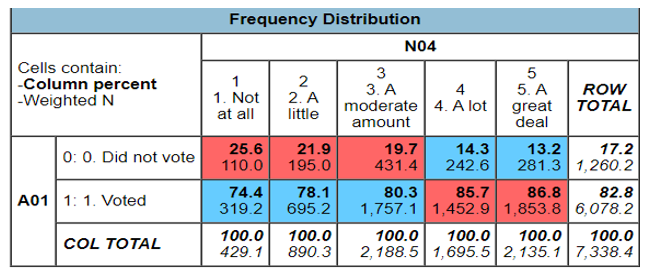
N04 represents the level of threat that China posed to the United States. 74.4% of the people who voted stated that China did not pose a threat to the US with only 25.6% of those who did not vote stating the same. However, 86.8% of those who voted stated that China presented a great deal of threat to the US. This means that a higher percentage of the voters who voted in the 2020 general elections saw China as a threat to the US and maybe their main reason for voting was to change the tide and see if the US could pose the same threat to China.
- How hopeful the people feel the country is going to be
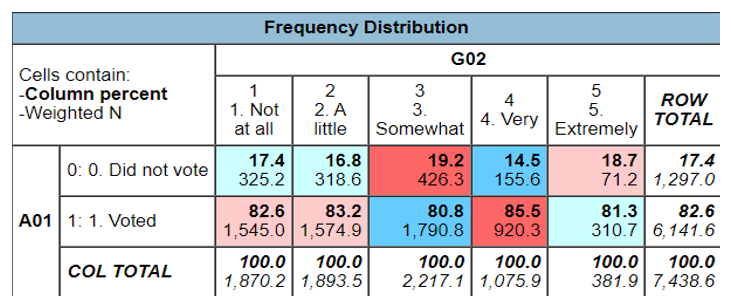
82.6% of those people who voted were not hopeful at all about the ideologies presented by both participants in the presidential race. However, 82.6% of the voters were highly hopeful of the ideologies represented by both candidates. This is the reason why most of the people voted in the 2020 general elections because of the political ideologies of the presidential candidates with the majority of them being good. The table below shows the percentage of people that voted for their presidential candidates because of their political ideologies.
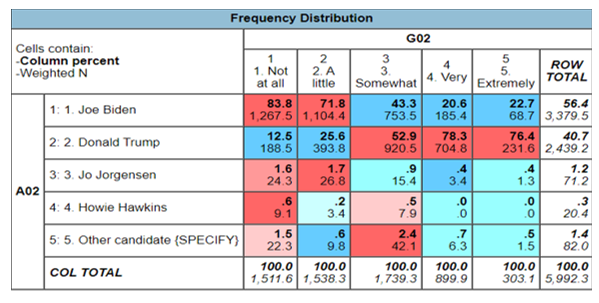
83.8% of those people who voted for Joe Biden were not hopeful at all of the political ideologies of the candidate. However, 22.7% of those who voted for Joe Biden were extremely hopeful that he would bring changes based on his political ideologies. Donald Trump has 12.5% of people voting for him as hopeful while 76.4% of those who voted for Donald Trump were not hopeful of his political ideologies. The trend shown in this determinant was a downward trend where more people were not hopeful of either of the presidential candidates and a larger proportion were not hopeful. However, they continued to vote for the respective presidential candidates.
Discussion
The level of education was the first determinant of voter turnout during election days. From the table, it is evident that the level of education greatly affects the rate of voter turnout during election days. The percentage of people having graduate degrees who voted in the 2020 general elections was 94.2%. This value continued to decrease as the level of education also decreased downwards. Only 56.5% of people having fewer credentials than high school credentials voted in the 2020 general elections. This implies that there is a direct positive relationship between the level of education and the voter turnout in the elections. A high level of education is therefore characterized by high voter turnout while a low level of education is characterized by a low voter turnout in the general elections.
The other determinant was the economic conditions of the country. The economic conditions of a country always depend on the type of leadership in the country. This is why many leaders will always be slammed when the economy of the country reduces during their tenure. From the table, it is evident that most people believed that the economy was going to get much better in the next 12 months after they have voted. The percentage of those who believed the economy would get better was 87% while those who believed the economy would get worse in the next 1 year was 76%. Therefore, there is a decreasing trend in the number of voters against the economic conditions of the country. There is a positive relationship between the economic condition of the country and the percentage of voters. More people voted to believe that the economy will get much better with the trend reducing. This is because lee people believed that the economy will get worse after voting, meaning that they voted for other reasons if they believed that the economy will get worse even after voting in the elections.
There was a high probability of those people often paying attention to politics in voting (92.8%). This means that those who always participated and took attention to the political events and elections voted with only 48% of those who were not interested in the political events voting. Therefore, the voter turnout was influenced by how much a person was invested in keeping up with the current political events in the country. There was also a positive relationship between paying attention to politics and the level of voter turnout. This means that high political attention led to high voter turnout while low political attention led to a low voter turnout in the elections. Political attention was influenced by the personality of the presidential candidates taking part in the elections.
Foreign policies also affected the rate at which people voted in the country. When asked about the extent of China’s threat to the US, 74.4% of those who voted stated that China did not pose any threat to the US government. However, the figures increased with a higher percentage of people (86.8%) of the people stating that China posed a great deal of threat to the US government. This means that there is a positive relationship between those who voted and foreign policy management. Therefore, this means that a high percentage of people voted to ensure that China did not pose a great deal of threat to the US. In other words, a higher population voted to increase the level of US involvement in the foreign policies than those who voted against foreign policies.
82.6% of those people who voted were not hopeful of any changes that may be made in the country with only 81.3% of the voters hopeful that the new administration will lead to hopeful policies. There is a downward trend meaning that there is a negative relationship between the ideological policies of the presidential candidates against voter turnout. The trend is negative because more people are not hopeful of the ideology items. Moreover, when individual presidential candidates were compared to the voter turnout, it was discovered that more people were not hopeful across all the candidates than the hopeful people. Joe Biden had only 22.7% of the voter turnout hopeful that his ideas were good. However, the percentage was even lesser in those who voted for Donald Trump, which was only 12.5% of the total voter turnout who voted for Trump. Therefore, there is a negative relationship between the political ideologies and the voter turnout of the registered voters.
Conclusion
Voter turnout is affected by different factors ranging from foreign policies, level of education, the political ideologies of the candidates, economic conditions of the country, and the extent of political involvement and participation of the voters. All these determinants affect the rate of voter turnout in the country depending on their different perspective. Therefore, candidates should adequately sell their political ideologies that are believable to increase the rate of voter turnout. Emphasis should be made on education to ensure that the level of attainment of education is increased, which will make people increase their level of education. It will lead to more people taking part in voting. Due to the rate of voter turnout, it is only applicable if compulsory voting is introduced into the country because increasing the level of education in the country is expensive and time-consuming.
The possible limitation of the study was that some aspects were not taken into consideration. The issue of race was not taken into consideration since different races in the country have different notions and norms about political elections and the rate of voter turnout. The extent of voter turnout among the Blacks cannot be the same as the voter turnout percentage among the Whites, or even the Hispanics. Therefore, the issue of race also affects the extent of voter turnout and it was not addressed in the setups. Moreover, extensive research needs to be conducted on the taking of compulsory voting in the country to determine the number of people advocating for it. Additionally, research needs to be done on why there is a negative relationship between the political ideologies of the candidates and the degree of voter turnout where many people do not believe in the political ideologies of the candidates and are not hopeful.
References
Conover, P.J., & Feldman, S. (1981). The origins and meaning of Liberal/Conservative self-identifications. American Journal of Political Science 25, 617-645
Erickson, R.S. & Tedin, K.L. (2005). American Public opinion. Routledge
Fowler, G.A. (2013). Five studies on the causes and consequences of voter turnout. Office for Scholarly Communication
Grillo, A. (2020). Essays in Political Economics: On the Determinants and Patterns of Voter Turnout (Doctoral dissertation).
Hill, H. (2006). Low voter turnout in the United States: Is compulsory voting a viable solution? Journal of Theoretical Politics 18 (2), 207-232
Lodge, H.C. & Powderly, T.V. (1890). The Federal Election Bill. The North American Review
Siedlecki, S. L. (2020). Understanding descriptive research designs and methods. Clinical Nurse Specialist, 34(1), 8-12.
Sondheimer, R.M., & Green, D. (2010). Using experiments to estimate the effects of education on voter turnout. American Journal of Political Science
Stockemer, D. (2016). Electoral participation: How to measure voter turnout? Springer Science
Żelechowska, D., Żyluk, N. and Urbański, M., 2020. Find out a new method to study abductive reasoning in empirical research. International Journal of Qualitative Methods, 19, p.1609406920909674.
 write
write