Differentiating Data Types
The main goal of income statement data is to look at the company’s performance. This helps people make smart choices for their business plans. Profit margin, a key measure in money numbers, shows how well businesses turn income into profit. For example, a big gross profit margin might mean good cost control. On the other hand, falling net profit margins might hint at possible problems in operations running or setting prices correctly. Money numbers help make choices about using resources, planning for buying stocks, and savings measures. By knowing money info, groups can make good choices that help with long-term cash stability (Mikalef et al.,2019). This kind of data gives valuable information about how an organization works daily. It can be used to check whether internal processes are working well. Examples of operation data include things made in production, measures for service delivery, and signs of how well the supply chain functions. Operations data helps improve processes, increase work output, and maintain company efficiency. A big number, cycle time, counts how long a certain job takes. Making things faster in factories makes them work better and deliver on time. This information backs up choices on improving things, sharing resources, and finding what is slowing everything down. Looking at work data helps make smart choices for smoother processes and better productivity.
Customer data helps measure and improve customer satisfaction, loyalty, and overall experience. This is done by looking at customer feedback and something called Net Promoter Scores (NPS), which also includes basic information about people, such as their age or where they live. The main goal of getting customer information is to see how well a business meets their needs and find ways to improve things. A big part of customer information is the Net Promoter Score. It tells how likely people are to suggest a company’s goods or services to others. For example, good NPS scores from an online store mean customers are happy and loyal. Information about customers is essential for making choices on developing products, marketing plans, and managing customer relationships.
Companies can make smart choices that improve happiness and grow lasting ties by carefully studying customer information. Imagine a picture combining money and business information with customer info to show the difference between these data sources. A bar chart with many layers can show how money from four parts of the year grows, where each bit shows income for different kinds of products (money details), the time it took to make every product and the happiness score that people have when they buy stuff during those quarters. These images help you understand quickly how things are going overall and find places to make them better in each part. It helps bosses see big pictures of data that’s hard to grasp and guide planning based on a full view of the organization’s performance. These data types are connected and essential for businesses that want to understand how they’re doing entirely. Data about money, work, and customers is vital to making smart choices. This helps companies to succeed. Combining and studying different data sources is necessary for dealing with difficulties, grabbing chances, and making a strong path.
Data Visualization Graphic
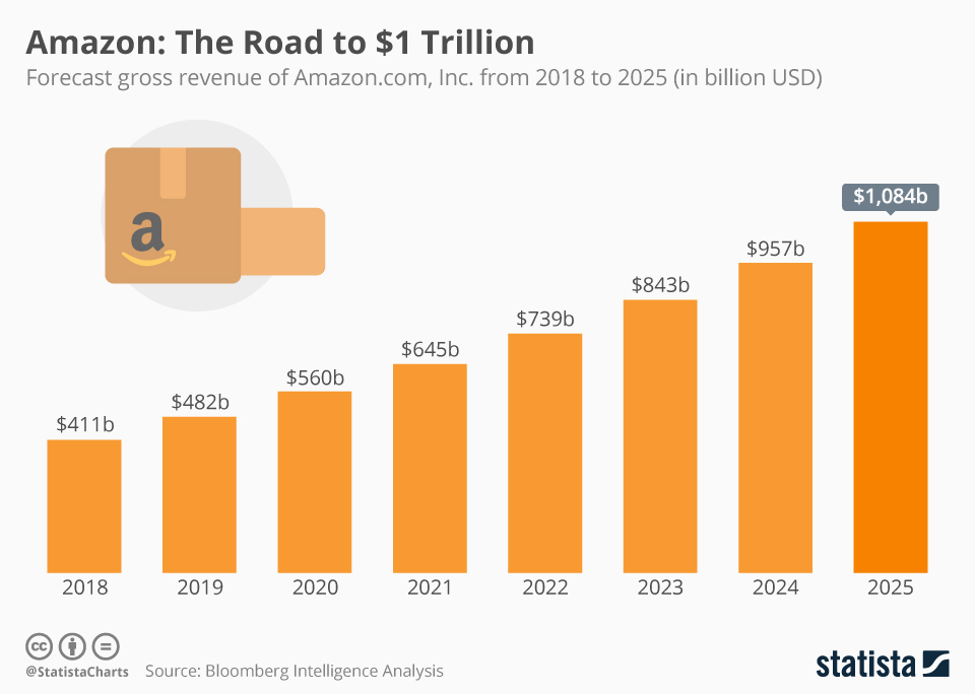
Typically, looking at the fast expansion and money skills, it is essential to see how amazing it was for Amazon to reach $1 trillion. Amazon, a big player in shopping online, always does better than others. It has left companies like Alibaba way behind. 2017, the company had a substantial net income of $177 million. This amount was much more than about $23 million made by its Asian competitor Alibaba. This money power was not just a one-time thing. It led to an even more amazing path for growth in the future. Bloomberg Intelligence Analysis, known for its smart guesses on the future, thinks that Amazon’s total money will jump to $330 billion. This prediction shows that the company’s growth has been consistent and strong. It is driven by its necessary plans and control over markets. Analysts found that one major cause is the world growth of Amazon Prime.
Furthermore, this move will help strengthen its place in all countries worldwide. As Amazon keeps making new and different items, the chance of getting a trillion dollars in total money by 2025 seems close. This big thing Amazon is about to do means more than just a symbol. It shows how successful and scary it has become for traditional stores trying hard to stay caught up. Jeff Bezos’ huge retail business, which has grown to one trillion dollars, shows how it makes money. Also, it causes worries for other businesses trying hard to match the changing world of shopping today. Amazon’s big operations and ability to catch trends make it the best in business. A picture showing data shows its fast-growing money, which is very different from others. The trip to a one trillion-dollar worth offers Amazon’s innovative thinking and new ideas and cannot be beaten power in internet shopping. It marks a vital money goal reached.
Benefits of Data Analysis Methods
Businesses use many ways to find important information in the busy world of studying data. They use two big methods: looking at what happened (descriptive analysis) and guessing future results (predictive analysis). A descriptive analysis method looks at main numbers to show how well things are doing. For example, consider a case where a store uses descriptive analysis to make reports every three months. The group looks at how it does by boiling money, business, and people information. Description study helps to see trends, patterns, and places for betterment. This way is usually used often, like every three months or once a year. It gives people who care about the company an idea of how it is doing at any given time. The good thing about descriptive analysis is that it can turn big data into simple ideas. This makes decision-making easier at different levels, like daily work and long-term planning. However, predictive analysis means guessing what will happen in the future using past information. This lets businesses prepare for possible situations before they even occur. To show how predictive analysis works, think about a factory that uses this method to guess what people will want. By looking at past sales records, up-to-date market changes, and things happening outside the business, it can guess how many people might want to buy its items in the future. This helps make smart choices about keeping track of stock, organizing production schedules, and deciding how to use resources (Ayala-Chauvin et al.,2023). Predictive analysis is constructive in jobs where demand changes a lot. It’s often used to manage supply chains. The good things about using predictive analysis are better planning, reducing dangers, and the chance to take advantage of new opportunities.
Both ways of analyzing data and describing and predicting results have unique benefits for a business. Descriptive analysis looks back at what has happened. It helps organizations see how they did in the past and make decisions based on older information. It’s beneficial for setting standards, finding exceptions, and creating a comparison base. However, predictive analysis brings a future-looking aspect to making decisions. By guessing what will happen and the possible results, businesses can plan to keep ahead of rivals. They also know how best to handle doubts or changes in the future. These techniques have been used in many different businesses in real-life business situations. For example, a big shopping company might use describing ways to check how well its worldwide stores are doing. The business learns about differences by looking at how much is sold, working well, and making customers happy in different areas. This helps them change their plans to match what folks like best there. In another case, a technology company that makes software may use predictive analysis to guess how many people will start using its new app.
The company can guess how much they will need in the future by looking at past use, what people say about it, and market changes. This way, they can arrange things effectively to meet those needs better. The decision between using descriptive or predictive analysis comes from your business issue. Descriptive analysis is best when we need a history of events, like looking at past results or finding areas to improve from old information. Predictive analysis is suitable when companies want to guess what will happen, think about possible future problems, and use new chances. For example, in planning for money management, a descriptive study might help measure how effective old-budget spending was. At the same time, forecasting or predictive analysis could guide decisions about future resource use by foreseeing possible market changes.
Justifying Strategic Choice
Making a decision based on looking at data is very important when you are deciding something. It aids us in creating smart and strong outcomes. A good example is using regression analysis to help make a big decision in marketing. Picture a case where a large internet shopping firm is considering altering its advertising method. Regression analysis can help a lot in finding out how much ad cost impacts sales growth. We should choose the best way to spend our ad money so we get big benefits from it. By checking past information with regression analysis, the team can use numbers to see how much money spent on ads changes sales. The method involves finding the important things like how much we spend on ads and growth in sales. We need to gather information from different times, too. Then, the regression model looks at the data. It gives numbers showing how strong and how a connection between variables is going on. A good number means a positive connection, indicating that more ad spending leads to higher sales. Using this number information, those in charge can explain why they should keep or raise their advertising budget to push sales growth.
This decision based on regression analysis is critical in fast-changing market situations where companies have limited money for advertising. They want to use their resources best so they get the biggest results. For instance, when introducing a new product or running advertisements, we can use regression analysis to help decide our spending on adverts so that we reach sales goals. The main reason is that regression analysis can help us know how marketing work affects sales. This allows for decisions made based on facts and data instead of guesswork. Another way we can prove a smart decision supported by data is by using product grouping through calculation in business retail. Here, the big choice is about making marketing plans just for certain groups of customers. This helps make everything work better in total. Clustering analysis helps an organization put customers into groups based on the same shopping habits, likes, and information about where they live. This shows different parts within their list of buyers (Saunders et al. 2019). The method includes getting and studying customer information, finding patterns, and grouping customers with the same qualities. These groups are parts of the customer group that have similar features. After groups are made, the company can show why its big plan is good by making sales campaigns to connect with what each part likes and needs. For example, if a group mostly has people who watch their money spending closely, then the marketing plan might focus on sale offers, price reductions, and highlights that show good value.
The reason to use clustering analysis is because it can find hidden customer groups that might be missed if we don’t look. When businesses focus their marketing on certain groups, they can make customers more interested, get higher conversion rates, and use money spent on marketing best. This smart decision matches the bigger aim of making marketing actions as effective as possible by uniquely dealing with special requirements for different customer groups. In real-life business situations, companies in various fields have made smart decisions using different ways of looking at data. For example, a big tech firm could use social media feeling study to help decide how they make products. When a company looks at what people like or dislike, they learn about their customers’ tastes. This helps them decide if tweaking old products or building new ones that meet the needs of those customers better is needed. Data analysis techniques are not only used to make marketing-related choices. In business management, companies could use time series analysis to improve how much inventory they have. The group can make smart choices about managing stock by looking at past sales info and guessing future demand. This makes sure products are there when customers want them.
Big Data’s Influence on Organizational Performance
Big data has changed how companies work. It gives them new chances to make decisions based on information. Big data can change how an organization operates in many areas because of its vast amount, quick speed, and different types. A good example of how big data affects us is through analyzing social media. Big data is crucial in understanding what people think, like, and do on social media. Imagine a big online shopping company that uses smart data tools to watch social media websites. The group can find out directly from people what they think of their products, how well marketing works, and what new things are happening in the market by looking at lots of stuff made by users. Analyzing feelings is a part of studying social media use that lets companies understand what people think about their brand. By figuring out the feelings and settings of social media talk about them, businesses can look at how people generally feel – good or bad. (Guru, 2023) For example, if a new product launch gets positive feedback on social media, the group can use that info to improve their marketing and take advantage of all the good talk.
Extensive data analysis helps companies find connections and patterns that might not be seen at first by using old-fashioned ways of looking at information. In our social media check-up example, smart computer programs could find hidden links between customer details like age, place of living, and buying choices. Big data analysis gives companies the power to adjust their products and services. This allows them to match what customers want as it changes over time. Big data affects how well an organization does, and it is about more than just marketing and customer relations. In managing supplies, big data analysis can improve items’ stock levels, improve logistics, and cut down costs in operations. Predictive analytics can guess how much people want. This lets companies plan their supply chain for future market trends. But, using a lot of data can be challenging. There are worries about privacy and safety, along with the need for special skills in understanding numbers well. Businesses must handle these problems to use big data and improve their performance. Even though there are some problems, big data dramatically affects how well organizations work. It gives unique knowledge and advantages for making critical future decisions.
Conclusion
Checking how well an organization is doing includes different kinds of data. They relate to its money, how well it works, and what customers think about it. These types of data help with big decisions. Presenting the information is very important to change raw numbers into understandable ideas that people can use. Tools that help us see things, like the money growth chart every three months, make it easy for people who care to understand big changes quickly. Data is a way of looking at information, like explaining past events, guessing future ones, showing what happened before, and talking about the upcoming stuff. This gives a good base for making plans in advance. Big data are changing organizational assessment with its large datasets and complex analysis. For example, social media analysis gives immediate information that helps shape marketing plans and product creation. But, joining big data brings problems like privacy and the need for better skills in numbers. Organizations need to think carefully about these problems if they want to use big data in a way that helps drive performance growth. In this age of making data-based decisions, it is essential to be flexible and creative for a great company. Different kinds of data, ways to show information, and methods for looking at it all together with lots of big data make a complete plan. This helps guide you through uncertainties while grabbing good chances in life or work. The future of how companies check their performance comes from always improving the use of data. This will help businesses change all the time in a world that never stops changing.
References
Ayala-Chauvin, M., Avilés-Castillo, F., & Buele, J. (2023). Exploring the Landscape of Data Analysis: A Review of Its Application and Impact in Ecuador. Computers, 12(7), 146. https://www.mdpi.com/2073-431X/12/7/146
Guru, S. K. (2023). Influence of Big Data Analytics on Business Intelligence. In Analytics Enabled Decision Making (pp. 45-58). Singapore: Springer Nature Singapore. https://elearningindustry.com/the-impact-of-big-data-analytics-on-business-decision-making#:~:text=Summary%3A%20Big%20Data%20analytics%20has,ahead%20in%20the%20competitive%20market.
Mikalef, P., Boura, M., Lekakos, G., & Krogstie, J. (2019). Big data analytics and firm performance: Findings from a mixed-method approach. Journal of Business Research, 98, 261-276. https://doi.org/10.1016/j.jbusres.2019.01.044
Saunders, M., Lewis, P., Thornhill, A., & Bristow, A. (2019, March 2). “Research Methods for Business Students” Chapter 4: Understanding research philosophy and approaches to theory development. ResearchGate.https://www.researchgate.net/publication/330760964_Research_Methods_for_Business_Students_Chapter_4_Understanding_research_philosophy_and_approaches_to_theory_development
 write
write