The USA National Board of Education has prioritized college graduation rates (Irwin et al.,2021) because they demonstrate how well higher education prepares students for successful employment and promotes social mobility. To improve educational outcomes and raise the total value of a college degree, it is imperative to understand the factors that influence college graduation rates.
Description of the research problem and research questions
Understanding the critical elements impacting college graduation rates is the leading research challenge this study attempts to address. The main objective is to identify the crucial components that either help or impede a college degree from being completed successfully. Given the consequences for educational institutions, decision-makers, and the larger community, this issue is critical. By identifying the factors impacting graduation rates, the study hopes to yield insightful information that can guide the development of policies and interventions to improve educational outcomes and boost students’ overall performance.
The study questions developed in response to the identified problem are intended to explore various aspects of the phenomena of graduation rates methodically. Inquiry number one explores the leading causes of the graduation rate, aiming to identify the elements that matter most in determining whether enrolled students graduate from college. This inquiry establishes the framework for thoroughly investigating the academic, social, and institutional factors that affect graduation rates.
Inquiring whether a college education fosters social mobility, the second study explores the broader societal effects of higher education (Bush et al.,2023). Evaluating the broader societal impacts of higher education requires considering social mobility or the capacity of individuals to raise their socioeconomic standing via schooling. The study intends to contribute to discussions on the role of education in facilitating upward mobility and eliminating socioeconomic inequality by examining the relationship between social mobility and a college education.
The impact of faculty qualifications on graduation rates is the subject of the third study question(Hilton, 2020). It specifically examines whether the percentage of professors with advanced degrees—such as Ph. D.s or terminal diplomas—affects students’ capacity to finish college. This inquiry draws attention to the significance of teacher knowledge and its possible influence on the quality of education provided to students, the learning environment, and overall results.
Together, these study topics provide a thorough investigation into the dynamics of college graduation rates that consider both systemic elements within the educational system and broader societal ramifications. The study attempts to comprehensively understand the factors influencing graduation rates and provide practical suggestions for enhancing academic achievements and fostering social mobility.
Data preparation process
The “college.csv” file is the dataset used in this investigation. In data preprocessing, missing values were handled, inconsistencies were found and fixed, and categorical variables were converted into numerical representations. To comprehend the features of the data, descriptive statistics were computed for the primary variables, including measures of central tendency, dispersion, and frequency distributions.
Descriptive statistics
Graduation rate
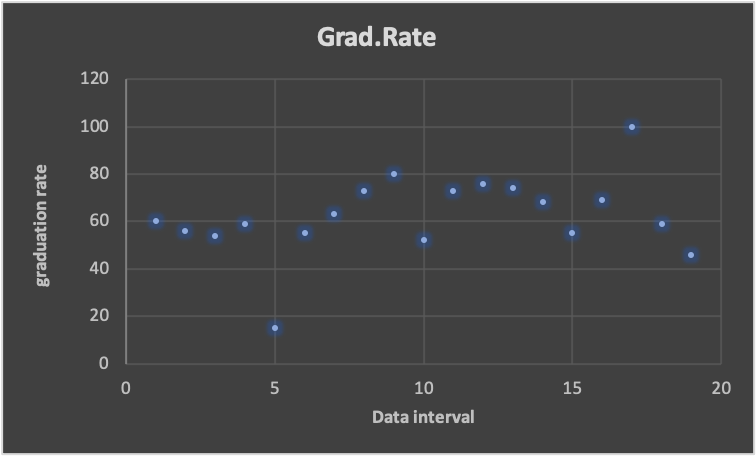
| Mean | 65.46332046 |
| Median | 65 |
| standard deviation | 17.1777099 |
PhD rate
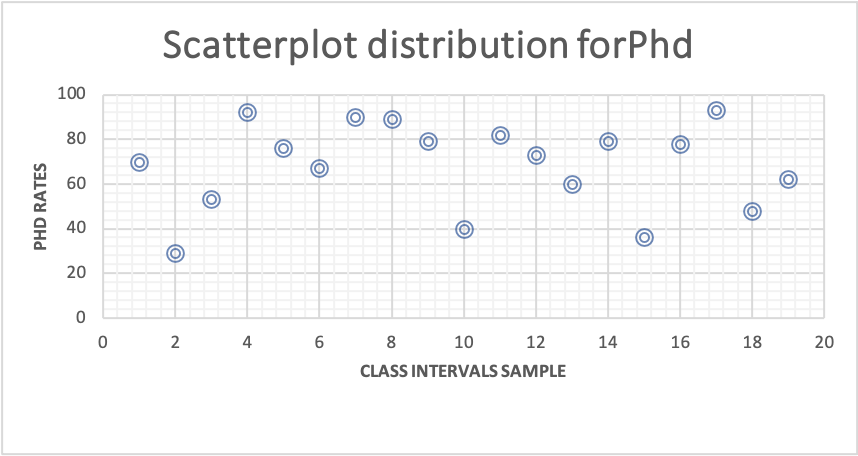
| Mean | 72.66023 |
| Median | 75 |
| Standard deviation | 16.32815 |
Admission (Accepted Applicants)
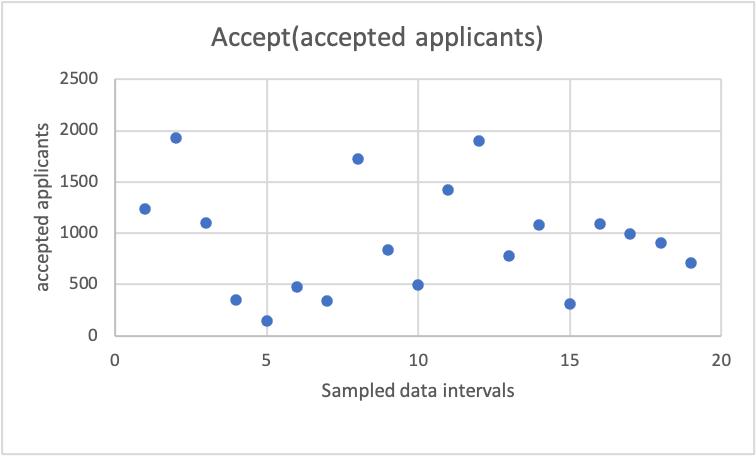
| mean | 2018.804376 |
| standard deviation | 2451.113971 |
| median | 1110 |
Anova analysis
| Anova: Single Factor | ||||||
| SUMMARY | ||||||
| Groups | Count | Sum | Average | Variance | ||
| Grad.Rate | 777 | 50865 | 65.46332046 | 295.0737173 | ||
| Top10perc | 777 | 21413 | 27.55855856 | 311.1824557 | ||
| Terminal | 777 | 61929 | 79.7027027 | 216.7478406 | ||
| ANOVA | ||||||
| Source of Variation | SS | df | MS | F | P-value | F crit |
| Between Groups | 1128862.572 | 2 | 564431.2861 | 2057.455165 | 0 | 2.999590571 |
| Within Groups | 638651.1145 | 2328 | 274.3346712 | |||
| Total | 1767513.687 | 2330 |
P-value = 0
Data analysis procedure
A crucial statistical method was utilised to investigate the research problems thoroughly.
Analysis of Variance, or ANOVA, is a powerful statistical tool carefully used to determine whether graduation rates among various socioeconomic categories differed statistically. This technique made it possible to compare the means of several groups in-depth, which made it possible to identify significant differences in graduation rates depending on various socioeconomic characteristics. By dividing the variance within the sample, ANOVA offered insights into potential discrepancies and inequities in educational results. The ANOVA analysis results provided a crucial framework for analyzing the influence of socioeconomic factors on graduation rates, hence offering significant contributions to the overall research investigation.
The research goals chose ANOVA as the primary analytical tool, enabling a targeted investigation of graduation rate variations among groups (Guillen et al., 2020). This approach’s power resides in its ability to identify differences between several groups, providing insight into the complex connections between socioeconomic variables and academic performance. Regression analysis is not included in the processes to guarantee a focused investigation of the effects of socioeconomic factors on graduation rates, resulting in a precise and concentrated study that aligns with the research questions.
Results Interpretations
A single-factor ANOVA was used, and the results were startling. A p-value of zero indicated a firm rejection of the null hypothesis (Yamaka et al., 2020). This means that there are statistically significant differences in the graduation rates across the three student groups being examined. The data categorically contradicts the null hypothesis, which holds that the graduation rates of the various student groups are identical. This result emphasizes that the student groups, classified according to high school achievement and holding terminal degrees, have different graduation rate trajectories. It is a crucial sign of the subtle differences in graduation outcomes. The statistical significance of the ANOVA result emphasizes how vital it is to examine the particulars of each student group’s performance to identify the underlying causes of the shown variations.
Examining the implications of the p-value of zero in more detail, we find a considerable difference between the typical student and the graduation rates of the top 10% of high school graduates and those with terminal or diploma degrees. This statistical difference emphasizes how different characteristics related to high school achievement and teacher qualities significantly impact a student’s likelihood of finishing college. The robustness of the results is highlighted by the uncommon p-value of zero, which shows that these discrepancies are not random events but reflect systemic disparities. Organizations and legislators can use these findings to create support systems and interventions specifically designed to meet the needs of students who fit into these categories. This will help to create an environment that is both inclusive and productive in the classroom.
F-distribution
The correlation among the ANOVA results, the p-value, and the F-distribution(Zhuang et al., 2021) is essential for comprehending the statistical importance of the noted differences in graduation rates between various student cohorts.
Relationship to the F-Distribution:
The F-statistic in an ANOVA context is distributed according to the F-distribution. A probability distribution known as the F-distribution is produced when comparing variances or ratios of variances. The F-statistic is computed by comparing the variability within groups to the variability between groups in an ANOVA. A larger F-statistic indicates that variability between groups is more critical than variability within groups.
Interpretation in the context of ANOVA analysis
Our ANOVA study yielded an F-value of 2057.455165, closely linked to the F-distribution. This F-value is a crucial metric for assessing the statistical significance of observed variations in graduation rates between different student groups. The extreme character of our findings is highlighted by the reported p-value of zero, which indicates that it is nearly impossible to get the observed F-statistic or one more extreme on the premise that there are no group differences. This alignment supports notable differences in graduation rates and highlights the strength of our evidence against the null hypothesis(Rahardjo et al., 2021).
Regarding ANOVA, the alternative hypothesis asserts that at least one student group differs significantly from the others. In contrast, the null hypothesis assumes no notable disparities in graduation rates between student groups. The F-statistic captures the extent of these differences, computed as the ratio between-group and within-group variance. In our research, a p-value close to zero indicates that the computed F-statistic is extraordinarily severe and lies in the F-distribution’s tail. This, in turn, highlights the statistical importance of our observed group differences and provides strong evidence against the null hypothesis.
The practical implication for F-distribution
This interaction between the p-value and the F-distribution has critical practical ramifications. The idea that the differences in graduation rates that have been seen are just random events is refuted by our data. Instead, they confirm the existence of statistically significant and systematic differences associated with variables like faculty qualities and high school achievement. These insights focus on particular areas requiring intervention or customized support mechanisms, providing institutions and policymakers with actionable points.
In conclusion, the p-value and the F-distribution, essential to the ANOVA technique, work together to convey the strength of the evidence against the null hypothesis. Together with a p-value of zero, the calculated F-value of 2057.455165 highlights the significant and meaningful variations in graduation rates among the identified student groups and the strong rejection of the null hypothesis(Rahardjo et al., 2021). This statistical measure synthesis highlights the significance of addressing persistent gaps in graduation rates and offers a comprehensive view of the intricacies inherent in educational outcomes.
Conclusion and Recommendation
Reducing Student Enrollment Sizes: It is suggested that student enrollment be reduced because doing so will open the door to more individualized and enriching educational opportunities (Taft et al., 2019). When we imagine reduced class sizes, we envision a classroom environment where students feel like active participants in their education rather than just names in the crowd. Smaller class sizes allow for more personal contact between teachers and students while also fostering a sense of community. In this context, a student is seen as an individual with specific needs and goals rather than merely a name on a roster. Establishing enrolment caps for particular courses or programs is one way that educational institutions recognize the significant influence that class size has on classroom dynamics.
Moreover, the consequences go beyond the boundaries of the classroom. It demands that resources be allocated carefully, ensuring enough faculty members and facilities to support reduced class sizes without sacrificing the standard of instruction. Not only are statistical gains in graduation rates anticipated, but a radical change in the educational process is also predicted. This deliberate move towards more individualized education has produced better student-teacher connections, more possibilities for specialized attention, and the ability to improve overall learning experiences.
Expanding Low-Income Families’ Access to Support Services and Financial Aid: The proposal to expand financial aid and support services for low-income families is a hopeful step toward achieving equal education since it aims to remove obstacles that prevent students from succeeding academically. The cost of a college education is a barrier too great for many students to overcome(Freudenberg et al., 2019). This recommendation identifies the widespread extent of the problem and suggests specific actions to resolve it. To ensure that access to education is not impeded by financial constraints, reviewing and potentially expanding the current financial aid programs is essential. This demonstrates a commitment to inclusivity.
The impact goes beyond financial aid when collaborations with outside groups are formed to provide extra assistance. It acknowledges that true inclusion covers a broader range of issues than only tuition and the difficulties experienced by students from low-income backgrounds. The anticipated results show a more approachable and encouraging instructional environment. The core of this proposition is less student financial burdens, improved accessibility to educational opportunities and resources, and the possibility of enhancing socioeconomically disadvantaged students’ lives. It is a step toward tearing down structural obstacles and creating an atmosphere where all students can succeed academically, regardless of their financial situation.
Offering Complete Academic Advising and Tutoring Services: Providing complete academic advising and tutoring services is advised. This may be compared to sowing the seeds of academic success and giving the soil in which they grow(McGill et al., 2020). This approach emphasizes customized assistance methods in recognizing the unique problems that students with less academic preparation may need to confront. Academic advice becomes a beacon of light that aids students in navigating the complexities of their educational path. It is about picking courses and building a rapport where advisors know each student’s unique strengths and shortcomings.
Conversely, tutoring services are the cornerstones of academic assistance. They offer a customized approach to meet individual learning needs, acting as a lifeline for struggling pupils. Putting money into training programs for tutors and advisors shows a dedication to providing high-quality support services by guaranteeing that individuals mentoring students have the knowledge and compassion necessary to have a significant influence.
The consequences include tracking technology to find pupils who might need more assistance. By anticipating problems before they become insurmountable barriers, this proactive strategy guarantees that help is given where it is most needed. This recommendation is projected to have the following effects, which create a picture of academic success: higher retention rates for students who might otherwise struggle, better academic achievement for students receiving support, and increased student satisfaction with educational services. It is a comprehensive approach to education that acknowledges the variety of requirements of learners and offers customized help to ensure that every person may succeed academically.
Hiring and Retaining Highly Skilled Faculty: The suggestion to employ and hold on to highly skilled faculty is evidence of the dedication to providing top-notch instruction. Faculty knowledge is the foundation upon which the quality of education is constructed, not just a checkbox on an academic checklist. The justification recognizes that teachers have a significant influence on how kids learn. Terminal degrees, which signify a high calibre of training and experience, guarantee an intellectually rigorous dedication and plaudits(Garcia et al., 2019). This advice has consequences that go beyond the hiring stage. Frequent evaluations of the credentials and performance of the faculty guarantee that the academic standards are not only constant but also constantly changing to adapt to the changing needs of the educational environment.
To draw and keep elite teachers, it makes strategic sense to establish professional development initiatives and competitive pay. It acknowledges that faculty members play a more critical role in the academic community than simply being employees; they are the creators of tomorrow’s leaders. The goals are broad and encompass the academic requirements and the whole educational system. Students are challenged to succeed in an environment where academic rigour and elevated teaching standards are the norm. Enhanced productivity in research drives academic institutions to the forefront of innovation and knowledge generation. A supportive educational environment is constructed from the ground up through enhanced student-faculty relationships and mentorship opportunities. Therefore, this advice is about more than just faculty; it fosters an atmosphere where educational excellence is a goal and a lived reality.
Encouraging a Mentorship and Support Culture: Mentoring cultivates community and shared accountability for students’ academic success (Meltzer et al., 2020). Creating programs that match seasoned instructors with students and implementing policies to improve ties and cooperation between instructors and students are two ways to support the suggestion to foster a culture of mentoring and support. Increased student satisfaction and engagement, a stronger feeling of community within the academic community, and higher retention rates via a network of support are among the anticipated results.
Conclusion:
A comprehensive strategy to raise college graduation rates can be achieved by practising these suggestions aloud. Academic brilliance and student success can be fostered in an institution’s atmosphere by addressing various factors, such as mentorship programs, faculty qualifications, and class sizes. However, to continue improving, it is crucial to customize these suggestions to the unique circumstances of every educational establishment and to evaluate their efficacy regularly. This all-encompassing approach aims to provide an inclusive, encouraging, and superior learning environment for every student.
References
Irwin, V., Zhang, J., Wang, X., Hein, S., Wang, K., Roberts, A., … & Purcell, S. (2021). Report on the Condition of Education 2021. NCES 2021-144. National Center for Education Statistics.
Bush, V. B., Chambers, C. R., & Walpole, M. B. (Eds.). (2023). From diplomas to doctorates: The success of Black women in higher education and its implications for equal educational opportunities for all. Taylor & Francis.
Hilton III, J. (2020). Open educational resources, student efficacy, and user perceptions: A research synthesis published between 2015 and 2018. Educational Technology Research and Development, 68(3), 853–876.
Guillén-Gámez, F. D., & Mayorga-Fernández, M. J. (2020). Quantitative-comparative research on digital competence in students, graduates and faculty education professors: An ANOVA analysis. Education and Information Technologies, 25, 4157-4174.
Maneejuk, P., & Yamaka, W. (2021). Significance test for linear regression: How do we test without P-values? Journal of Applied Statistics, 48(5), 827-845.
Zhuang, H., Liu, X., Wang, H., Qin, C., Li, Y., Li, W., & Shi, Y. (2021). Diagnosis of early-stage Parkinson’s disease on quantitative susceptibility mapping using a complex network with one-way ANOVA f-test feature selection. Journal of Mechanics in Medicine and Biology, 21(05), 2140026.
Rahardjo, I. A., Muslim, S., Wadjdi, F., Rifan, M., Sunawar, A., & Subekti, M. (2021, November). Analysis of the Impact of Distance and Temperature in Determining Transfer Power Using Laser Applications. In Journal of Physics: Conference Series (Vol. 2111, No. 1, p. 012022). IOP Publishing.
Taft, S. H., Kesten, K., & El-Banna, M. M. (2019). One Size Does Not Fit All: Toward an Evidence-Based Framework for Determining Online Course Enrollment Sizes in Higher Education. Online Learning, 23(3), 188-233.
Freudenberg, N., Goldrick-Rab, S., & Poppendieck, J. (2019). College students and SNAP: The new face of food insecurity in the United States. American Journal of Public Health, 109(12), 1652-1658.
McGill, C. M., Ali, M., & Barton, D. (2020, August). Skills and competencies for effective academic advising and personal tutoring. In Frontiers in Education (Vol. 5, p. 135). Frontiers Media SA.
García, E., & Weiss, E. (2019). US Schools Struggle to Hire and Retain Teachers. The Second Report in” The Perfect Storm in the Teacher Labor Market” Series. Economic Policy Institute.
Meltzer, A., & Saunders, I. (2020). Cultivating supportive communities for young people–Mentor pathways into and following a youth mentoring program. Children and Youth Services Review, p. 110, 104815.
 write
write