Introduction
Investors participate in the financial markets seeking a payout in terms of capital gain, dividends, or firm possession, according to Suhadak (2019). A return would be considered as the variation in price of any underlying security, investment, or initiative across time, measured as the percentage variation or as a change in the price. Positive returns are preferred since they indicate a profit, whereas negative returns indicate a loss. Traders expect a return on its investment in most cases, although this is rarely assured. The anticipated rate of return is the profitability that a trader expects from an acquisition with known historic rates of return (RoR). In well-known variants of modern portfolio theory (MPT) as well as the Black-Scholes options pricing model, the anticipated market return is typically a significant element of both corporate activities and financial theory. The capital asset pricing model is one of the finest and most used ways to determine the projected return of a company’s shares (CAPM). Facebook is one of the fastest-growing firms, thanks to its virtual reality usage. Investors are buying the company’s shares because they expect a favorable return on their investment. The purpose of this research is to examine and assess the predicted return on Facebook’s shares. It will be feasible to establish if the company’s stock return was overpriced or undervalued based on the report’s evaluations.
The Facebook company which is currently known as Meta technology, is a popular online social networking platform where users can establish accounts, publish content regarding themselves such like images and quotations, and reply to or connect to material disseminated by others. The business was established in 2004. Since then, it has developed into an international trend with over 750 million subscribers, with over 70% of them coming from beyond the United States. The firm thinks that more connectivity between individuals via their site would lead to improved comprehension across divergent groups, as part of their purpose to offer individuals the opportunity to exchange as well as build a transparent and interconnected global community. In February 2012, Facebook filed an application of becoming a public company. It acquired $16 billion in its initial public offering (IPO) in May, offering it a market value of $102.4 billion. The prime IPO of an Internet enterprise till date was Google Inc. that generated $1.9 billion after its initial public offering (IPO) in 2004. (Hall, 2021). By the end of the first day of trade, the stock holdings for Zuckerberg were treasured at a higher value than $19 billion. Facebook publicized in October 2021 that its holding company would be rebranded Meta Platforms. The new name relates to a focus on the “metaverse,” a virtual reality area where consumers can engage with one another.
CAPM
The capital asset pricing model (CAPM) is a simplified description of financial markets price assets and, as a result, forecast predicted capital returns. The model grants a framework for evaluating risks and transforming them into estimates of expected return on capital. The framework shows the relationship among both systematic risk and asset expected returns, primarily for equities. There are two sorts of risk: unsystematic risk, which is unique to the organization and can be diversifiable, and systematic risk, which is non-diversifiable and hence unavoidable because it is linked to stock market movement. Because diversification can eliminate or minimize unsystematic risk, CAPM solely considers systematic risk, which is quantified by a corporation’s beta estimates. The formula to calculate the expected return on a company stock is as shown below:
![]()
Where:
![]() = The expected return of the company’s stock.
= The expected return of the company’s stock.
Rf = The risk-free rate measured from treasury securities.
Rm = the expected market return on the stock as a whole.
β s = the beta estimate of the underlying stock.
Beta Estimate
The conservative CAPM measurement of systematic risks is beta. It is a metric indicating the prospect of a security’s returns moving in lockstep with the equity market’s total return. According to Nickolas (2021), beta coefficient is a metric of a stock portfolio or an investment’s instability or systematic risks in relation to the broader industry. Beta may be alleged of as a degree of an asset’s fluctuation in comparison to the industry’s variability. A corporation possessing a beta estimate of 1.00, or an acceptable standard of systematic risk, goes up and down in lockstep with a comprehensive market index just like the Standard & Poor’s 500-stock index.
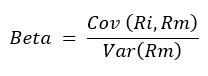
Corporations’ shares with a beta estimate larger than 1 tend to possess a higher degree of systematic risks and are further prone to market movements as compared to the industry as a whole (Kenton, 2021). A corporation’s stock with a beta estimate lower than 1.00, on the other hand, seems to have a low degree of systematic risks and thus it is less susceptible to market movements. When beta equals 1, the stock’s variability and riskiness are the same as the broader industry. The formula for calculating beta is as follows:
Where:
![]() = Covariance between return on risky asset and return on market
= Covariance between return on risky asset and return on market
![]() = Variance of return on market.
= Variance of return on market.
According to the data from Yahoo Finance, the 5-year (monthly) beta estimate for Facebook was 1.28 in 2020 (Yahoo, 2020).
Fisk free rate
The Risk-Free Rate is often considered as the hypothetical rate of return on capital expected on zero-risk securities that operates as the needed baseline rate of return on speculative assets. As the extent of the projected cash streams, the rate would denote the YTM (yield to maturity on default-free treasury securities of comparable maturity. The U.S. risk-free rate declined from 3.0% in 2019 to 2.5% in 2020 (Nunes and Harrington, 2020).
Market return
The yearly aggregate share market index expansion rate is referred to as stock market return. The aggregate of the everyday equity market indices accessible at Bloomberg is used to create the yearly averaging equity market indices. From 2020, the anticipated yearly expected rate of return for particularly large capitalization equities in the United States that should be utilized in combination with the risk-free rate is 6.6% (Nunes and Harrington, 2020; Perianan, 2021).
Using the CAPM, Facebook expected stock return is computed as shown below:
| FY2020 | |
| Risk-free rate (%) | 2.5% |
| Beta | 1.28 |
| Expected return on market (%) | 6.6% |
| Market risk premium (%) | 4.1% |
| Expected Stock return (%) | 7.748% |
Table 1. Expected return 2020 FY
Conclusion
After calculating the expected return using the CAPM, it is important to assess whether Facebook stock value is undervalued or overvalued. If the expected return in market is greater than ![]() of CAPM, the stock is undervalued. However, if the expected return in market is less than
of CAPM, the stock is undervalued. However, if the expected return in market is less than ![]() of CAPM, the stock is overvalued. Based on the data of Facebook above, the expected market return are all less than Facebook stock market return, hence the Facebook stocks are considered as overvalued in 2020. Whenever a asset is deemed as overpriced, it is considered to be trading at a greater price in the market than its true value. According to Warren Buffett’s value investment method, buying companies when they are inexpensive is a critical factor (Knezovic, 2021). As a result, investors should not consider buying Facebook stocks, since an overvalued stock is much riskier.
of CAPM, the stock is overvalued. Based on the data of Facebook above, the expected market return are all less than Facebook stock market return, hence the Facebook stocks are considered as overvalued in 2020. Whenever a asset is deemed as overpriced, it is considered to be trading at a greater price in the market than its true value. According to Warren Buffett’s value investment method, buying companies when they are inexpensive is a critical factor (Knezovic, 2021). As a result, investors should not consider buying Facebook stocks, since an overvalued stock is much riskier.
References
Chen, J., 2021. What Is Expected Return?. [online] Investopedia. Available at: <https://www.investopedia.com/terms/e/expectedreturn.asp> [Accessed 18 January 2022].
Kenton, W., 2021. Beta. [Online] Available at: https://www.investopedia.com/terms/b/beta.asp [Accessed 18 January 2022].
Knezović, M., 2021. Warren Buffet’s Investing Strategy (Doctoral dissertation, University of Zagreb. Faculty of Economics and Business. Department of Mathematics).
Nickolas, S., 2021. The Formula for Calculating Beta. [Online] Available at: https://www.investopedia.com/ask/answers/070615/what-formula-calculatingbeta.asp [Accessed 18 January 2022].
Nunes, C. and Harrington, J., 2020. U.S. Normalized Risk-Free Rate Lowered from 3.0% to 2.5%, Effective June 30, 2020 | Cost of Capital | Duff & Phelps. [online] Duff & Phelps. Available at: <https://www.duffandphelps.com/insights/publications/cost-of-capital/us-normalized-risk-free-rate-lowered-june-30-2020> [Accessed 18 January 2022].
Perianan, V., 2021. Why Market Returns May Be Lower and Global Diversification More Important in the Future. [online] Schwab Brokerage. Available at: <https://www.schwab.com/resource-center/insights/content/why-market-returns-may-be-lower-in-the-future> [Accessed 18 January 2022].
Suhadak, S., 2019. Stock return and financial performance as moderation variable in influence of good corporate governance towards corporate value | Emerald Insight. [online] Emerald.com. Available at: <https://www.emerald.com/insight/content/doi/10.1108/AJAR-07-2018-0021/full/html> [Accessed 18 January 2022].
 write
write