Introduction
The birth and survival of new companies are one of the major determinants of economic growth and prosperity, among others factors (Cegeilka, 2020). The birth and survival of a business itself depend upon several factors, including the availability of resources, availability of necessary infrastructures, customers’ preferences and their expenditure pattern, regional policy and environment, culture and tradition and many more (Brixy and Grotz, 2007). Spatial differences in the birth and survival of business are significantly observed in most countries. Here, in this paper, we have tried to investigate the birth and survival of companies over the past five years, from 2015 to 2019. Yearly data on birth and survival is collected from different regions of the UK – North East, North West, Yorkshire and the Humber, East Midlands, West Midlands, East, London etc. The research questions we need to investigate are as follows:
- Does the mean number of births of enterprises in a region significantly differs over the past five years?
- Does the mean number of 1-year survival of enterprises in a region significantly differs over the past five years?
- Does the mean number of enterprises that survived for 1, 2, 3, 4 and 5 years differ significantly?
Methodology
The analysis is based on secondary data, and hence, the data on a number of firms born and survived for the next five years in different regions of the UK are collected from the Office of National Statistics, UK, under the head – Business Demography, UK. Data has been collected for the past five years, from 2015 to 2019. We have data on the born of new enterprises for all five years (2015 to 2019) and data on the number of survived enterprises in the year 2015 for the next five years, i.e., till 2019. The data looks like in the given tables.
Table 1: Region-wise no. of enterprises born
| Region | 2015 | 2016 | 2017 | 2018 | 2019 |
| North East | 9,635 | 10,180 | 9,495 | 9,440 | 9,795 |
| North West | 36,495 | 42,030 | 44,730 | 39,140 | 39,210 |
| Yorkshire and The Humber | 25,140 | 26,775 | 22,600 | 23,110 | 24,570 |
| East Midlands | 25,345 | 24,630 | 22,385 | 22,770 | 24,370 |
| West Midlands | 29,350 | 34,700 | 30,685 | 30,835 | 36,005 |
| East | 35,440 | 45,400 | 36,685 | 35,685 | 36,040 |
| London | 1,00,920 | 1,02,135 | 91,885 | 93,895 | 99,545 |
| South East | 55,590 | 55,955 | 51,580 | 52,330 | 54,795 |
| South West | 26,150 | 31,775 | 25,235 | 24,100 | 25,350 |
| Wales | 11,525 | 12,115 | 12,705 | 12,385 | 12,260 |
| Scotland | 21,725 | 22,270 | 20,770 | 20,575 | 21,665 |
| Northern Ireland | 5,440 | 5,935 | 6,850 | 5,900 | 6,625 |
| Total | 3,82,755 | 4,13,900 | 3,75,605 | 3,70,165 | 3,90,230 |
Table 2: Region wise no. of enterprises survived for 1 year
| Region | 2015 | 2016 | 2017 | 2018 | 2019 |
| North East | 8,865 | 9,410 | 8,545 | 8,610 | 8,910 |
| North West | 33,090 | 38,545 | 40,120 | 34,645 | 34,710 |
| Yorkshire and The Humber | 22,810 | 24,545 | 20,155 | 20,895 | 22,160 |
| East Midlands | 23,375 | 22,820 | 20,330 | 20,750 | 22,035 |
| West Midlands | 26,665 | 32,040 | 27,705 | 27,805 | 32,855 |
| East | 32,425 | 42,510 | 33,020 | 32,275 | 32,415 |
| London | 87,240 | 91,720 | 80,150 | 81,795 | 83,680 |
| South East | 50,390 | 51,250 | 46,460 | 47,280 | 49,010 |
| South West | 23,830 | 29,250 | 22,160 | 21,695 | 22,785 |
| Wales | 10,470 | 11,125 | 11,495 | 11,065 | 11,130 |
| Scotland | 19,565 | 20,425 | 18,645 | 18,695 | 19,605 |
| Northern Ireland | 4,795 | 5,250 | 6,005 | 5,155 | 5,330 |
| Total | 3,43,520 | 3,78,890 | 3,34,790 | 3,30,665 | 3,44,620 |
Table 3: Region wise no. of enterprises survived for next 5 years in 2015.
| Region | 1-year survival | 2-year survival | 3-year survival | 4-year survival | 5-year survival |
| North East | 8,865 | 6,895 | 5,275 | 4,310 | 3,690 |
| North West | 33,090 | 25,835 | 19,935 | 16,500 | 14,130 |
| Yorkshire and The Humber | 22,810 | 18,055 | 13,950 | 11,650 | 10,000 |
| East Midlands | 23,375 | 18,855 | 13,520 | 11,090 | 9,590 |
| West Midlands | 26,665 | 21,330 | 16,405 | 13,260 | 11,310 |
| East | 32,425 | 26,050 | 20,560 | 17,270 | 14,895 |
| London | 87,240 | 68,775 | 52,235 | 43,180 | 37,020 |
| South East | 50,390 | 40,585 | 32,470 | 27,455 | 23,680 |
| South West | 23,830 | 19,190 | 15,540 | 13,230 | 11,580 |
| Wales | 10,470 | 8,190 | 6,445 | 5,405 | 4,655 |
| Scotland | 19,565 | 15,480 | 12,070 | 10,020 | 8,570 |
| Northern Ireland | 4,795 | 3,795 | 3,090 | 2,695 | 2,380 |
| Total | 3,43,520 | 2,73,035 | 2,11,495 | 1,76,065 | 1,51,500 |
To answer all the three research questions, the Analysis of variance (ANOVA) tool is used. ANOVA is one of the most reliable and frequently used tools to determine where the means of different groups significantly differ. The analyses are carried on in Excel, and the results are interpreted in this report under different subsections.
Calculations and Graphs
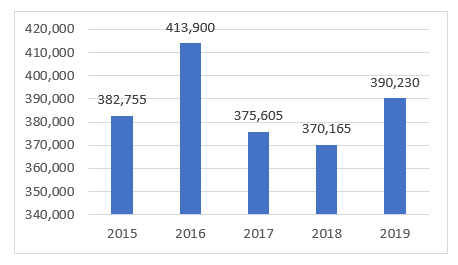
Graph 1 shows the total number of enterprises born over the past five years.
Graph 1: Total number of enterprises born
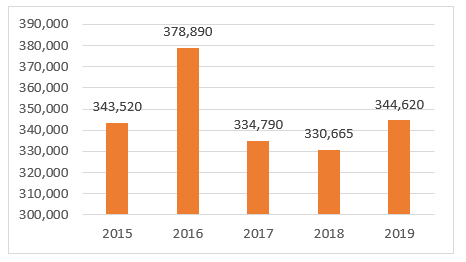
Graph 2 shows the total number of enterprises that survived for the next one year over the past five years.
Graph 2: Total number of enterprises survived for next one year
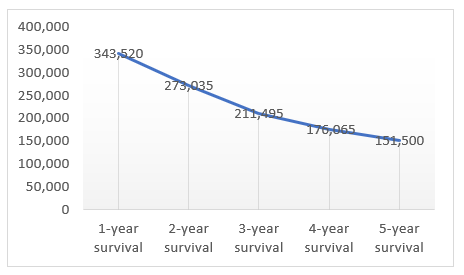
Graph 3 shows the total number of enterprises that survived for the next five years.
Graph 3: Total number of enterprises that survived for the next five year
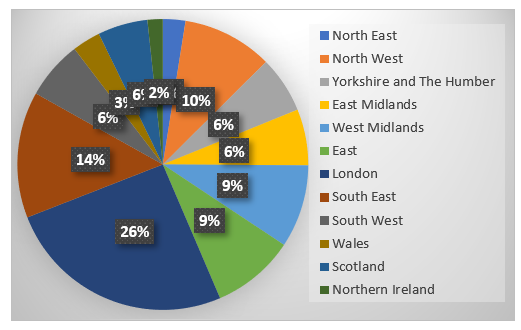
Graph 4 shows the percentage of enterprises born in 2019 region-wise.
Graph 4: Region-wise enterprise born: 2019
ANOVA result
The ANOVA results for all three research questions are given in table 4 below.
Table 4: ANOVA output
| F statistic | P-value | F Critical | |
| Born of enterprises | 0.0394 | 0.9970 | 2.5397 |
| The 1-year survival of enterprises | 0.0645 | 0.9921 | 2.5397 |
| survival for the next five years | 2.1035 | 0.0927 | 2.5397 |
Analysis of data
The highest number of enterprises was born in the year 2016, when 413,900 enterprises were born in 2016, followed by 390,230 enterprises in the year 2019 and 382,755 enterprises in the year 2015. Hence, the year 2016 is provided to be the most productive for a newborn of enterprises. Survival for the next year also shows a similar trend. The year 2016 witnessed 378,890 enterprises survive the next year, followed by 344,620 enterprises in 2019 and 343,520 in 2015. If we look at the trend of survival of enterprises over the next five years, we would observe that such trend is downward and the numbers of enterprises are getting reduced by passing of years. Around 343,520 enterprises survived in 2016, but this number gradually decreased over the year, and in the year 2019, the number of enterprises that survived is only 151,500, less than half of the numbers in the year 2015. Region-wise, the highest number of enterprises born in London followed by South East and North West.
The ANOVA test shows that p-values in all three cases are more than the significance level of 0.05, and hence, we conclude that there are significant differences in
- Mean number of enterprises born in the years 2015, 2016, 2017, 2018 and 2019
- Mean number of enterprises survived for one year in 2015, 2016, 2017, 2018 and 2019
- The mean number of enterprises survived for one year, two years, three years, four years, and five years.
Conclusion
The analysis suggests that there the mean number of enterprises born or survived for a year differs significantly across the years. Similarly, there is a significant difference in the mean number of enterprises that survived for years 1, 2, 3, 4 and 5. With the passage of years, the survived number of enterprises has decreased. The year 2016 seems productive as the highest number of enterprises were born in this year only. Region-wise, London is most conducive for new enterprises, followed by Southeast and Northwest.
References
Cegeilka, M (2020). Factors Determining the Survival of New Companies. Central European Economic Journal. Vol.7, No.54. Retrieved from: https://doi.org/10.2478/ceej-2020-0021
Brixy, U., Grotz, R (2007). Regional patterns and determinants of birth and survival of new firms in Western Germany. Entrepreneurship & Regional Development. Vol.19, Issue 4. Retrieved from: https://doi.org/10.1080/08985620701275510
Business Demography, UK (2019). Retrieved from: https://www.ons.gov.uk/businessindustryandtrade/business/activitysizeandlocation/datasets/businessdemographyreferencetable
 write
write