Abstract:
The project aims to give a detailed valuation of BHP Billiton Ltd through the elaborated method. We selected the BHP Billiton Company ltd due to its prominent presence in the market. It is also under-recovery from a significant financial struggle associated with the COVID-19 and the loss of its subsidiaries. The research is based on publicly available annual financial statements. The analysis uses the last five years’ financial statements to predict or forecast future trends in the company and the general market. The assumptions used in the economic valuation are derived from meticulous analysis of the financial data, together with the key drivers in the industry and market prospects.
1.0 Introduction:
BHP Group Limited was formally known as the BHP Billiton Limited. The company is an Australian public company that collaborated with the UK-based BHP Group to form the BHP. The company generates its revenues from the explorations, processing, and production of energy and minerals resources. BHP Company employs over 34,400 employees with more than 40000 contractors who are operating in more than 90 locations across the continents, and it is administered through their global headquarter, which is situated in Melbourne (Statsenko, Gorod and Ireland, 2018). The BHP Group is operating through the Dual Listed structure of the company, which entails two parent firms: Australia registered BHP Group Limited, which is listed in New York Stock Exchange (NYSE), and the BHP registered in UK, London Stock Exchange. The company operating strategy or model is straightforward but functional. The company’s strategy is to own and operate significant massive, long-life, expandable, low-cost, and upstream assets diversified through the commodity, market, and geography. The company has created a plan which is consistent with their model and strategy, which is to make the long-term focused on the key areas which are discussed in the preceding paragraphs:
Cost efficiencies: focusing on other grains, from 2012, the BHP annualized their gains on productivity to exceed the 12 Billion US dollars. The combination of the company simplified portfolio, connected workforce, and large scale streamlined systems to ensure the company is positioned strategically to deliver about 1 billion US Dollars in addition to the productivity gain by the end of the 2019 Financial year, having a powerful momentum to carry through the 2020 financial year (Ivanova, Rolfe, Lockie, and Timmer, 2007). In terms of technology, the company ensures the improvement of the safety measures, costs, and unlocking resources through the right technology. BHP constantly integrates and automates its value to the chain to help open the resources and drive a change in terms of costs volume and safety (Statsenko, Gorod and Ireland, 2018). BHP Company has enhanced the initiatives promoting high value across the mine with precision in mining. Hence, they have reduced the inherent risks through their solution-based technology in natural conditions. BHP Company has a diversified portfolio which enables the company to adapt to the technology meant for specific commodities to other areas in the business operations (Street, Lacey, and Somoray, 2019). For instance, the company has a high interest in remote functions. They were the first to develop the Western Australian Iron Ore, an advanced control room that allowed the BHP Company to optimize its production supply chain. They use the same approach in their other minerals’ operation sites and assets such as copper and coal (Mudhar, 2019).
Latent capacity: BHP Latent capacity is about unlocking the untapped production at the least possible risks. The company has replaced its suite of latent capacity opportunities to optimize and to debottleneck their existing rig, mine, rail, processing facilities, and port. That implies that the company is capable of achieving more productivity or replacing production from the existing infrastructure for low costs. The company’s operating model enables BHP to leverage the integrated systems and technology, which helps in applying high standards and replicating expertise for transparency in governance. Assets are among the geographically proximate operations, which include open-cut and underground mines, together with the offshore gas and oil production processing facilities (Statsenko, Gorod and Ireland, 2018). The company produces commodities through its assets. The operating assets are owned and fully managed through the BHP or owned jointly ventured and operated through the BHP. The company also holds other assets which are not explicitly used by the BHP but are jointly ventured by the BHP (Mudhar, 2019). The company has grouped its holdings into different geographic regions, such as Minerals Americas and Minerals Australia, while gas and oil are considered a single global asset group. The paper analyzes the BHP Company to assess its value based on its financial analysis. According to the BHP 2020 financial statement, the company’s prices from its products are the critical drivers for the BHP value. The fluctuations in such commodities prices are likely to affect the company’s results which include the asset values and the cash flows.
2.0 Literature review:
The initial rumblings concerning gold in Australia before the metal were discovered in South Africa. The Australian mining sector had a unique history, mainly because most minerals were near the earth’s surface and did not require massive capital investment to extract. Therefore, most small mining operators were to run their operations successfully. The initial discovery of the Australian gold was made near Bathurst, Victoria, in 1839 by Count Strelecki
The Australian resource sector is making a substantial contribution to the Economy since it accounts for approximately 20% of the business investment and about 60% of the export in Australia. Significant spillovers are emerging from export in Australia. The data extracted from the inter-industry linages shows that the activities in the sectors which are serving the mining industry quadrupled with the booming of the GDP share from the early time of the 2000s to the investment peak in 2012 and 2013. Some findings proved that the mining investment faces a difficult circumstance and is expected to pick up in the preceding years gradually. The mineral resource exports are also to have a significant contribution to GDP growth before plateauing into newer levels (Statsenko, Gorod and Ireland, 2018).
The valuation method used in this paper is paper is based on the walls street and guidelines extracted from the Corporate Finance Institute. (Street of Walls, 2013). The financial information on the income statement, cash flow statement, and balance sheet are all based on the BHP financial report publicly available as provided by the BHP company. The BHP assumptions which were made concerning the DCF model were all derived from the Bloomberg Terminals, whereby all the sell-side analysts’ reports, forecasts, and other recommendations were obtained (Mayes, 2020). The sources from the BHP company online site like the 2016, 2017, 2018, 2019, and 2020 financial information helped contribute to the financial estimations. The driving factor behind the global demand for minerals is the constant growth of the population. The urbanization and industrialization process are likely to enhance the commodity demand, although the demand composition is likely to change with the changes in the country. For instance, when the government becomes more affluent, the market will also change, like most prosperous countries have more demands for protein-based diet, while their constructions are steel-intensive. The increase in the demand from various factors is likely to be offset with time through technological advancement, which increases the resource efficiency for inputs. Some of the government commitment, and policy considerations, and Paris Agreements are likely to have an impact on the demand composition (Street, Lacey, and Somoray, 2019). To effectively explore how commodities demand is expected to change in the long term, we are going to splits the commodity demand into three groups such as energy-related resources and construction-related resources.
Construction Related Resources
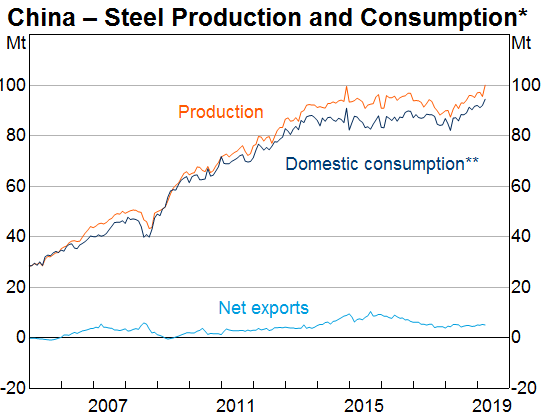
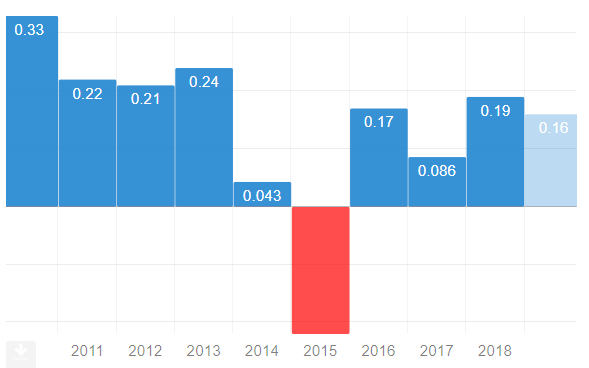
The construction-related resources in Australia are iron ore and coal, used for cooking. These commodities are vital inputs in steel production, and they accounted for over 40% of the total resources in Australian exports in 2018, which was an increase from 2000 to 20%. China is among the largest steel consumers across the globe, and it is the destination for over 80% of the iron ore from Australia and approximately a quarter of the Australian coal exports used for cooking purposes (Mayes, 2020). The figure below shows that over the last year, the growth of Chinese steel demand has been increasing drastically, driven by population growth, urbanization, and industrialization. See the figure below for more illustrations.
However, it is estimated that the demand for iron ore in China would decline since China’s population is likely to reduce in the coming years. The industrialization rates, together with urbanization, are reasonable to slow down as the Economy matures (Statsenko, Gorod and Ireland, 2018). These factors will reduce the demand for steel in infrastructure and urban housing. However, the steel demand is still expected to hold up in the manufacturing sector (Perez and Sanchez, 2009). See the second graph shown below.
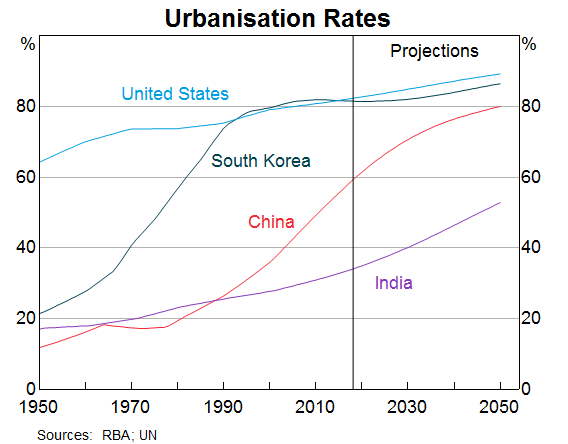
The policy is likely to affect the demand for cocking coal and iron ore in china, and the Chinese authorities have encouraged the shift towards high-quality inputs. The Chinese authorities have encouraged the growth towards high-quality inputs in the steel manufacturing process to help reduce pollutions (Mayes, 2020). The recent policy statements assert the emphasis on the management of the environment and the impact of industrialization. China is also proposing to increase its scrap-use ratio over the medium term. However, it might be challenging since there is limited scrap steel availability and the recycling infrastructure. There are two other crucial steel consumers besides China which are India and the United States. There is a high probability that the United States will continually become a significant consumer of steel due to its technological advancement and its large population. But several reasons suggest that India is likely to affect their steel demand. With its current population projection, India is anticipated to be the following most populated country by 2030, the steel demand is also expected to increase in urbanization since many people are currently moving to the cities and they need to live in houses and they also require infrastructures to help in supporting their daily operations. The graphs below illustrate India’s urbanization process is still low (Street, Lacey, and Somoray, 2019).
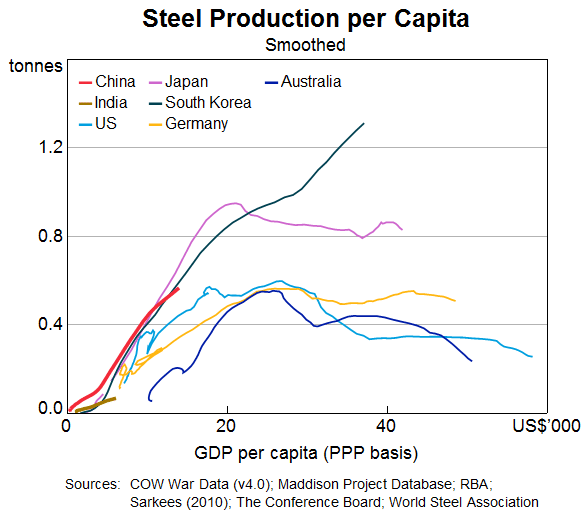
There is a high probability for the steel intensity in the Indian Economy to accelerate. Historically, the steel power is likely to increase with the GDP per capita to the point whereby it will level out. The graph below illustrates how China has leveled out already since they have reached the plateau. At the same time, the intensity for India is still much lower since they are substantial steel exporters (Street, Lacey, and Somoray, 2019).
The government of India has the objective of tripling domestic steel production by 2030 by approximately 300 million. Most of such increases would help meet their demand for local consumption. However, a slower growth rate would be realized. The demand for critical coal from Australia would increase since India has a minimum reserve for coal that cannot match the increasing demand; India is already experiencing self-sufficient iron ore with an increase in high-quality hematite (Mayes, 2020).
Gold
Australia is in position number five regarding the most significant resource export by value is gold. The increase in the value of the Australian dollar in gold prices results in high spending for the local explorations and production in Australia. Gold has resulted in the national explorations expenditure from the 2016 financial year. See the figure below for more illustrations.
Approximately half of the demand for gold in 2018 was meant for the production of gold jewelry. China and India are still the leading markets for gold jewelry. Since India has a vast population and the number of educated is expected to increase, the demand for gold from Australia is likely to grow tremendously.
Resources related to energy
Most of the factors that boost the demand for construction commodities also increase the demand for energy with time. The global energy mix is expected to change significantly, and the projected changes in global power are presenting both challenges and opportunities. There is an assumption that things will likely evolve depending on the present policies. There are projections that the demand for coal will be very stable due to the increasing general demand for energy. Thermal coal is among Australia’s biggest point-linked exports. Together with China, South Korea, and Japan account for approximately 75% of the thermal coal exports for Australia. There is also a more robust demand for metals used as inputs in lithium batteries and are used intensively in electric vehicles like copper. Therefore, Australia has a significant opportunity to explore, and various lithium mines are already constructed in Western Australia in recent years. See the picture below for more illustrations.
The projected changes in global energy present new opportunities and challenges. There is an assumption that things are evolving with the current policies. Every citizen has the right to access any information concerning the environment, and it is acknowledged internationally as their right. The international negotiation document such as the Rio Declaration together with the Agenda 21 were both approved at the Earth Summit, which was held in Rio de Janeiro, which was born in 1992. The plan was calling for the companies and the government alike to reveal information concerning the condition of the environment and the impact of their operations on the environment. The Rio Declaration principle number 10 states that every person at the national level has the right to access information about the environment, which is under the custody of the public authority.
Additionally, the Aarhus Convention, which the United Nations Economic Commission promotes for Europe, adopted in 1998 engages the signatory when granting the public rights for accessibility of the environmental information (Statsenko, Gorod and Ireland, 2018). Notably, chapter 30 encourages businesses to communicate ecological performance. Ecological, sustainability, and social reporting are vital tools for mining firms to share their achievements and policies effectively. They evolve from comprehensive sustainability to environmental performance. The mining industry has been under strict scrutiny for the substantial ecological footprint from their activities and the impact they would have on the community. The criticism emerging from civil society has been the main drive for environmental reporting among the mining companies. Social activism is usually recognized among the most critical drivers influencing corporate social responsibility.
By the 1980 and early 1990s, several countries were under several criticisms from pressure groups and NGOs. There were calls for halting and forms of mining in various countries, including Canada. Most mining companies decided to release their communication on environmental, social, and sustainability issues to the general public. The Mining Association of Canada started using some strategies which would enhance transparency, such as a monitoring program by stating that the environmental performance will be reported to the Board of Directors of a company regularly. Secondly, strengthening the communication with the stakeholders by confirming that the mining firms will work collectively and individually to make factual information and objectives available to the governments, general public, and the employees. The mining companies use five strategic measures to help in tackling the challenges related to sustainability, such as investing in the development and research, involving stakeholders, encouraging global networking for the mining companies, and implementing voluntary agreements about the environment.
Global Mining Information
Global mineral extraction has grown at an unparalleled pace from the past decades resulting in a broad range of environmental and social impacts worldwide. There is an increasing demand for minerals due to population growth or pressure. The higher the demand for the minerals and the declining ore quality results in larger volumes of unused materials being disposed and extracted. The direct use of land by mining is a very crucial measure for the environmental pressure, and it is related to the negative environmental impacts, such as ecosystem degradation, loss of biodiversity, and fragmentations. The above indicators support the various development sustainable goals since mining activities have adverse implications for ecosystem service and biodiversity. The data from the mining and land use is essential for further development of the land footprint measures. Unfortunately, information concerning the mining areas across the globe is still not available. The international mining databases are regularly updated by the mining industries, national geological services, information services, and associations. The sources of data only are not sufficient for the complete valuations of the mining and land use. The images from the satellite are significant sources of information concerning the extent of mining and help complement the statistics and surveys. The visual satellite image interpretations have been applied to over 295 most relevant mining sites concerning the production of commodities worldwide. The method is very effective and accurate; however, it is time-consuming and costly, resulting in challenges when producing accounts in the global mining areas.
The article by Jane asserts that the future of mining is dependent on the balancing of the mineral demand and the demand for societal sustainability. Mining activities are beneficial to society as it helps meet the global market for minerals and fuel and help stimulate economic growth while reducing poverty in a developing country. However, mining poses significant risks to human health and the ecosystem in a developing country. The concern from the society that growth of population and the impact of human activities has resulted in the development of the sustainable goal, which demands that the present generation meet their needs without necessarily compromising the future capabilities of the future generation to satisfy their own needs. The perception that the development of minerals in some areas is a threat to the protected biodiversity within those regions has been the main issue plaguing the mineral and mining industry. Since the demand for minerals is likely to accelerate in the foreseeable future as a result of an increase in population, their strategies should be put in place to help in reducing the environmental and health risks associated with mining activities in Australia and other parts of the world.
3.0 Sector Review
World Economic Outlook
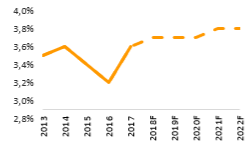
The world economic outlook is very much favorable. The recovery of the global financial perspective is underway as a result of the increasing level of investments and the improving trade rates despite the ongoing pandemic. The economic growth is anticipated to increase by approximately 3 to 4 percent. The world economic growth is likely to be sustained in the coming years. However, China’s economic growth is currently decelerating. However, there are other emerging economies, especially the developing economies, mainly due to the increase in the import of commodities. Nevertheless, some inherent risks are related to financial stress, high-level protectionism, and increasing geopolitical tensions. See the figure below for the world GDP Growth.
World GDP Growth.
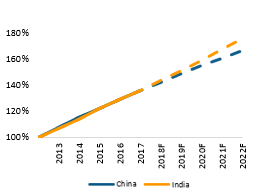
China and India Outlook
The Chinese GDP growth reached 6.8 percent by 2017, and it is also anticipated that the constant growth is likely to slow down even for the values that are below 6 percent in the financial forecast for 2022, which are very low and have not been seen since the early 1990s. The performance of China was excellent in 2017 since they had a significant export revival in terms of exports. China increased its import for the commodities and enforced the production of the consolidated demand. The figure below shows that from 2018, India’s economic performance started outshining that of China.
3.1 Australia’s Mining Sector
Mining is described as the process or action of extracting ores from the mines. In some circumstances, the initial processing stage is called primary processing, which includes transforming and refining the ores. The information in this section is extracted from the Australian Bureau of Statistics, among other sources such as IBIS World and Energy Economics.
3.1.1 Size and Growth
The mining sector in Australia is vast and necessary for the Economy; the industry is significant in the ores mined or extracted. However, it is part of the multiple value-added sectors, which entails associated services. Figure 1 below summarizes the sector growth and revenue projections within the context. The table below suggests that the Australian mining sector is mainly an extracted ore, exploring and producing metals among the export sector.
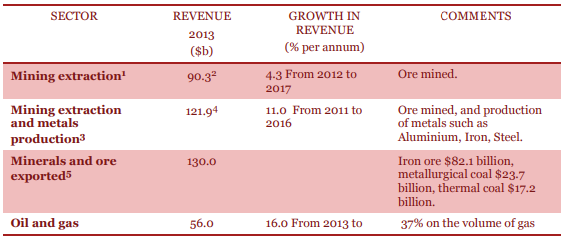
Australia has major multinational companies operating within the gas and mining sector. Five Australian mining firms are listed in the Forbes Global 2000 list. Approximately $82 billion per year. The five companies are Woodside Petroleum, BHP Billiton, Fortescue Metals, Newcrest Mining, and Santos.
Identified and exploited mineral resources in Australia
The mineral sector is the largest earner of export in Australia, with mineral export making upto 60 percent of the annual value for the total goods and services exports. The Australian mineral sector is dominated by iron ore, coal, copper, gold, alumina, and nickel, and the primary market is South Korea, Japan, India, and China. The value of the mining sector was expected to reach increase to $107 billion from the initial $86.6 billion in 2012 and grow at an average rate of 4.3 percent over the forecast period.
Mining and Metals production in Australia
The mining and the metal sector comprise iron, steel, and aluminum, among other precious metals and minerals. It also entails the extraction of minerals from the ground and the production of metals like aluminum, steel, and lead. The Australian mining sector was $98.9 billion worth in 2011. With the forecast conducted in 2011, it was forecasted that the industry’s worth would reach $169.4 billion, which is 11 percent growth by 2016. The SWOT Analysis below describes some of the critical challenges facing the mining sector in Australia.
| STRENGTHS:
i). There are many minerals, including high-grade deposits such as iron ore, ii). Australia is the leading player in the mining segment. iii). Australia has global companies which succeed in the mining sector. iv). Australian mining sector invest heavily in research and development (R&D). v). Australian mining sector is spending significantly on staff training. |
WEAKNESSES:
i). There have been very few discoveries concerning new deposits in the past years. ii). Costs associated with Australian mines are very high compared to other mines. iii). Mining investments peaked and are anticipated to decline in the coming years. iv). Mining sector has adverse impacts on the environment. v). Reports concerning adverse social effects on demographics. |
| OPPORTUNITIES:
i). Focusing on production improvement and efficiency in rationalizing the supply chain, ii). Improving the techniques that can help in managing the volatility of the market. iii). There are new sources of funding to support investment in the sector. There is adoption for engaging communities more effectively. iv). Discoveries for the new generation of mining deposits to extend the lifespan of livestock. |
THREATS
i). There are talent gaps and skill shortages in the mining sector. ii). There is increasing community scrutiny and demand and the capability of the mining firms to win the social for operations. iii). Mining activities might be hindered by the inadequate infrastructure since large miners are cutting the capital expenses. |
Comparative Advantages and Disadvantages
The Australian mining sector has its unique comparative advantage and disadvantages, which is considering whether Australia has the capabilities for mining ores and producing more minerals advantageously in comparison to other firms. That has to do with excellent reliability, lower costs, and even lower risks.
Current Mining Sector Comparative Advantage
There is a substantial comparative advantage in Australia compared to most countries trying to produce their minerals. That is because of various factors, which entails; advanced explorations, a skilled workforce, mining and processing expertise, generally physical conditions together with the low-density populations, and I did not inquire further (Bakker and Shepherd, 2017). These competitive factors imply that the modern could be undertaken together with the high community expectations for the social and environmental performance. The recent mining improvement entails large-scale mining and automation, which has reduced the cost of mining and allowed for economic deposit extractions, which were not economic in the past. There are new metallurgical breakthroughs and methods like the carbon-based leaching methods for the gold deposits, which have improved the recovery rates for some of the minerals and metals and increased the economic viability for some of the deposits like the lateritic nickel and creating a substantial increase in the financial resources.
Australia has the world’s most significant economic resources, such as iron ore, gold, rutile, lead, nickel, and zinc. Australia is also ranked among the top six globally known resources for antimony, recoverable brown coal, black coal, diamond, copper, lithium, diamond, silver, and tungsten, among others. The mineral resources in Australia are adequate to maintain mining as the most crucial export earning sector for the Australian Economy in the foreseeable future. The ratios of EDR to the present mine production offer indicative measurements for the useful life of resources. Through such proportions, the EDR of most Australian primary resources is sustained through the current mine rates for production in most decades. The commodities that have resource life below 50 years are the manganese ore which has approximately 15 years with the current production rates; gold and diamond have about 35 years, while zinc has around 45 years.
BMI evaluates the mining risks and the reward rating compared to the other countries across Asia. The rating system helps evaluate the countries relative attractiveness to primarily the new and the large-scale investment in the sector. It does so through; Rewards: an evaluation of the sector’s growth and size potential in every state and bordering state/industry characteristic that might hinder developments. Risks; assessment of the industry-specific dangers which emanate from the economic and political profile in the state. It calls for the probability of questioning for the anticipated returns realized over the assessed time.
From the above evaluation, the outcome still proves that Australia is still topping the mining risks and rewards rating in the Asian region since it has a scarce combination for the substantial reserves of minerals, significant opportunities for growth, with a more favorable investment climate. Australian mining is the global leader in lead, iron ore, gold production, and zinc, among others.
4.0 Company Assessment
In this section, we are dealing with the valuation of BHP Billiton. See the table below, illustrating vital information from the BHP Billiton financial analysis.
| 0 | 2016 | 2017 | 2018 | 2019 | 2020 | 2021 (projected) |
| Total Assets | 117.01 B | 111.99 B | 100.86 B | 105.73 B | 108.93 B | 107.51 B |
| Current Assets | 21.06 B | 35.13 B | 23.37 B | 21.47 B | 26.69 B | 27.14 B |
| Total Debt | 31.97 B | 28.04 B | 25.85 B | 28.69 B | 22.26 B | 24.02 B |
| Debt Current | 1.64 B | 2.87 B | 1.79 B | 5.24 B | 2.76 B | 2.96 B |
| Debt NON-CURRENT | 30.34 B | 25.16 B | 24.06 B | 23.45 B | 19.5 B | 25.1 B |
| Total Debt USD | 31.97 B | 28.04 B | 25.85 B | 28.69 B | 22.26 B | 24.02 B |
| Deferred Revenue | 462 M | 455 M | 394 M | 307 M | 290 M | 342.91 M |
| Shareholders Equity | 57.26 B | 55.59 B | 47.24 B | 47.87 B | 51.26 B | 51.89 B |
| Shareholders Equity USD | 57.26 B | 55.59 B | 47.24 B | 47.87 B | 51.26 B | 51.89 B |
| Goodwill and Intangible Assets | 3.97 B | 778 M | 675 M | 1.57 B | 1.44 B | 2.07 B |
| Inventory | 4.77 B | 4.91 B | 4.61 B | 5.32 B | 5.78 B | 5.36 B |
| Investments | 3.8 B | 3.67 B | 3.96 B | 5.19 B | 3.58 B | 4.32 B |
| Investments Current | 121 M | 72 M | 200 M | 84 M | 230 M | 185.01 M |
| Investments Non Current | 3.73 B | 3.47 B | 3.87 B | 5.11 B | 3.35 B | 4.11 B |
| Total Liabilities | 54.28 B | 51.32 B | 49.04 B | 53.56 B | 53.32 B | 51.48 B |
| Current Liabilities | 11.37 B | 13.99 B | 12.34 B | 14.82 B | 16.4 B | 15.3 B |
| Liabilities NON-CURRENT | 42.91 B | 37.33 B | 36.7 B | 38.73 B | 36.92 B | 42.46 B |
| Trade and NON-TRADE Payables | 5.56 B | 5.98 B | 6.72 B | 5.77 B | 7.03 B | 7.07 B |
| Property Plant and Equipment Net | 80.5 B | 67.18 B | 68.04 B | 72.36 B | 73.81 B | 73.78 B |
| Trade and NON-TRADE Receivables | 3.64 B | 3.28 B | 3.77 B | 3.63 B | 6.4 B | 5.93 B |
| Accumulated Retained Earnings Deficit | 52.62 B | 51.06 B | 42.82 B | 43.4 B | 46.78 B | 47.71 B |
| Tax Assets | 5.98 B | 4.15 B | 3.89 B | 4.05 B | 2.19 B | 3.16 B |
| Tax Liabilities | 5.88 B | 5.38 B | 4.97 B | 4.8 B | 6.23 B | 5.83 B |
Balance Sheet Analysis:
Balance sheet assessment gives a quick snapshot concerning the company’s financial position. The balance sheet is usually calculated quarterly, six months, and annually. For BHP Billiton, the balance sheet is analyzed annually, and it has two main segments, which are the assets and the liability sections. The liabilities comprise of the debts, or other BHP Billiton obligations are subdivided into the current liability and the long-term liabilities. On the other hand, the assets describe anything which can be converted into cash and is currently owned by the BHP Billiton Company (Bakker and Shepherd, 2017). The company’s assets are also subdivided into two major categories, which are the current and the non-current asset. See the BHP Billiton projected balance sheet and the historical balance sheet.
| 2016 | 2017 | 2018 | 2019 | 2020 | 2021 (projected) | |
| Total Assets | 117.01 B | 111.99 B | 100.86 B | 105.73 B | 108.93 B | 107.51 B |
| Current Assets | 21.06 B | 35.13 B | 23.37 B | 21.47 B | 26.69 B | 27.14 B |
| Assets Non-Current | 95.95 B | 76.86 B | 77.49 B | 84.26 B | 82.23 B | 83.93 B |
| Cash and Equivalents | 14.15 B | 15.87 B | 15.61 B | 13.43 B | 15.25 B | 14.38 B |
| Total Debt | 31.97 B | 28.04 B | 25.85 B | 28.69 B | 22.26 B | 24.02 B |
| Debt Current | 1.64 B | 2.87 B | 1.79 B | 5.24 B | 2.76 B | 2.96 B |
| Debt Non-Current | 30.34 B | 25.16 B | 24.06 B | 23.45 B | 19.5 B | 25.1 B |
| Deferred Revenue | 462 M | 455 M | 394 M | 307 M | 290 M | 342.91 M |
| Shareholders’ Equity | 57.26 B | 55.59 B | 47.24 B | 47.87 B | 51.26 B | 51.89 B |
| Inventory | 4.77 B | 4.91 B | 4.61 B | 5.32 B | 5.78 B | 5.36 B |
| Investments | 3.8 B | 3.67 B | 3.96 B | 5.19 B | 3.58 B | 4.32 B |
| Investments Current | 121 M | 72 M | 200 M | 84 M | 230 M | 185.01 M |
| Total Liabilities | 54.28 B | 51.32 B | 49.04 B | 53.56 B | 53.32 B | 51.48 B |
| Current Liabilities | 11.37 B | 13.99 B | 12.34 B | 14.82 B | 16.4 B | 15.3 B |
| Tax Assets | 5.98 B | 4.15 B | 3.89 B | 4.05 B | 2.19 B | 3.16 B |
| Tax Liabilities | 5.88 B | 5.38 B | 4.97 B | 4.8 B | 6.23 B | 5.83 B |
HP Billiton balance sheet is among the primary financial statements which are reporting every asset, liabilities among other shareholders’ equity every year. Balance sheets offer the basis of various categories for the computation of the rate of return, like the return on equity and the return on assets, among measures on how the company utilizes its capital expenditures (Bakker and Shepherd, 2017). It helps the investors and other stakeholders to know what type of assets that the company owns. From the analysis, BHP Billiton has very stable shareholder’s equity currently compared to the previous year. For instance, BHP Billiton reported 51.26 billion worth of shareholders’ equity which was a significant improvement from 2019 at 47.87 billion (Northey, Mudd, and Werner, 2018). It is also projected that the shareholder’s equity will increase to 51.89 billion in 2021. It is also projected that Goodwill and other intangible assets will likely increase to approximately 2.07 Billion. At the same time, the company’s inventory is expected to decline by about 0.4billion to 5.4billion from the initial 5.8 billion last year. Below are the forecasted income statements.
| 2016 | 2017 | 2018 | 2019 | 2020 | 2021 (projected) | |
| Consolidated Income | 6.22 B | 4.82 B | 9.19 B | 8.74 B | 13.45 B | 11.2 B |
| Gross Profit | 35.74 B | 43.13 B | 44.29 B | 42.93 B | 60.82 B | 53.17 B |
| Interest Expense | 1.42 B | 1.25 B | 1.06 B | 911 M | 1.3 B | 1.26 B |
| Net Income | 5.89 B | 3.71 B | 8.31 B | 7.96 B | 11.3 B | 9.66 B |
| Operating Expenses | 24.12 B | 27.53 B | 28.02 B | 28.77 B | 34.5 B | 32.19 B |
| Operating Income | 11.62 B | 15.6 B | 16.27 B | 14.16 B | 26.32 B | 20.99 B |
| Revenues | 35.74 B | 43.13 B | 44.29 B | 42.93 B | 60.82 B | 53.17 B |
| Income Tax Expense | 4.44 B | 7.01 B | 5.53 B | 4.77 B | 11.15 B | 9.38 B |
Total Assets
It is the cumulative amount of assets that the BHP Billiton Company owns. The investments are items with economic value and are anticipated to benefit the holder. These assets are generally recorded in the BHP Billiton accounting books with different categories like cash, market security, account receivables, inventory, fixed assets, and account receivables that are prepaid expenditures. The main factors that make the total assets are the cash and equivalents, Goodwill and intangible assets, investments, equipment net, and property plant, and other tax assets.
Current Assets
The current assets for the BHP comprise Billiton cash and the cash equivalents, short-term investments, account receivables, and the stock of inventory, among other portions of the prepaid liabilities, which are payable within a year (Bakker and Shepherd, 2017). Depending on the type of business, the current assets are expected to range from backed goods, barrels of crude oil, and foreign currency. The existing assets are crucial because they are used for funding daily operations for BHP Billiton. The current portion of the total investments is reported when the company operates as a classified balance sheet segmenting the non-current and the existing assets.
PROFITABILITY RATIOS
The BHP profitability analysis uses the financial ratios, among other critical drivers, for measuring the company’s capability to create relative revenue, cost of operations, and assets, among additional current equity. The fundamental measures test how effectively BHP Billiton will generate income regarding the payment, current equity, operating costs, and assets (Bakker and Shepherd, 2017). The fundamental measures attest to the effectiveness of BHP in utilizing its assets in generating value and profit for its shareholders. The profitability module shows the correlation between the most important drivers and BHP Billiton. The previous analysis expected that the price to sales ratio would decline to 3.35, the return on sales is also likely to reduce to 0.33. The net loss to the income is expected to increase to approximately 395 million, while the consolidated revenue will decline by about 11.2 billion.
The financial sector is built on the potential for growth and the accuracy of future valuations. Some of the Key profitability ratios are as follows:
| BHP Ratios | Industry | |
| Gross margin TTM | – | -2,585.61 |
| Gross Margin 5YA | 62.50% | -22.81 |
| Operating margin TTM | 42.60% | -15,914.88 |
| Operating margin 5YA | 37.46% | -11,612.11 |
| Pretax margin TTM | 40.45% | -16,282.36 |
| Pretax margin 5YA | 34.84% | -11,335.29 |
| Net Profit margin TTM | 22.12% | -16,314.65 |
| Net Profit margin 5YA | 21.36% | -11,253.08 |
Pretax Profit Margin
The pretax profit margin is the financial accounting tool that is used in measuring the efficiency of operations in a company. That ration helps in informing the investors and stakeholders about the sales that the company managed to convert into profits, and the cents which have been generated for every dollar invested in sales before deduction. Pretax profit margin is interpreted by dividing the total revenue to get the pretax profits. BHP Billiton pretax profits is very high which shows that the company is very much efficient, since it is 34.84 five-year financial analysis, compared to industry average which is very low at -11,253.08.
Gross Margin
The five-year financial analysis reveals that the BHP Company is has a 62.50 percent Gross margin, while the industry has -22.81 percent, as shown in the table above. The gross margin ratio is an indication of the company’s profitability, and it measures how much profit does the firm makes after paying the costs of their goods. It shows the level of efficiency in the company. Although the gross margin usually varies with the company, the higher the value, the more profitable and efficient a firm is considered to be, and from the table above, BHP is very much efficient compared to the industry average from their five-year financial analysis.
Operating Profit Margin Ratio
Operating profit margin indicates the firm’s profitability, which is made even after paying the variable costs for the production like raw materials and wages. It also shows the company’s efficiency in cost control and the expenditures related to the business operations. The five-year analysis shows that BHP Billiton has a 37.46% operating margin, which is above the industry average, at -11,612.11. That indicates that BHP Billiton is performing very effectively.
Net Profit Margin
This ratio is an indication of the net income that the company makes from its total sales; a higher net profit margin implies that the company is very much efficient when it comes to the conversion of its sales into the actual profit under the gross profit. This ratio is among the most important for measuring the company’s general profitability. It is the ratio of the net profits to the revenues for the business segments or company. The most significant net profit after accounting for other expenses implies that the business is making very efficient in its operations. BHP Billiton has a 21.36 percent ratio, which is higher than the industry average at -11,253.08. See the figure below to illustrate better the BHP Billiton profitability ratio and comparison to the industry average.
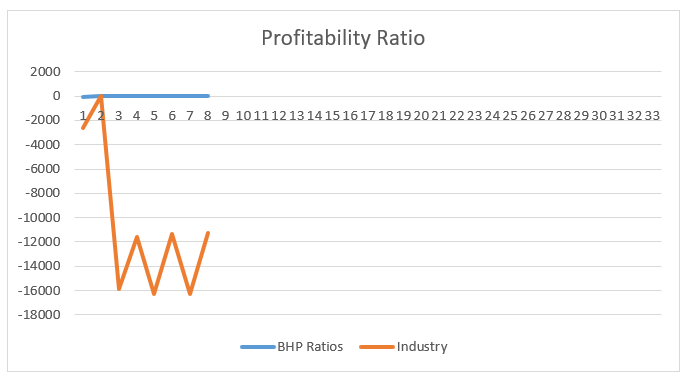
The figure above shows that BHP Billiton is performing much better than the industry average in terms of profitability. Therefore, investing in BHP Billiton is a worthwhile decision.
The DCF Valuation
It is the financial technique used to valuation assets on the investments based on the return to the future cash flow. The Discounted Cash Flow is essential in calculating the worth of investment currently. The DCF analysis applies to the investments and every asset procurement by the company. The DCF is the valuation method that is also useful to private investors in private firms. It helps in projecting the future of the cash flow in the company, Earnings before income tax (EBITDA), and other earnings together with the discounts for the value of money based. The time value for money is the concept which asserts that every invested dollar now is worth more than a dollar in the future since a dollar can be invested today. See the figure below for the BHP Billiton DCF.
| Valuation | NPV (US$mn) | US$/sh | NPV (A$mn) | A$/sh | GBP/sh | % | |||||
| Bass Strait | 3,741 | 0.7 | 5,067 | 0.95 | 0.52 | 3% | |||||
| North West Shelf | 5,096 | 0.96 | 6,902 | 1.3 | 0.71 | 4% | |||||
| Macedon | 313 | 0.06 | 428 | 0.08 | 0.04 | 0% | |||||
| Atlantis | 3,602 | 0.68 | 4,876 | 0.92 | 0.5 | 3% | |||||
| Shenzi | 1,293 | 0.24 | 1,763 | 0.33 | 0.18 | 1% | |||||
| Mad Dog | 570 | 0.11 | 751 | 0.14 | 0.08 | 0% | |||||
| ROD & Ohanet | 72 | 0.01 | 100 | 0.02 | 0.01 | 0% | |||||
| Liverpool Bay & Bruce/Keith | 0 | 0 | 0 | 0 | 0 | 0% | |||||
| US Onshore | 9,732 | 1.83 | 13,125 | 2.47 | 1.35 | 8% | |||||
| Other | 1,690 | 0.32 | 2,292 | 0.43 | 0.24 | 1% | |||||
| PETROLEUM | 26,109 | 4.91 | 35,304 | 6.63 | 3.63 | ||||||
| Western Australia Iron Ore | 54,986 | 10.33 | 73,914 | 13.89 | 7.65 | ||||||
| Samarco | -574 | -0.11 | -784 | -0.15 | -0.08 | ||||||
| IRON ORE | 54,412 | 10.22 | 73,130 | 13.74 | 7.57 | ||||||
| Escondida | 9,460 | 1.78 | 12,711 | 2.39 | 1.32 | ||||||
| Pampa Norte (Spence & Cerro Colorado) | 4,376 | 0.82 | 5,701 | 1.07 | 0.61 | ||||||
| Antamina | 3,314 | 0.62 | 4,463 | 0.84 | 0.46 | ||||||
| Olympic Dam | 2,619 | 0.49 | 3,521 | 0.66 | 0.36 | ||||||
| COPPER | 19,769 | 3.71 | 26,396 | 4.96 | 2.75 | ||||||
| NSW Energy Coal (prev. Hunter Valley) | 2,568 | 0.48 | 3,450 | 0.65 | 0.36 | ||||||
| Colombia | 1,838 | 0.35 | 2,467 | 0.46 | 0.26 | ||||||
| ENERGY COAL | 4,406 | 0.83 | 5,917 | 1.11 | 0.61 | ||||||
| POTASH | 2,057 | 0.39 | 2,704 | 0.51 | 0.29 | ||||||
| Queensland Coal | 9,085 | 1.71 | 12,242 | 2.3 | 1.26 | ||||||
| METALLURGICAL COAL | 9,085 | 1.71 | 12,242 | 2.3 | 1.26 | ||||||
| NICKEL WEST | 0 | 0 | 0 | 0 | 0 | ||||||
| Exploration/Development Projects | 1,970 | 0.37 | 2,520 | 0.47 | 0.27 | ||||||
| Other (incl. exploration/Corp) | -679 | -0.13 | -930 | -0.17 | -0.09 | ||||||
| Total operations | 117,130 | 22 | 157,283 | 29.55 | 16.29 | ||||||
| Net debt | 22,645 | 4.25 | 28,967 | 5.44 | 3.15 | ||||||
| Provisions (employee etc.) | 1,813 | 0.34 | 2,319 | 0.44 | 0.25 | ||||||
| Rehab provision | 6,700 | 1.26 | 8,571 | 1.61 | 0.93 | ||||||
| Equity value | 85,972 | 16.2 | 117,426 | 22.1 | 11.96 | ||||||
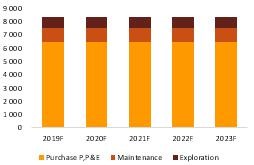
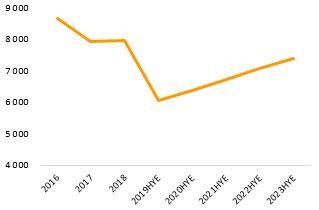
CAPEX, D&A, and Impairment
BHP Billiton is planning for the CAPEX to maintain below $7.0 million yearly. Therefore, as it is based on the plans of the company and that of the project, it is estimated that the company is likely to have a CAPEX of 7.8 Million by 2022 and the extra expenses for the exploration of about 0.9 million dollars in the forecasted period (Tyler et al., 2017). That is due to finishing the projects in progress and the high-efficiency level in the already established mining areas and sites. For the D&A value, we used a similar percentage as for the D&A for the plant, property, and Equipment for the 2018FY. When we combined the use of D&A percentage and the Capex, it resulted in the decline of the Net Book Value for the plant, Equipment, and property.
Capex Breakdown
Yearly D&A
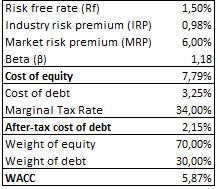
WACC Assumptions
For the discounting Free Cash Flow (FCFF), we employed the use of WACC technology, the initial rate was 5.74 percent in 2019, and it declined to 5.67 percent in 2023. The terminal value we are assuming is that BHP Company will have over 70 percent of equity and 30 percent debt. Beta was done concerning 200 mining firms and other S&P 500 indexes. We employed the risk-free rate for the 10-year Australian government bond because BHP Billiton is based in Australia. See the figure below for illustration (Northey, Mudd, and Werner, 2018).
5.0 Conclusion
BHP Billiton is a multinational company operating in the mining industry, and it is based in Australia. The company is a significant player in the mining sector, and it deals with products like precious minerals like copper, gold, nickel, among others. The company market is generally based in Asia, with China being one of the leading markets in the Asia region. However, China is slowing down in its demand while India is coming up at a higher speed. The main factors that act as the driving force are urbanization, population growth, and technology which keeps on driving the demands even to a higher level. From the profitability analysis, it is evident that BHP is performing very well compared to the industry average. That shows it is a good company to invest in since they have experience making the most out of the capital invested. From the global perspectives things seems to be very much favorable as most of the economies are recovering from the global pandemic, and the developing economies are also growing at an increasing rate which creates demand for the BHP Billiton products in the coming years. For instance, India is performing very well since 2018.
6.0 References
Australia’s resource industry – A look into the crystal ball | Speeches. (2019, June 5). Retrieved from https://www.rba.gov.au/speeches/2019/sp-so-2019-06-05.html
Bakker, R. M., & Shepherd, D. A. (2017). Pull the plug or take the plunge: Multiple opportunities and the speed of venturing decisions in the Australian mining industry. Academy of Management Journal, 60(1), 130-155.
Ivanova, G., Rolfe, J., Lockie, S., & Timmer, V. (2007). Assessing social and economic impacts associated with changes in the coal mining industry in the Bowen Basin, Queensland, Australia. Management of Environmental Quality: An International Journal.
Mayes, R. (2020). Mobility, temporality, and social reproduction: The FIFO family’s everyday rhythms are the Australian Mining Sector. Gender, Place & Culture, 27(1), 126-142.
Mudhar, D. (2019). The meaning of associate’s: An analysis of the outcomes commissioner of Taxation v BHP Billiton'(2019). Revenue Law Journal, 26(1), 1-12.
Northey, S. A., Mudd, G. M., & Werner, T. T. (2018). Unresolved complexity in assessments of mineral resource depletion and availability. Natural Resources Research, 27(2), 241-255.
Perez, F., & Sanchez, L. E. (2009). Assessing the evolution of sustainability reporting in the mining sector. Environmental Management, 43(6), 949-961.
Statsenko, L., Gorod, A., & Ireland, V. (2018). A supply network governance framework: a case study of the South Australian mining industry. Journal of Global Operations and Strategic Sourcing.
Street, T. D., Lacey, S. J., & Somoray, K. (2019). Employee stress reduced productivity, and interest in a workplace health program: A case study from the Australian mining industry—international journal of environmental research and public health, 16(1), 94.
Tyler, L., Busuttil, S., Rivieres, J., McCormack, N., McCuaig, T. C., & Terry, J. (2017). Value creation through exploration in BHP. AusIMM Bulletin, (Jun 2017), 52-55.
 write
write