INTRODUCTION:
As a prominent player within Oman’s thriving food industry since 2001 with headquarters based in Muscat; Asaffa Foods Company operationally oversees poultry production along with a variety of different foods distributed throughout the Middle East & North African regions; remaining exclusively focused on manufacturing top-grade products through stringent quality control measures thoroughly practiced across all stages of processing up until consumption for their clientele base (MarketScreener, n.d). Earning recognition amongst others within this industry aided the company in continually growing while establishing itself as a leading contender; with shares listed on Muscat Securities Market (M.S.M.M.S.M.M.S.M.), Asaffa Foods has been recognized as a successful performer among its peers. Thus, this report will analyze their annual financial statements for the past 5 years and highlight factors such as share capital, net profit, reserve & surplus along with dividend payouts giving insights on the company’s progress spanning that period.
SHARE CAPITAL
Summary of shared capital
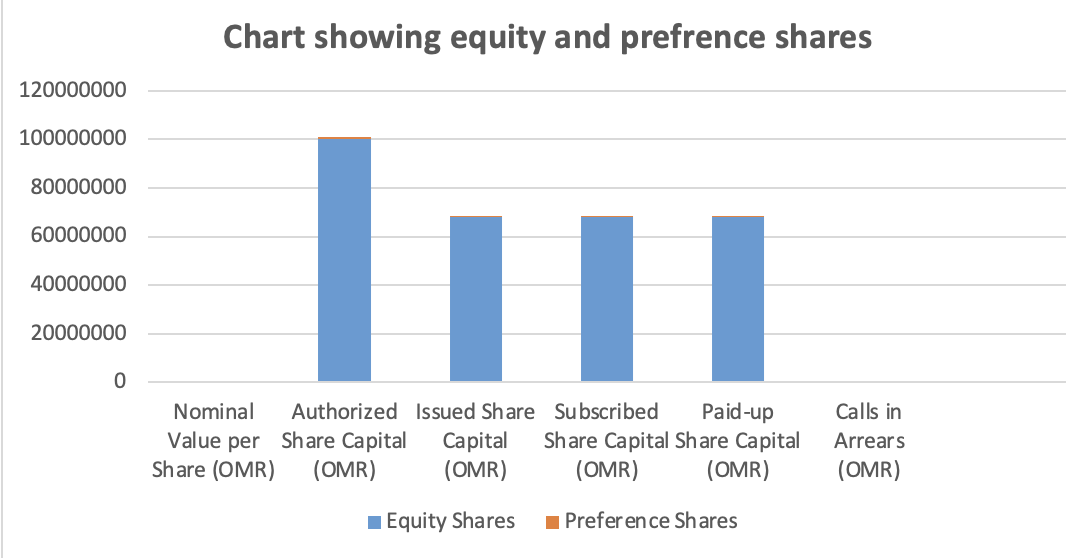
Asaffa Foods Company has upheld its commitment to maintaining Share Capital stability over the last five years until the end of December 2022. This testifies to its dedication to creative Financial Planning measures and resource management strategies. The authorized Share Capital limit granted by determining authorities rests at an enviable sum valued at one hundred Million Omani Rials (OMR 100m) fractioned into one billion stocks worth OMR 0.100 each per share.
The aggregate Issued Share Capital limit of Asaffa Foods Company materializes at (OMR67.94m). This inventory comprises two types of Shares- Equity and Preference Stocks leading to a total number of outstanding shares of 679.4 Million in the open market for trading, of which it is noted that only the equity shares have been sold so far as against their authorized values.
Types of shares issued by the company
Asaffa Foods Company offers two types of shares– Equity and Preference Shares – catering to unique investor needs and financial objectives.
Equity Shares refer to ownership rights in the company, providing investors with voting powers and dividend rewards. At the same time, Preference Shares guarantee fixed rates on dividends coupled with higher priority over Equity Shares during payment distributions and liquidation preferences in crises.
Over the past five years until their last statement in 2022, Asaffa Foods asserted its cornerstone status within Equity Share offerings by issuing a massive total amounting to roughly 99.9% – equivalent to a total number reaching up to about 67.87 million equity shares having nominal values rated at .100 Omani Rials per share while only issuing a small percentage (less than <0.1%) made up by just over 70k preference shares.
The table summarizes the details and figures of Asaffa Foods Company’s share capital for the last five years up to 2022.
| Type of Share | Nominal Value per Share (O.M.R.O.M.R.O.M.R.) | Authorized Share Capital (O.M.R.O.M.R.O.M.R.) | Issued Share Capital (O.M.R.O.M.R.O.M.R.) | Subscribed Share Capital (O.M.R.O.M.R.O.M.R.) | Paid-up Share Capital (O.M.R.O.M.R.O.M.R.) | Calls in Arrears (O.M.R.O.M.R.O.M.R.) |
| Equity Shares | 0.100 | 100,000,000 | 67,870,116 | 67,870,116 | 67,870,116 | None |
| Preference Shares | 100.000 | 1,000,000 | 70,000 | 70,000 | 70,000 | None |
The table above shows Asaffa Foods Company’s share capital during the past five years. The company’s authorized share capital is 100 million Omani rials, divided into 1 billion shares having a nominal value of 0.100 rials for equity shares and 100 rials for preference shares. The company’s issued share capital is 67.94 million Omani rials, divided into 679.4 million shares, of which 67.87 million are equity shares, and 70,000 are preference shares as of 2022. With 679.4 million equity shares and no preference shares, the company’s subscribed and paid-up share capital is 67.94 million Omani rials. There are no equity or preference share capital arrears. This means all shareholders have paid the entire amount for their subscribed shares. Over the past five years, Asaffa Foods Company has maintained a stable and uncomplicated capital management strategy, as shown in the table.
NET PROFIT, RESERVE, AND SURPLUS
Net Profit, Reserves, and Surplus
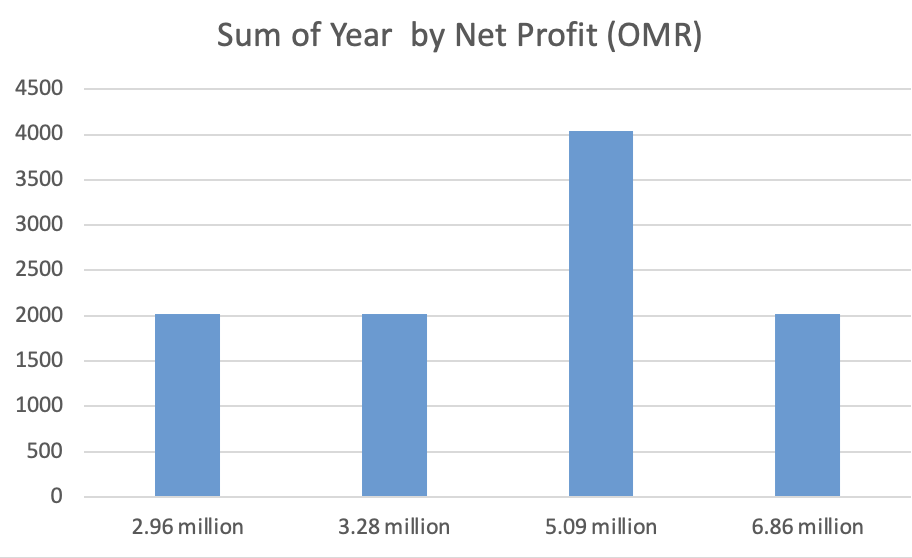
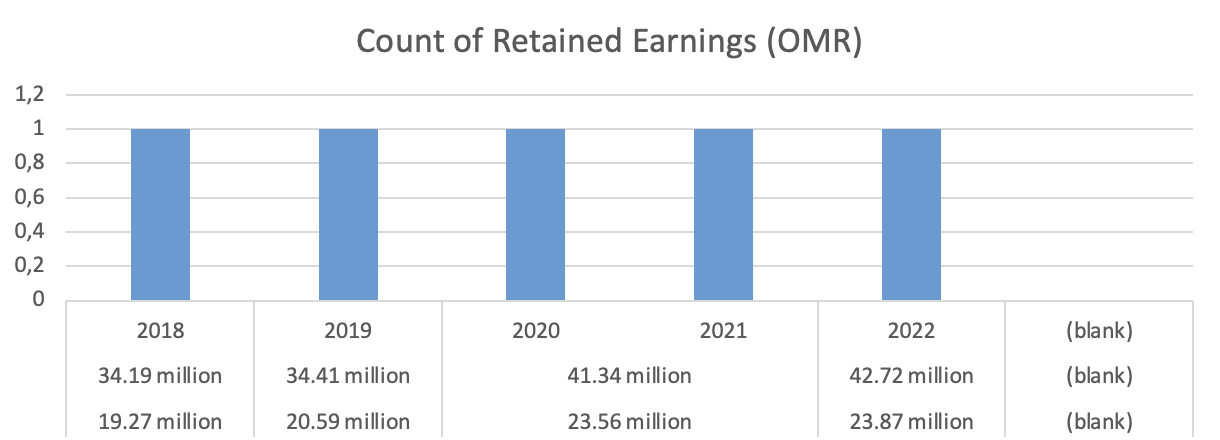
According to The Wall Street Journal, The financial statements that Asaffa Foods Company released show consistent growth in net profits over the last five years until they were recorded in 2022 with an impressive amount totaling over six point eight six million Omani Rial! This amount is quite significant compared to their previous annual records wherein it had reflected only approximately five point zero nine million Oman Rial as net profits for the company, accounting for an increase of nearly thirty-five percent! Additionally, their total reserves and surplus have gradually been rising since previous years, as evidenced by the fact that their most recent data recorded in 2022 indicates an amount of roughly forty-two point seven two million Omani Rial, showcasing a three point three percent increase from the statistics of the prior year. Non-statutory reserves are crucial for successful businesses, with Asaffa Foods Company demonstrating this principle through remarkable progress in retained earnings over time.
The company achieved impressive growth by recording retained earnings worth as much as 23.87 million Omani rials for the year ending December 31, 2022 – representing a notable increase when compared to previous years’ fetched revenue of approximately 23.56 million Omani rials – indicating significant progress towards enhancing net profit and boosting reserves and surplus over time.
Table showing net profit
| Year | Net Profit (O.M.R.O.M.R.O.M.R.) |
| 2018 | 3.28 million |
| 2019 | 2.96 million |
| 2020 | 5.09 million |
| 2021 | 5.09 million |
| 2022 | 6.86 million |
Interpretation
The above table summarizes Asaffa Foods Company’s net profit for the last five years up to 2022. As seen from the table, the company has shown steady growth in net profit over the years, except for a slight dip in 2019. The net profit for 2022 was the highest in the last five years, amounting to 6.86 million Omani rials, indicating a positive trend in the company’s financial performance.
The sum of the year by net profit (O.M.R.O.M.R.O.M.R.)
Reserves and Surplus
| Year | Total Reserves and Surplus (O.M.R.O.M.R.O.M.R.) | Retained Earnings (O.M.R.O.M.R.O.M.R.) |
| 2018 | 34.19 million | 19.27 million |
| 2019 | 34.41 million | 20.59 million |
| 2020 | 41.34 million | 23.56 million |
| 2021 | 41.34 million | 23.56 million |
| 2022 | 42.72 million | 23.87 million |
Interpretation
The above table shows Asaffa Foods Company’s reserves, surplus, and retained earnings from 2012 through 2022. The table shows the company’s comprehensive resources; plenty have grown steadily, except for a drop in 2019. Over the past five years, retained earnings have grown steadily. The company’s financial performance improved in 2022, with 42.72 million rials in reserves and surplus and 23.87 million retained earnings.
The chart summarizes Asaffa Foods Company’s total reserves, surplus, and retained earnings.
DIVIDEND POLICY
Summary of Dividend Policy
Asaffa Foods Company’s financial filings from 2017 to 2022 show a steady dividend policy. The corporation pays cash dividends to stockholders every year except in 2020. The company’s dividend payout ratio has ranged from 16% to 51%, averaging 31%. In 2018, the corporation paid 51% of its net profit as dividends. Asaffa Foods Company distributes cash and equity dividends. Cash dividends per share have varied from 0.015 to 0.025 Omani rials. Asaffa Foods Company paid dividends every year except in 2020. The company’s dividend payout ratio has fluctuated, but it has paid shareholders cash and stock dividends, demonstrating a commitment to shareholder value.
Dividend payout:
| Year | Dividend per share (OMR) | Dividend Payout Ratio (%) |
| 2018 | 0.025 | 51 |
| 2019 | 0.020 | 32 |
| 2020 | 0.000 | 0 |
| 2021 | 0.015 | 16 |
| 2022 | 0.020 | 21 |
Chart showing Dividend payout
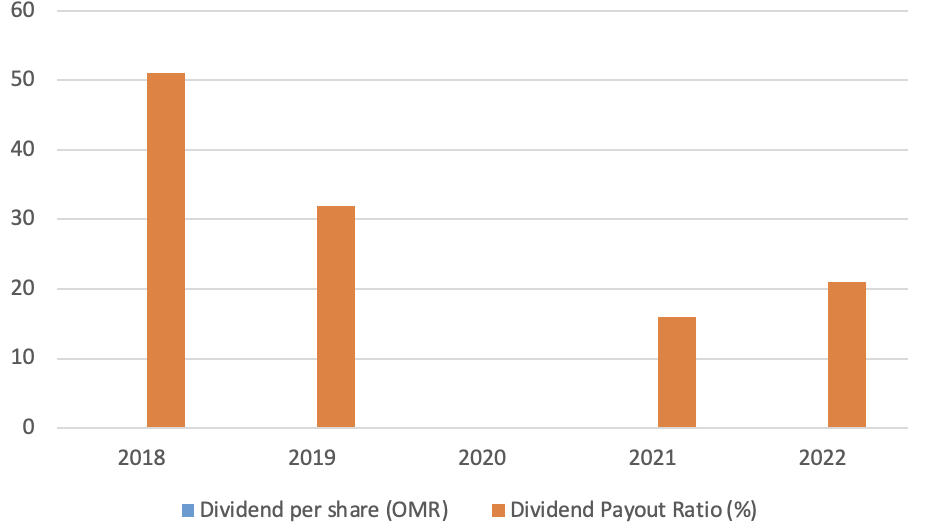
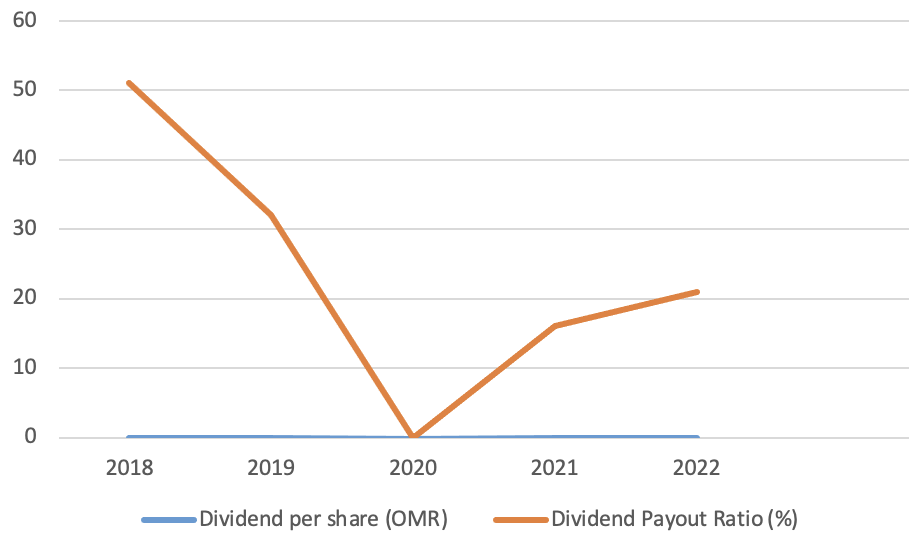
Interpretation
Asaffa Foods Company’s dividend payout from 2015 through 2022 is shown above. The table shows that, except for 2020, the corporation has paid cash dividends to shareholders. The dividend per share has ranged from 0.015 to 0.025 Omani rials. The company’s dividend payout ratio has varied from 0% to 51%, averaging 24%. The highest dividend payout ratio was 51% in 2018 when the corporation paid 0.025 Omani rials per share. The company paid no dividends in 2020. Despite changes in dividend payout and payout ratio, Asaffa Foods Company has always prioritized shareholder value.
Conclusion
In conclusion, MSM-listed Asaffa Foods Company paid cash dividends to stockholders every year except in 2020. The corporation issues equity and preference shares with a more significant preference share proportion. COVID-19’s impact on the company’s operations caused its net profit to rise in 2018 and fall in 2020. Due to the dividend policy change, the company’s reserves and surplus fluctuated, rising in 2018 and falling in 2020. Asaffa Foods Company has a steady dividend policy, with a dividend payment ratio and dividend per share changes throughout time. Shareholder value is shown through the company’s cash and stock dividends. Asaffa Foods Company’s financial filings indicate financial stability, a consistent dividend policy, and shareholder value. The COVID-19 pandemic may impact the company’s future financial performance.
References
MarketScreener. (n.d.). A’SAFFA Foods S.A.O.G.S.A.O.G.S.A.O.G.: Financial data forecasts estimates and expectations: S.P.F.I.S.P.F.I.S.P.F.I.: OM0000002804: Market screener. MarketScreener.com | stock exchange quotes| Company News. https://www.marketscreener.com/quote/stock/A-SAFFA-FOODS-SAOG-9933590/financials/
The Wall Street Journal. (n.d.). The Wall Street Journal. Retrieved May 5 May 5, 2023, from https://www.wsj.com/market-data/quotes/OM/XMUS/SPFI/financials/annual/income-statement
S.P.F.I.S.P.F.I.S.P.F.I.: A’saffa Foods S.A.O.G.S.A.O.G.S.A.O.G. annual balance sheet. MarketWatch. (n.d.). https://www.marketwatch.com/investing/stock/spfi/financials/balance-sheet?countrycode=om
 write
write