Introduction
The dynamic subject of public health study provides insights into the intricate relationship of lifestyle choices and mental health. This study explores the National Health Interview Survey (NHIS) to better understand the relationship between adult U.S. yoga practitioners’ practices and their degree of anxiety, depression, and anxiety as part of the Public Health Research Methods course. It becomes more and more important to comprehend the possible effects of yoga and other such activities on mental health in the context in a society struggling with the difficulties of contemporary life. “How do anxiety and depression levels differ between adults in the United States practicing yoga in the last 12 months and those who did not, and how does this vary by gender?” is the main research question driving this investigation. This question sets the stage for a nuanced exploration, seeking to bridge the gap between the burgeoning interest in holistic well-being and the empirical evidence available through extensive survey data.
This data brief examines the connection between yoga, anxiety, and depression among adult Americans using information from the National Health Interview Survey (NHIS) for 2022. Understanding the relationship between exercises in yoga and anxiety and depression levels is crucial as mental health becomes more and more important. Only sixteen percent of NHIS respondents said they had done yoga in the previous year, suggesting there may be a deficiency in the use of this holistic exercise for mental health. In the context of inequities in mental health, this brief seeks to identify significant trends and implications.
Research Question and Analysis Plan
Using information from the 2022 National Health Interview Survey (NHIS), our study attempts to explore the association between yoga practice, anxiety, and depression among adults in the United States. “Among U.S. adults, how do depression and anxiety levels differ between those practicing yoga over the last 12 months and those who did not, and how does the difference differ by gender?” is the main study question that directs our research. This inquiry aims to identify any possible links between practicing yoga and mental health, with a particular emphasis on gender differences in this regard.
The outcomes section, a skillfully constructed narrative that reveals the story concealed behind the statistics, is the focal point of the data brief. This part, which is based on the results of our statistical analysis, uses simple language to express the main ideas of our findings. We provide transparency and enhance the validity of our findings by involving the reader in the procedure of analysis through the inclusion of SPSS output and syntax (Alam et al., 2021). The results of the significance tests are displayed in at least one figure, and another provides an overview of the descriptive statistics that describe those involved in our study. Visualizations are the main attraction. These graphics are not only pictures; they are understanding tools that contribute to making it easy for viewers to understand intricate statistical details.
It take a step beyond statistics and add the skill of communication to our approach. For clarity, variables are going to be adjusted and recoded, and crosstabulations will offer a thorough analysis of the connections between significant variables. In addition to helping to clarify complicated patterns, representations like bar charts will be essential parts of an oral presentation intended for community audiences and a data brief. Our approach continues to be based on flexibility, which enables us to adjust to the changing nature of the data and skillfully handle any obstacles. I hope to add to the academic discourse as well as the larger conversation on mental health in the communities we serve by integrating the complex components of our research question and analysis strategy.
Dissemination #1 – Data Brief
Our project will use the NHIS dataset in conjunction with a solid analysis plan to address our research topic. Our analysis’s weighting variable, “NHISWEIGHT,” guarantees that the outcomes we give are typical of the larger adult population in the United States. The respondents’ participation in yoga (“YOGA12MO”), anxiety levels (“ANXIETY”), experiences with depression (“DEPRESSION”), age (“AGE”), and gender (“GENDER”) are the main factors we selected for study as selected in the data below.
| Anxiety (M+F) | Practice yoga (%) | Depression (M+F) | Practice yoga (%) | |||
| Yes | No | Yes | No | |||
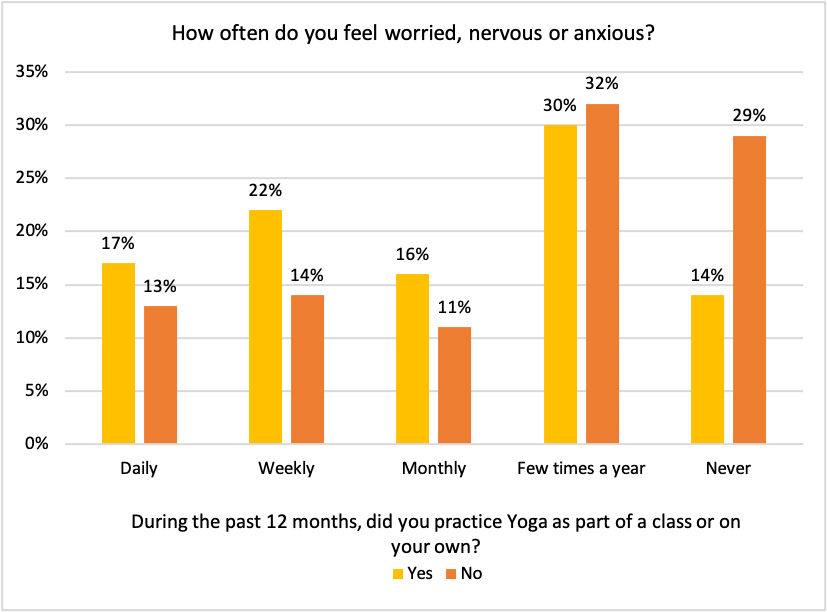
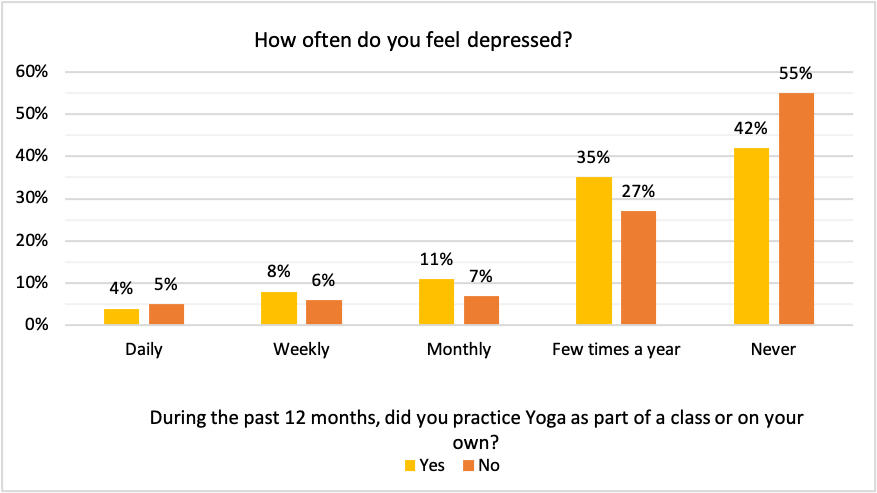
| Daily | 17% | 13% | Daily | 4% | 5% | |
| Weekly | 22% | 14% | Weekly | 8% | 6% | |
| Monthly | 16% | 11% | Monthly | 11% | 7% | |
| Few times a year | 30% | 32% | Few times a year | 35% | 27% | |
| Never | 14% | 29% | Never | 42% | 55% | |
| Anxiety (M) | Practice yoga (%) | Depression (M) | Practice yoga (%) | |||
| Yes | No | Yes | No | |||
| Daily | 12.3 | 10.9 | Daily | 3.1 | 3.6 | |
| Weekly | 20.3 | 13 | Weekly | 7 | 5.7 | |
| Monthly | 15.7 | 10.7 | Monthly | 9.9 | 5.8 | |
| Few times a year | 31.2 | 31 | Few times a year | 33.9 | 24.8 | |
| Never | 20.5 | 34.4 | Never | 46.1 | 60.1 | |
| Anxiety (F) | Practice yoga (%) | Depression (F) | Practice yoga (%) | |||
| Yes | No | Yes | No | |||
| Daily | 19.4 | 15.8 | Daily | 3.7 | 5.5 | |
| Weekly | 23.2 | 15.6 | Weekly | 8.1 | 6.8 | |
| Monthly | 16.3 | 12.1 | Monthly | 11.8 | 9 | |
| Few times a year | 29.3 | 32.6 | Few times a year | 36 | 30.2 | |
| Never | 11.7 | 23.9 | Never | 40.5 | 48.4
|
|
| Practice yoga | Daily, weekly, monthly anxiety | Few times a year | Never | Total |
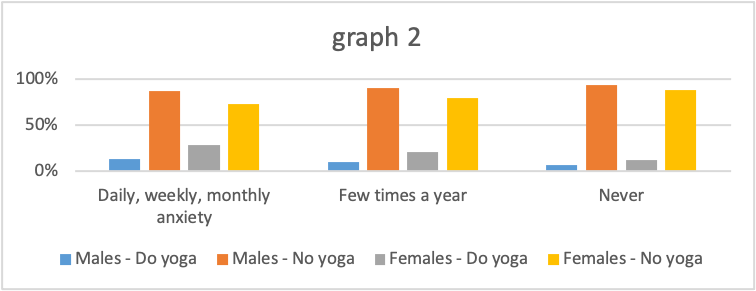
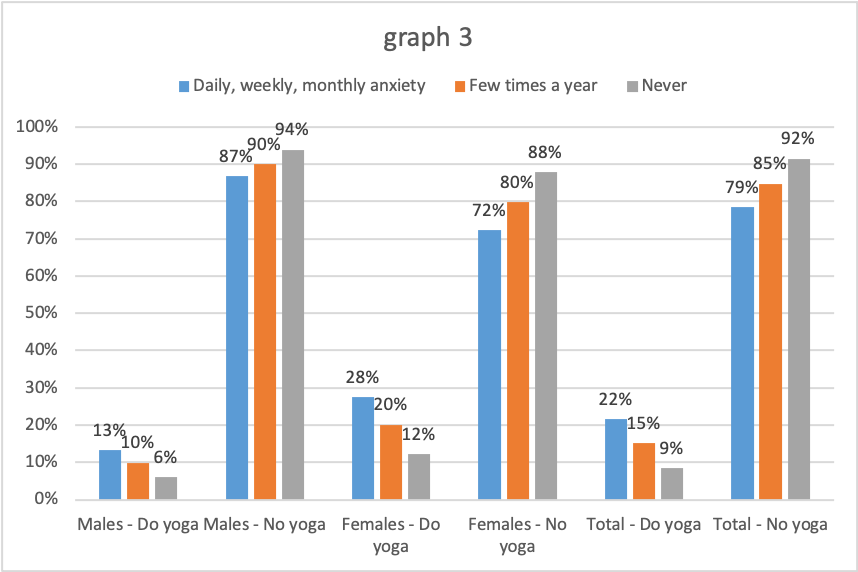
| Males – Do yoga | 13% | 10% | 6% | 10% |
| Males – No yoga | 87% | 90% | 94% | 90% |
| Females – Do yoga | 28% | 20% | 12% | 22% |
| Females – No yoga | 72% | 80% | 88% | 78% |
| Total – Do yoga | 22% | 15% | 9% | 16% |
| Total – No yoga | 79% | 85% | 92% | 84% |
| Practice yoga | Daily, weekly, monthly depression | Few times a year | Never | Total |
| Yes | 13% | 13% | 8% | 10% |
| No | 87% | 87% | 92% | 90% |
| Yes | 24% | 25% | 19% | 22% |
| No | 76% | 75% | 81% | 78% |
| Yes | 19% | 20% | 13% | 16% |
| No | 81% | 80% | 87% | 84% |
Age will be recoded into two categories: those under 65 and those 65 and over. Age is an important contextual element. A more thorough investigation of age-related trends in mental health outcomes is made possible by this recoding. To guarantee a clear and thorough study, we shall set any missing or unclear values in terms of data manipulation.
The data brief goes beyond the realm of statistics as I make my way to the debate, consequences, and call for action, exploring the real-world implications of our results for health care practice and policy. The conversation highlights the “so what” and “now what” for the reader, summarizing the main takeaways (Page et al., 2020). It provides light on the study’s wider ramifications and responds to queries that might have crossed the minds of anyone trying to comprehend the real-world meaning of our findings. References become crucial to enhancing our story because they provide the theoretical foundation for our observations.
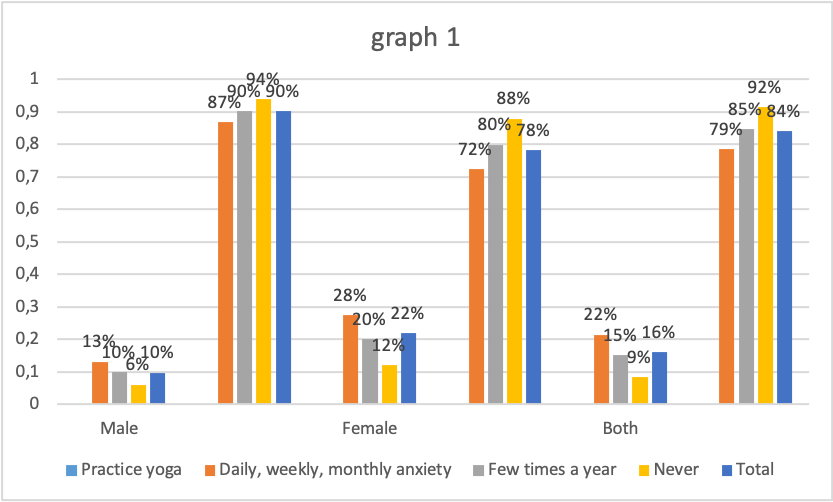
Among men who practice yoga, 13% say they feel anxious every day, every week, or every month, while 10% and 6% say they feel anxious seldom or never at all. These statistics apply to males who do not practice yoga: 87%, 90%, and 94%. For females, the pattern is different: 28% of yoga practitioners say they experience anxiety on a daily, weekly, or monthly basis, while 12% all non-practitioners report the same symptoms. The equivalent data for females who do not practice yoga are 72%, 80%, and 88%. Anxiety was expressed by 22% of respondents who practiced yoga overall, in contrast with 16% of respondents who did not.
dissemination #2 – Recorded Oral Presentation
When creating our recorded oral presentation, we hope to provide a thorough summary of our data brief, revealing the complex relationships between yoga, anxiety, and depression in adult Americans. First, we highlight how common yoga involvement is in our NHIS dataset, which shows that 16% of respondents had done yoga on a regular basis in the past year. This figure provides an important context, encouraging the audience to consider the possible effects of this behavior on mental health.
Among yoga practitioners, 13% report having depression on a daily, weekly, or monthly basis, whereas 8% to 10% report having depression seldom or never. The proportions that correspond for people who do not practice yoga are 87%, 87%, and 92%. Once more, there is a difference in the pattern: among female yoga practitioners, 24% report daily, weekly, or monthly depression, as opposed to 19% for non-practitioners. The rates for females who are not doing yoga are 76%, 75%, and 81%. 22% of respondents who practice yoga overall reported having depression, compared to 16% of users who do not practice yoga.
As we move on to our main conclusions, we examine the high levels of worry that NHIS participants experienced. Remarkably, 42% of participants said they felt anxious at least once a day, once a week, or once a month. The gender differences are especially striking—47% of women and 31% of men, regardless of yoga practice, report experiencing anxiety. These percentages will be graphically represented by visual aids like bar charts, which will provide the audience with an easily comprehensible grasp of the prevalence of anxiety in various demographic categories.. The data brief’s pivotal figures have been repurposed to operate as visual aids, augmenting the audience’s understanding of the principal patterns and noteworthy distinctions uncovered throughout our research (lee et al.,, 2019).
As we move on to our main conclusions, we examine the high levels of worry that NHIS participants experienced. Remarkably, 42% of participants said they felt anxious at least once a day, once a week, or once a month. The gender differences are especially striking—47% of women and 31% of men, regardless of yoga practice, report experiencing anxiety. These percentages will be graphically represented by visual aids like bar charts, which will provide the audience with an easily comprehensible grasp of the prevalence of anxiety in various demographic categories. As we move on to our main conclusions, we examine the high levels of worry that NHIS participants experienced. Remarkably, 42% of participants said they felt anxious at least once a day, once a week, or once a month. The gender differences are especially striking—47% of women and 31% of men, regardless of yoga practice, report experiencing anxiety. These percentages will be graphically represented by visual aids like bar charts, which will provide the audience with an easily comprehensible grasp of the prevalence of anxiety in various demographic categories.
Within the constraints of time, my talk will make a significant contribution through incorporating a conversation that will not only explain our results but also turn them into practical recommendations for public health. Our goal as I start this oral distribution journey is to encourage participation, inquiry, and reflection among our community audience, not just to pass on knowledge.
Conclusion
At the end of our investigation on the link between yoga, anxiety, and depression in adult Americans, our data summary and audio presentation serve as cooperative knowledge-sharing lights. We analyzed the complicated connection between holistic practices and mental health outcomes via the National Health Interview Survey (NHIS), condensing the results into formats that are understandable for a general public. The data brief leads readers through the relevance of our research and invites them to consider the complex relationships we unearthed with its captivating tale and visual storytelling.
This recorded oral presentation serves as a conduit, bridging the gap between complex investigations and collective comprehension, as we move from statistical studies to community engagement. We not only outline our results in a brief five-minute presentation, but additionally also discuss the consequences and possible next steps for the public health system as a whole. This multifaceted approach represents the transformative power inherent in research that communicates directly to the communities it seeks to serve by fusing the rigor of statistical inquiry with the art of successful communication. Our conclusion serves as a starting point rather than a destination, encouraging discussions, introspection, and, perhaps, concrete actions that will promote mental health among the different members of the community.
REFERENCES
Alam, M. K. (2021). A systematic qualitative case study: questions, data collection, NVivo analysis and saturation. Qualitative Research in Organizations and Management: An International Journal, 16(1), 1-31.
Lee, G., Deng, Z., Ma, S., Shiratori, T., Srinivasa, S. S., & Sheikh, Y. (2019). Talking with hands 16.2 m: A large-scale dataset of synchronized body-finger motion and audio for conversational motion analysis and synthesis. In Proceedings of the IEEE/CVF International Conference on Computer Vision (pp. 763-772).
Page, B. F., Hinton, L., Harrop, E., & Vincent, C. (2020). The challenges of caring for children who require complex medical care at home:‘The go between for everyone is the parent and as the parent that’s an awful lot of responsibility’. Health Expectations, 23(5), 1144-1154.
 write
write