Introduction
Data collection at the beginning of the game is significant as it results in profitability at the end of the trading day. The intrinsic value of an asset should be analyzed to identify the factors likely to influence the price in the future market. The fundamental analysis of the market can be carried out using various tools, including top-down analysis, which takes a wider view of the economy, starting from the entire market, then down into the sector, industry and lastly to a specific company. Also, the bottom-up analysis starts with analyzing a specific stock as it widens to consider the factors that affect the price. Through fundamental analysis, traders can gather the right information to help them make rational decisions regarding financial data and avoid biases. Fundamental analysis helps in understanding the right time that one can either enter or exit the market. The analysis is significant as it can help one decide on their stocks’ holding period.
Therefore, at the end of the first phase, I attained a profit at the end of the trading day without borrowing money, with healthy reserves, solid returns, gains, positive net worth, and sufficient earnings to cover expenses. This success was attributed to the ability to make better analyses and decide when to make strategic trade. The profit in the first phase resulted from a critical analysis of the securities before investing in them. In the second phase, an analysis is also taken considering how those securities have evolved to date to help make the right investment decisions. Similar to the previous securities selected, the securities are analyzed before purchasing.
In the second phase of this stimulation, I selected DIS, ETSY, SQ and TQQQ shares. The DIS securities offered by Walt Disney Co. DIS securities attain a high stock price of 126.48, averaging 29% above the price of the share currently. The lowest stock price of DIS for 52 weeks was 8.07, which was 14.2% below the share price currently. The DIS average price for 52 weeks was allowed at 101.59. currently, the price of DIS shares is 96.95, 0.35%. ETSY security’s highest stock price over 52 weeks was 149.91, 52.4% above the price of the current shares. Etsy lowest price for 52 weeks was 67.01, which was 31.9 % below the price of the current shares. Etsy has had an average price of 107.17 over the last 52 weeks. The current price of Etsy Inc securities is 99.70, which is 1.97%.
SQ securities are offered by Block Inc company. The Block stock attained the highest price in 2021, which was 281.81. The highest block 52 weeks stock price was 110.44, 81% above the current price of shares. The lowest block 52 weeks stock price is 51.34, which is 15.8% below the price of the current shares. The average block stock price for the last 52 weeks is 70.68. The current price of the block stock is 60.84 averaging 0.45%. TQQQ shares are offered by pro shares Ultrapro QQQ. The shares attained the highest price of 42.73 for the last 52 weeks, 16.10%. The lowest price for the last 52 weeks was 26.39, 25.51 %. The current price of the security is 26.01, which is an average of 1.52%.
I used various trading strategies, where I analyzed stock selection. To help me diversify risk. Security analysis helps determine the more desirable and profitable securities before making any selection on the securities to investors. I made some selections based on their earning ratio and the net profit margin. Before selecting, I considered their market capital and the number of dividends they produce. I used the price earning to differentiate the securities that are undervalued and those that are overvalued in the market. The undervalued securities have a lower price-earning ratio as compared to other firms. The best securities are from the firms with a higher net profit margin as the firm meets all the operating costs without experiencing any difficulties, which implies that the firm will continue giving the dividend as required (Bacon, 2023). Therefore, while selecting the best securities, one should consider more than just the basis of the anticipated returns and the security risk. Rather, one should consider the security analysis to determine its value.
Before deciding to buy the securities, I considered the company’s financial statement, which reviews its backbone. Trading with companies has good health in terms of their financial margin as they guarantee security. A good company to invest with should have a prospect as it has increased demand (Bacon, 2023). The financial records of the company should show progress.
To ensure the success of the investment and to be able to achieve the desired results, I invested in various securities providers. Investing all the amount in one security is risky since the act may affect the whole investment return in case of an unfavourable outcome. I used the asset allocation strategy in deciding on the proportion to be invested in each security to create room for a diversified risk. The effect of diversification should be considered when comprising the portfolio as it will help reduce the risk that may be likely to occur (Wang et al., 2019). Having more than one security helps maintain the financial position in a loss, as well as make more investments where one only gets the profit. Personal goals are reflected at any time by having an asset mix in your portfolio, which includes cash, stock, and bonds, hence should be appropriately established.
I usually consider the stock chart when deciding when to trade my securities and the price. As I read the stock chart, it shows the present and the past prices of various securities. The stock chart tells me what is happening in the broader securities market. The stock chart will enable me to determine when the price has started to increase so that I can make decisions on sales of the securities as well as when the price is dropping. The time and price of securities trading can only be made perfect using the stock chart.
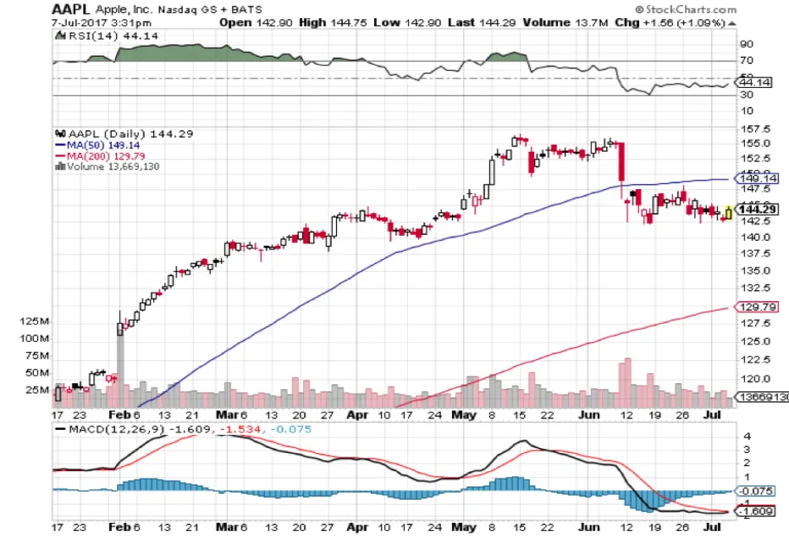
The chart is known as a candlestick chart, where the white candles indicate the stock days while the red candles indicate the down days. As I used the stock chart to know when and at what price I should trade my securities, I considered how the stock was moving. When the stock went higher and began to have a strong uptrend that seemed to last for long, I decided to buy my securities. For example, in the chart above, on February 1st, a large spike in volume occurred, and the stock gap was higher, which lasted until June. The best time to sell my securities is when I notice the stock movement has started downward (Lee et al., 2019). I decided to sell my securities then, depending on the available price. For example, in the graph, the red volume bars indicate days that there was a greater amount of selling than the volume of buying, which occurred due to the downward movement of the stock on June 12th.
Good analysis of the securities is significant as it helps choose the securities. As one decides to invest in various types of security, it is wise to seek knowledge concerning the trend of those shares. Good decision-making and analysis result in achieving a tremendous profit. Various securities have ways in which they evolved until where they started being known in the market. The analysis required in deciding on the securities involved analyzing stock selection. It is recommendable for one always to consider the securities from a well-developed firm so that they can be guaranteed to receive dividends. It is good to analyze the security of the services where one can consider having a portfolio that trades securities to different providers. In order to determine the time and price to carry out trade on your security, one should use the stock chart as it provides all the required information in the decision-making.
References
Bacon, C. R. (2023). Practical portfolio performance measurement and attribution. John Wiley & Sons.
Wang, N., Zhu, S. P., & Elliott, R. J. (2021). Optimal asset allocation under search frictions and stochastic interest rate. Quantitative Finance, pp. 1–15.
Lee, J., Kim, R., Koh, Y., & Kang, J. (2019). Global stock market prediction based on stock chart images using deep Q-network. IEEE Access, 7, 167260-167277.
 write
write