Executive Summary
The report examines the economic indicators of the inflation rate, unemployment rate, and real GDM (Gross Domestic Product) in the context of the COVID-19 pandemic. It highlights how the pandemic has significantly impacted these indicators, resulting in unprecedented levels of economic disruption and job losses. Policymakers should be concerned about unemployment, inflation, and the economy’s growth as they are key indicators of a country’s economic health, affecting the well-being of citizens, businesses, and overall socio-economic development.
The effects of increasing global energy costs on the economy in the aftermath of the epidemic are also analyzed in this research. It discusses how energy prices are a key determinant of inflation and how the recent increases could lead to a further rise in inflation, thus affecting the overall economic recovery. It also discusses how recent energy price increases could lead to a further rise in inflation.
The problems created by the post-pandemic economy and increasing energy costs are addressed in the paper, which includes suggestions for politicians and companies to solve these issues. It highlights the necessity of a coordinated effort to invest in renewable energy sources and infrastructure to reduce reliance on fossil fuels, as well as targeted policies to support job creation and economic growth. This is in addition to the fact that it emphasizes the importance of reducing reliance on fossil fuels.
Business cycle
The business cycle describes the recurring pattern of economic expansion and contraction activities over time, characterized by fluctuations in real GDP, employment, inflation and other macroeconomic indicators. The cycle’s four phases are expansion, peak, contraction(recession) and recovery.
During the expansion phase, the economy grows, and economic indicators such as Gross Domestic Product (GDP), employment and consumer spending rise. The phase is often related to increased business investment and consumer confidence (Baldwin & Di Mauro, 2020 ). The peak phase marks the end of the expansion phase and is characterized by the highest economic growth point before the economy slows down.
The third phase is the contraction or recession phase, where the economy starts to slow down, and economic indicators begin to decrease. The phase is associated with increased unemployment and a decrease in consumer spending businesses reach the trough, the lowest point of economic growth before the economy starts recovering (Mitchell, W. C. (2022). The recovery phase is when the economy emerges from the recession or contraction phase towards expansion. During recovery, there is an increase in economic activity, including rising levels of unemployment, production and consumer spending. The economic indicator that tracks the business cycle phases is Gross Domestic Product (GDP).
The following diagram illustrates the phases of the business cycle:
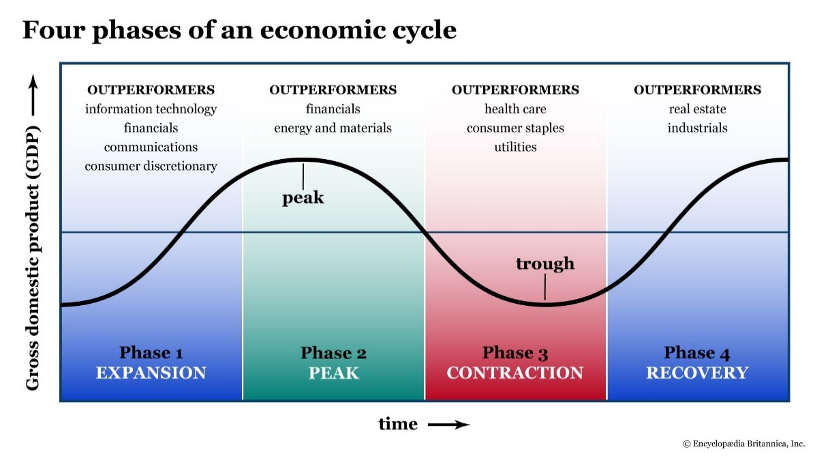
The graph shows Gross Domestic Product on the vertical axis and time on the horizontal axis. The line graph shows the fluctuations in GDP over time. An upward slope characterizes the GDP time expansion phase, the GDP line’s highest point; the contraction phase by a downward slope, and the recovery phase by an upward slope marks the peak phase.
Following the macroeconomic theory, during the expansion phase, unemployment tends to decline as businesses increase hiring to meet the rising demands. Inflation starts arising as demand increases, and suppliers start facing capacity constraints. During the peak stage, unemployment increases as businesses cut back on hiring and production. Inflation may also start to spike as capacity constraints become more binding. During the contraction phase, unemployment rises sharply as enterprises cut back on production and employment. Inflation starts slowing down as demand declines. Finally, unemployment remains high in the recovery phase, but inflation may increase again as companies and businesses begin to ramp up production in response to increased demand.
Real GDP growth rate
Real Gross Domestic Product (GDP) is a macroeconomic measure of the value of all goods and services produces a macroeconomic scale of the value of all goods and services produced in a country, adjusted for inflation. GDP reflects a country’s economic output, and changes in its growth rate indicate the economy’s health (Bekaert et al.,2020). Real Gross Domestic Product is calculated using a formula that adjusts the nominal GDP for changes in the price level, which is known as the GDP deflator( Australian Bureau of Statistics,2022).
Real GDP= Nominal GDP/Deflator
Real GDP growth rate = (Real GDP in the current year-Real GDP from the previous year)/Real GDP in the previous year * 100%
Economists use Real GDP as the scale of economic activity because it covers changes in production levels and provides a basis for making comparisons across time and between countries. In addition, Real GDP is often used as a proxy for measuring a country’s citizens’ standard of living and economic well-being.
Nevertheless, Real GDP has drawbacks as a measure of economic prosperity and well-being. GDP does not account for non-market transactions, such as volunteer work and household produce, and it does not capture changes in the distribution of income or the quality of life factors such as environmental quality, health and education. Focusing on GDP growth can also lead to a narrow view of economic development that overlooks important social and environmental considerations.
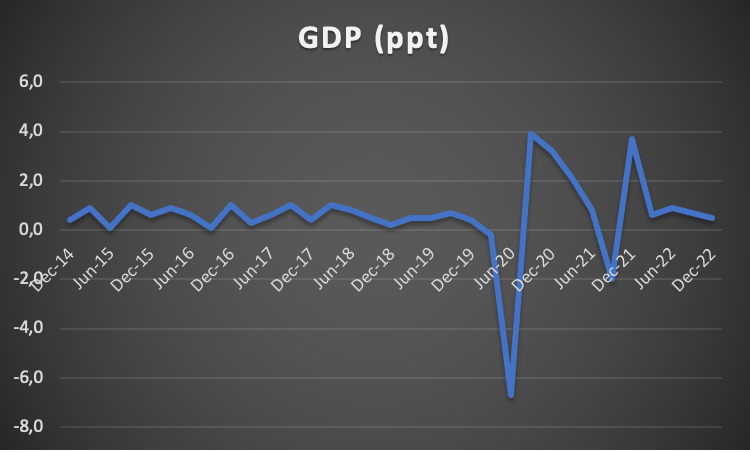
The COVID-19 pandemic had a significant impact on many economies. An analysis of the Australian economy was conducted, as shown above. The economy experienced a contraction in March and June 2020, with real GDP growth rates of -0.2% and -6.7%, respectively ( Australian Bureau of Statistics,2022). These contraction periods are recessions, the technical definition of a decrease in economic activity lasting at least two consecutive quarters.
Following the recession, the Australian economy began recovering in September 2020 with a GDP growth rate of 3.9%. The recovery continues through December 2020 and March 2021, with real GDP growth rates of 3.2% and 2.1%, respectively. Nevertheless, the Australian economy experienced a contraction in June and September 2021, with real GDP growth rates at 0.8% and -2.0%. In June and September 2022, the GDP rate remained steady at 0.9% and 0.7%, respectively.
The rising energy prices may hurt the country’s economic growth rate. If the energy prices continue to rise, it could lead to an increase in the cost of production for businesses and reduce the disposable income of consumers. This could decrease consumer spending, lower business investment and slow economic growth.
The contractionary phase that occurred during the COVIS pandemic had a more significant impact on the real GDP growth rate than the impact of rising energy prices. The pandemic resulted in a sharp decrease in economic activity, with Real GDP declining to -6.7% in June 2020. The rising energy prices could have contributed to the contraction in June and September 2021, but the impact was relatively lower than during the pandemic( Australian Bureau of Statistics,2022). The real GDP growth rate was -2& in September 2021, above the contraction rate of June 2020. In conclusion, the pandemic had a more significant impact on the Real GDP growth rate than the impact of rising energy prices.
Unemployment
The unemployment rate is a measure that represents a percentage of the labour force that is currently unemployed and seeking employment. The labour force includes all people who are employed and actively seeking employment. The unemployment rate is calculated using the formula:
Unemployment Rate= Unemployed people/Labor Force * 100%
Unemployed people are individuals who are not currently employed but are actively seeking employment, and The labour force includes the employed and unemployed people seeking employment. Unemployment is a cause for concern for policymakers because it has considerable implications for people’s well-being and the overall health of the economy ( Australian Bureau of Statistics,2022).
Unemployment has consequences, for instance, financial hardship, social exclusion and lower overall life satisfaction. Additionally, unemployment can lead to a loss of skills and reduced employability, which can have long-term consequences for a person’s earning potential and well-being. From an economic perception, high levels of unemployment can lead to a decline in consumer spending and a reduction in economic growth. This can therefore result in a vicious cycle, as businesses may lay off more workers leading to even higher levels of unemployment. Policymakers aim to maintain a low and stable level of unemployment to promote overall economic stability and improve individual welfare.
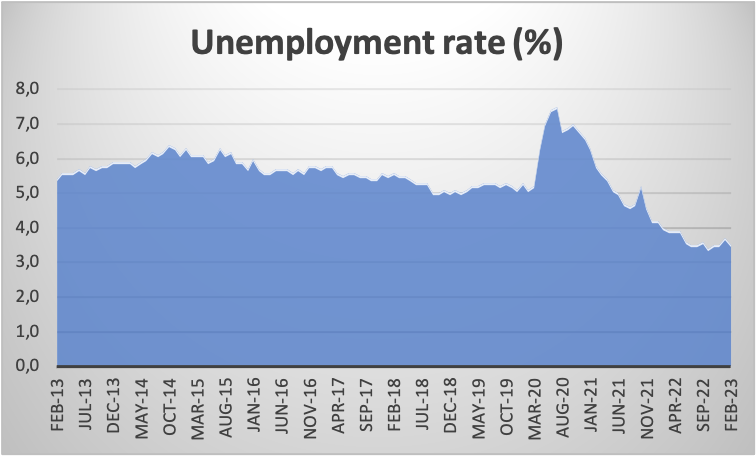
As shown in the graph above, the unemployment rate in Australia experienced significant fluctuations over the years. The graph identifies that:
- During the pandemic: The unemployment rate increased greatly from 5.2% in February 2020 to 7.5% in July 2020. This significant rise could be attributed to the economic disruption caused by the COVID-19 pandemic, which led to business closures and job losses. Additionally, the unemployment rate continued to be high in the following months, reaching 6.6% in December 2020, and it took until May 2021 for the rate to decline to 5.1%.
- During the post-pandemic recovery stage: The unemployment rate reduced in 2021, indicating a gradual recovery of the economy. This decrease continued until October 2021, when the rate was 5.2%, but it increased again in November 2021 to 4.6%. Nevertheless, it is vital to note that the unemployment rate has decreased since May 2021, indicating a slow but steady recovery.
- As a consequence of rising energy prices: There has been no direct impact on the unemployment rate in the provided data. Nevertheless, it is important to note that rising energy prices can indirectly impact the economy, affecting the demand for goods and services, which can lead to an increase in the unemployment rate.
Regarding the severity of unemployment rate fluctuations in Australia, the pandemic had the most impact, with the rate reaching 7.5% in July 2020. The recovery stage has been slower, with fluctuations of approximately 1%. The unemployment rate has not returned to normal before the pandemic.
Regarding the impact of discouraged jobseekers and workers unable to work due to family responsibilities, the unemployment rate may not be a precise index of the labour market’s health. Discouraged jobseekers are not counted in the unemployment rate, and workers unable to work due to responsibilities in the family are counted out of the labour force. ( Australian Bureau of Statistics,2022). Hence, it is vital to monitor other macroeconomic indicators, such as the labour force participation rate, which provides information on the percentage of the working-age population that is either employed or actively looking for employment. This indicator provides a better understanding of the labour market’s health and ability to absorb job seekers.
Inflation Rate
Inflation is the persistent increase in the general price level of goods and services in an economy over time. Economists use the Consumer Price Index (CPI) to find the inflation rate. The Consumer Price Index measured the average change in prices paid by consumers for a basket of goods and services over time. The formula used to calculate the inflation rate is:
Inflation Rate= (Current CPI – Previous CPI)/previous CPI *100%
For instance, if the CPI was 200 last year and it is 205 this year, the inflation rate would be calculated as follows: (205-200)/200*100 =5%
The consumer price index is used as a proxy for the cost of living as it measures the price changes of commonly purchased products. CPI is calculated by tracking the prices of products, such as food, housing, transportation and healthcare, which are weighted according to their relative importance in a typical household’s budget.
Inflation is a concern for policymakers because of its negative implications on people’s well-being. When prices rise quickly, consumers struggle to afford the goods and services they need, which can reduce their living standards. In addition, inflation can corrode the value of people’s savings and reduce the purchasing power of their income( Australian Bureau of Statistics,2022). This can harm those on fixed incomes, such as retirees. Inflation also has broader implications for the economy.
High inflation leads to a loss of confidence in the currency, leading to a decrease in investment and economic activity and a recession or hyperinflation where prices rise rapidly and uncontrollably. Hence, policymakers try to maintain a stable and low inflation rate to promote economic growth and stability while ensuring that consumers can afford the goods and services needed to maintain their standard of living.
Impact on the inflation rate in Australia:
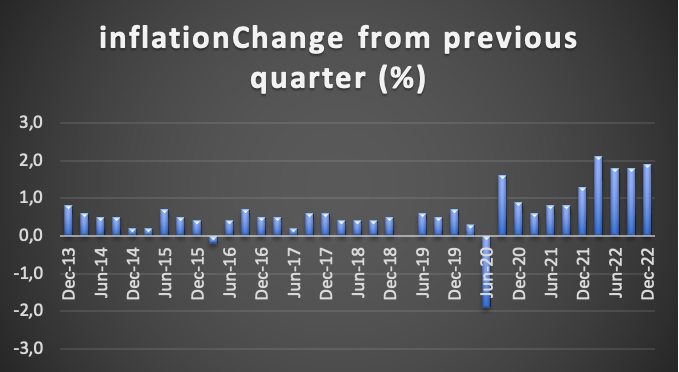
- During the pandemic: from March to June 2020, the inflation rate fell sharply to -1.9%, caused by the global economic downturn caused by the COVID pandemic. Due to the widespread shutdowns and restrictions, consumer demand increased significantly, leading to a decrease in prices for goods and services.
- The inflation rate has been increasing steadily during the post-pandemic recovery stage (Sep 2020 to present). Inflation increased to 1.6% in September 2020,0.9% in December 2020,0.6% in March 2021, 0.8% in June 2021 and 0.8% in September 2021. The major reason for the increase is the reopening of the economy and the subsequent increase in consumer demand for goods and services, causing a price rise.
- Due to the rising energy prices during Mar-December 2022, the inflation rate continued to rise, reaching 2.1% in March 2022,1.8% in June-2022, and 1.8% in September 2022. The surge was due to the rise in energy prices which led to an increase in the cost of production and transportation, hence an increase in the price of goods and services.
To sum up, during the pandemic, inflation reduced due to a decrease in demand; during the post-pandemic phase inflation rate increased due to an increase in demand. The inflation rate rose later due to rising energy prices.
Unexpectedly high inflation benefits individuals who have taken out fixed-rate loans such as mortgages as their debt becomes worth less in real terms. In addition, people with much debt can benefit from unexpected inflation if their income increases faster than their debt. Nevertheless, for those on fixed incomes or without assets or investments, high inflation can decrease their purchasing power. In terms of policymakers, they should propose keeping inflation low and stable as it is a contributor to economic growth and stability(Australian Bureau of Statistics,2022). Adopting renewable energy sources is also a great factor in boosting inflation in Australia, especially in this post-Covid recovery phase.
Deflation is dangerous to the economy as it can lead to decreased consumer demand, lower investment and an increased debt burden. The policymaker’s goal should be to maintain a stable and low inflation rate.
Economic policy challenges
During the COVID-19 pandemic period, a decrease in aggregate demand was seen due to a reduction in consumer and investment spending. In addition, there was a decline in short-run aggregate supply (SR-AS) due to supply chain distributions, shortages in labour and shutdowns. These factors caused a decline in output and a reduction in the price level.
Below is the AD-AS diagram to illustrate this effect:
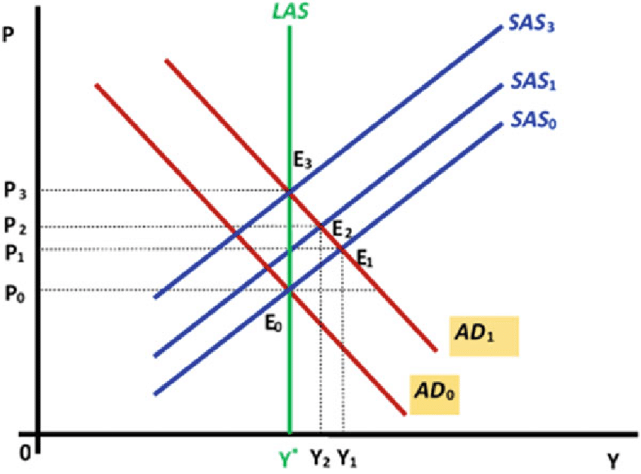
The graph above shows that the Initial equilibrium point is E1, with output at Y1 and price level at P1. The decrease in demand and supply causes the AD1 curve to shift leftwards to AD0, and supply decreases with demand.
During the post-pandemic (recovery phase), aggregate demand increased due to consumer and investment spending. There was also an increase in Short-Run aggregate supply (SR-AS) as enterprises reopened and supply chains reduced. These factors led to an increase in output and price levels. The following AD-AS illustrates this effect.
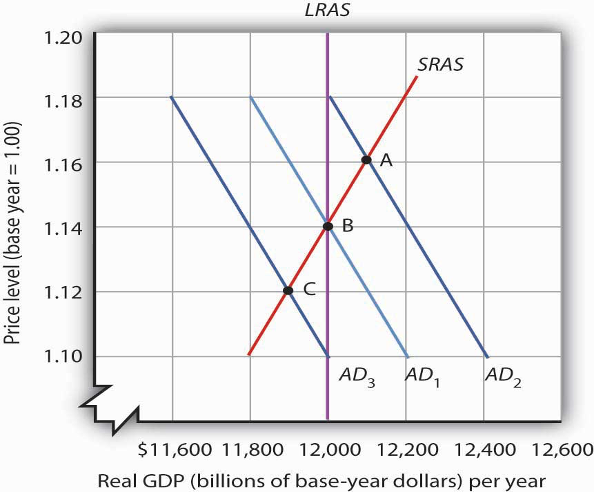
As shown in the graph above, the Initial equilibrium point is C, with output between 11800 and 12000 and a price level of 1.12. The increase in AD and SR-AS causes the AD1 curve to shift rightwards to AD1 and the SR-AS curve to shift upwards. The new equilibrium point is A with output increasing between 12000 and 12200 and the price level increasing to 1.16.
Due to rising energy prices, there was a decrease in Short-Run Aggregate Supply (SR-AS) due to increased production costs. This factor caused a decrease in output and an increase in price ((Nominal GDP, n.d.). Here is the AD-AS diagram to illustrate this effect:
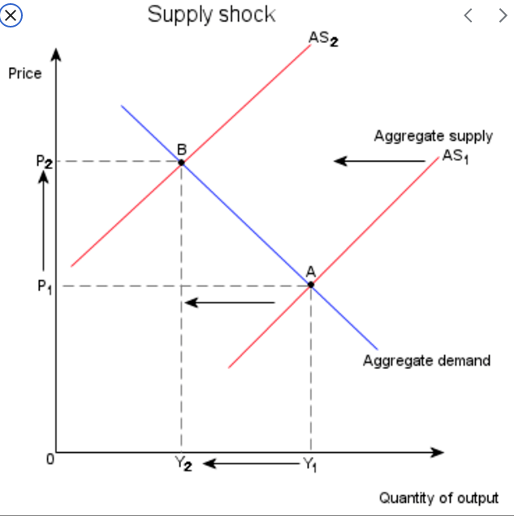
As the graph entails, the Initial equilibrium point is A, with output at Y1 and price level at P1. The decrease in SR-AS causes the AS1 curve to shift upwards to AS2. The new equilibrium point is B, with output decreasing to Y2 and price level increasing to P2.
To sum up, the pandemic led to a decrease in Aggregate Demand and Aggregate Supply in Australia, causing a decrease in output and price level. The post-pandemic economic recovery phase increases demand and supply, causing an increase in output and price level. Rising energy prices caused a decrease in supply, causing a decrease in output and an increase in the price level.
Future economic outlook
To evaluate if Australia is showing signs of economic recovery, some important economic indicators to consider include:
- Gross Domestic Product (GDP): The total value of goods and services produced in a country over a certain period. A strong and growing Gross Domestic Product suggests a good and healthy economy. According to the Australian Bureau of Statistics, the country’s GDP increased by 2.7% from Dec 2021 to Dec 2022, which is a positive sign.
- Unemployment: Employment and unemployment rates can give an idea of how well the job market is doing. In Australia, the unemployment rate has been reducing since its peak in July 2020. As of February 2023, it stands at 3.5%, one of the lowest rates in years. This indicated that there are more job opportunities available for Australians.
- Inflation rate: A low and stable inflation rate indicates a positive sign as it suggests that the economy is not overheating and that the demand for goods and services does not exceed supply. The Australia Bureau of Statistics shows that the inflation rate is increasing, which indicates economic recovery.
Statistics considered when gauging the impact of the COVID-19 pandemic and rising energy costs on people’s well-being include:
- Mental health: The COVID pandemic and economic downturns can significantly impact people’s mental health in Australia. The number of people seeking mental health services or reporting symptoms of anxiety and depression could indicate the psychological toll of the crisis.
- Housing affordability: Affordable housing can be a vital factor in people’s well-being, as it can impact their ability to live in safe and comfortable housing (O’Sullivan et al.,2020). The cost of housing in Australia has been increasing steadily, and rising energy costs could exacerbate this problem.
- Education outcomes: Education is often seen as a pathway to economic opportunity and upward mobility. The pandemic and related disruptions to education could have long-term impacts on students’ academic performance and future career prospects.
Despite the challenges of the COVID-19 pandemic and rising energy prices, Australia has had some positive economic developments. These challenges include:
- Increased investment in renewable energy: Investment in renewable energy sources like wind and solar power has surged due to the growing expense of fossil fuels and worries about climate change (Lim et al.,2021). This has resulted in the production of new jobs and a decrease in Australia’s use of fossil fuels, increasing inflation.
- Adoption of digital technologies: Due to the epidemic, more people are using digital technologies, such as telecommuting and online shopping. Due to this, several industries have seen higher productivity and efficiency, and some people may find that they have a better work-life balance.
References
Australian Bureau of Statistics. (2022, December). Australian National Accounts: National Income, Expenditure and Product. ABS. https://www.abs.gov.au/statistics/economy/national-accounts/australian-national-accounts-national-income-expenditure-and-product/dec-2022.
Australian Bureau of Statistics. (Dec-quarter-2022). Consumer Price Index, Australia. ABS. https://www.abs.gov.au/statistics/economy/price-indexes-and-inflation/consumer-price-index-australia/dec-quarter-2022.
Australian Bureau of Statistics. (2023, February). Labour Force, Australia. ABS. https://www.abs.gov.au/statistics/labour/employment-and-unemployment/labour-force-australia/feb-2023.
Baldwin, R., & Di Mauro, B. W. (2020). Economics in the time of COVID-19: A new eBook. VOX CEPR Policy Portal, 2(3).
Bekaert, G., Engstrom, E., & Ermolov, A. (2020). Aggregate demand and aggregate supply effects of covid-19: A real-time analysis. Available at SSRN 3611399.
Lim, G., Nguyen, V., Robinson, T., Tsiaplias, S., & Wang, J. (2021). The Australian economy in 2020–21: the COVID‐19 pandemic and prospects for economic recovery. Australian Economic Review, 54(1), 5–18.
Nominal GDP: Aggregate Demand. (n.d.). Econlib. Retrieved November 29, 2021, from https://www.econlib.org/nominal-gdp-aggregate-demand/
Mitchell, W. C. (2022). Business cycles and their causes. Univ of California Press.
O’Sullivan, D., Rahamathulla, M., & Pawar, M. (2020). The impact and implications of COVID-19: An Australian perspective. The international journal of community and social development, 2(2), 134–151.
 write
write